
Paper and Paperboard Packaging Market

Paper and Paperboard Packaging Market by Grade (SBS, CUK, FBB, WLC, Glassine & Greaseproof, Label Paper), Type (Corrugated Box, Boxboard, Flexible Paper), Source, Pulping, Application (Food, Beverage, Personal & Homecare), & Region - Global Forecast to 2030


OVERVIEW
Source: Secondary Research, Interviews with Experts, MarketsandMarkets Analysis
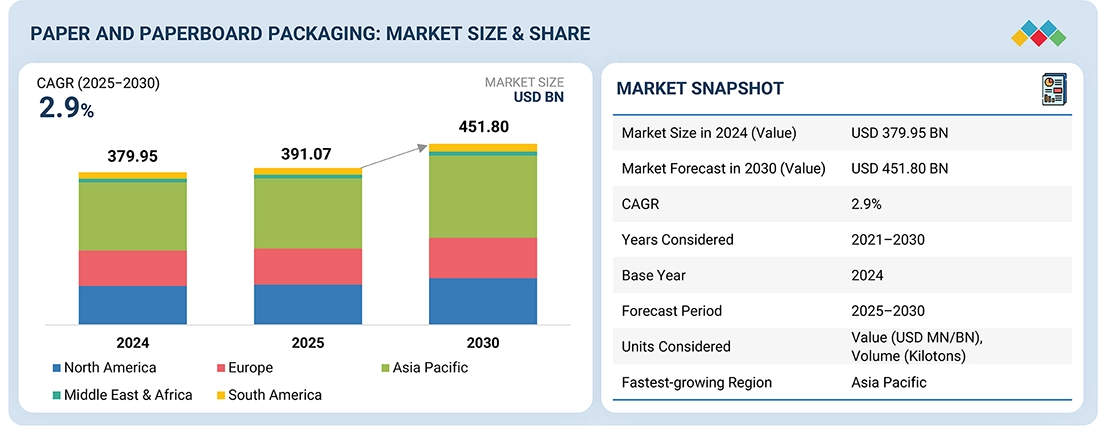
The paper and paperboard packaging market is expected to reach USD 451.80 billion by 2030, up from USD 391.07 billion in 2025, growing at a CAGR of 2.9%. The sector’s growth is driven by demand for sustainable packaging, recyclable and biodegradable products, and the rise of e-commerce requiring lighter, stronger packaging. Industries like food, beverage, pharmaceuticals, and cosmetics increasingly use paper-based packaging to boost branding and sustainability. Factors fueling growth include awareness of plastic waste reduction, new legislation against single-use plastics, and innovation in packaging design for durability and aesthetics. Developing economies will particularly drive this growth due to urbanization and industrialization.
KEY TAKEAWAYS
-
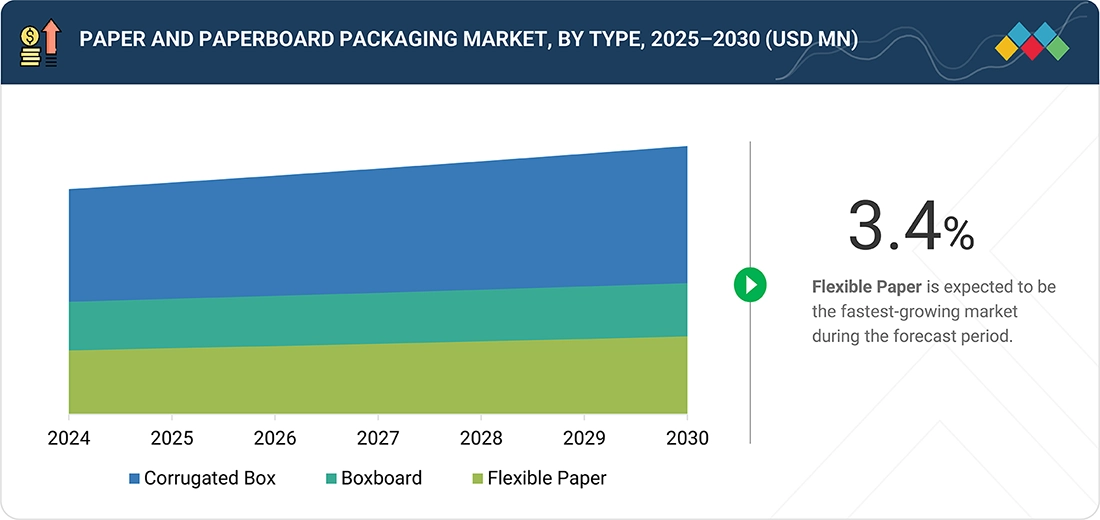
BY TYPEThe paper and paperboard packaging market is categorized by type into corrugated boxes, boxboard, and flexible paper. Corrugated boxes dominate the market due to several reasons, such as acceptance in various multiple application areas (food, beverages, healthcare, e-commerce, etc.). Corrugated boxes provide low-cost packaging solutions that can be customized according to the consumer's needs.
-
BY GRADEThe solid bleached sulphates (SBS) segment held the largest market share in the paper and paperboard packaging market due to its premium quality, excellent printability, and durability. It is versatile and provides good protection for a wide range of products, but it is commonly used in food, beverage, and luxury packaging applications.
-
BY APPLICATIONFood holds the largest share in the paper and paperboard packaging applications market due to the increasing demand for sustainable, eco-friendly, safe, and functional packaging for all types of food. It offers lightweight, easily recyclable packaging options that can be customized according to the consumer's needs.
-
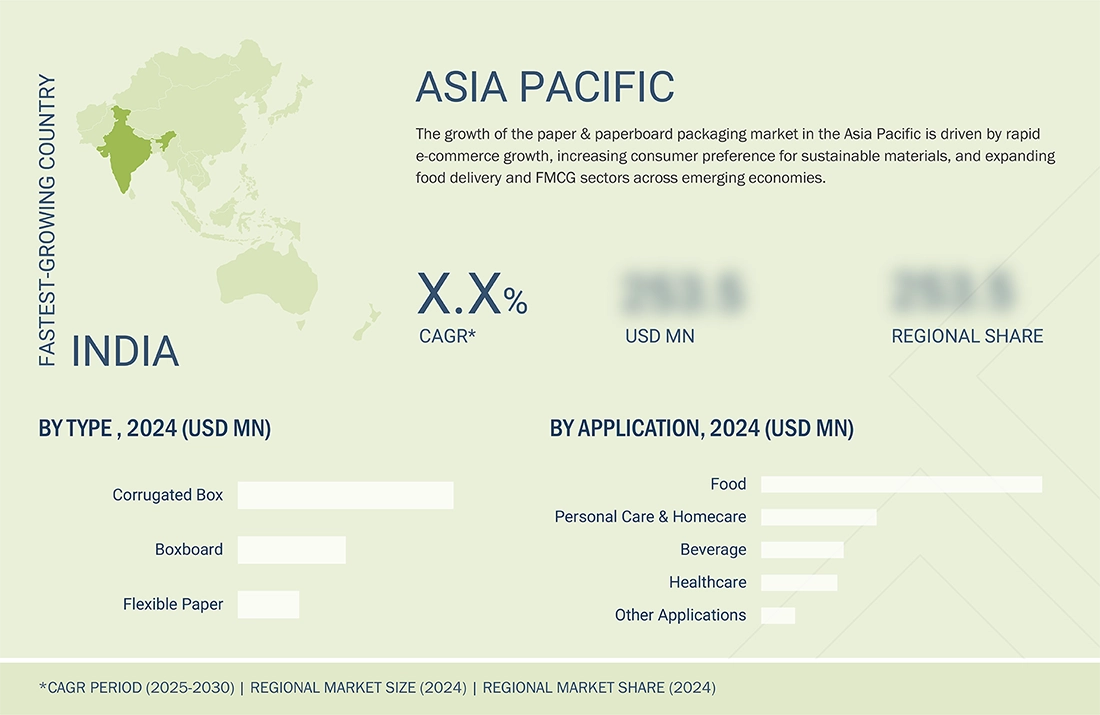
BY REGIONThe Asia Pacific is expected to grow fastest, with a CAGR of 3.2%, driven by growing urbanization, rising demand from end-use application areas such as food, beverage, healthcare, etc.
-
COMPETITIVE LANDSCAPEMondi Group (UK), International Paper (US), Amcor (Switzerland), Smurfit Kappa (Ireland), and Oji Holdings Corporation (Japan) are leading companies of the paper and paperboard packaging market. These companies are pursuing both organic and inorganic growth strategies, such as product launches, acquisitions, and expansions, to increase their market presence.
The paper & paperboard packaging market is expected to see moderate growth due to several factors, such as the expanding e-commerce industry, the need for better packaging materials, the demand to reduce plastic waste, etc. Consumers are becoming increasingly environmentally friendly, leading producers to emphasize paper and paperboard packaging over conventional technologies. This is particularly evident in the food and personal care segments.
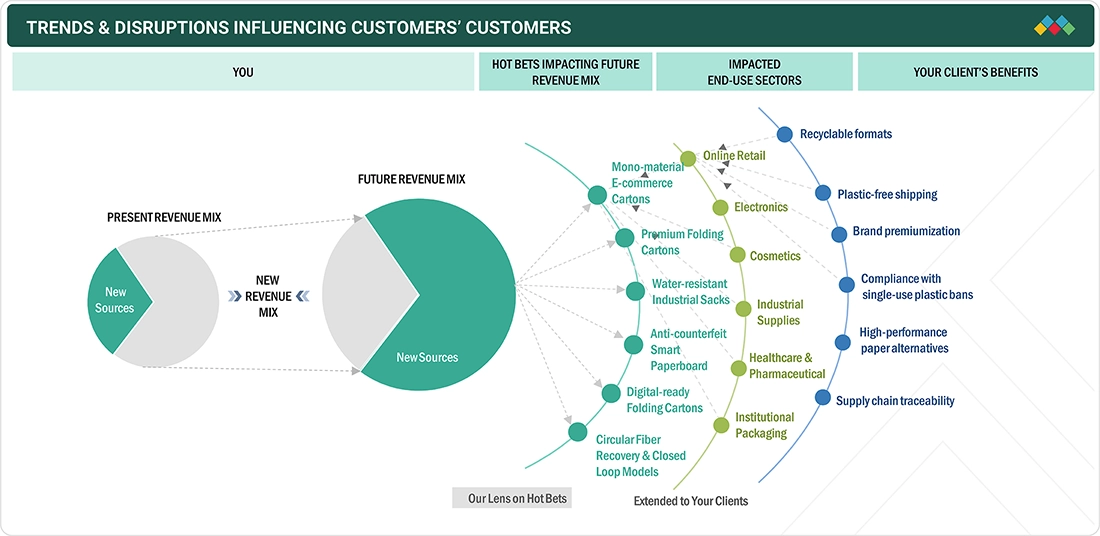
TRENDS & DISRUPTIONS IMPACTING CUSTOMERS' CUSTOMERS
The impact on consumers’ business emerges from customer trends or disruptions. Hot belts are the clients of paper and paperboard packaging manufacturers, and target applications are the clients of paper & paperboard packaging manufacturers. Shifts, which are changing trends or disruptions, will impact the revenues of end users. The revenue impact on end users will affect the revenue of hotbeds, which will further affect the revenues of paper & paperboard packaging manufacturers
Source: Secondary Research, Interviews with Experts, MarketsandMarkets Analysis
MARKET DYNAMICS
Level
-
Growth in demand for recyclable mailers and corrugated inserts in E-commerce packaging

-
Recyclability of paper and paperboard a key driver in adoption of sustainable packaging

Level
-
Limited barrier properties as compared to plastics and materials

-
Price volatility of raw materials

Level
-
Integration of smart packaging technologies with paperboard formats

-
Adoption of agro-residue and alternative fibers in paperboard production

Level
-
Balancing recyclability with barrier performance in food applications

-
Tightening deforestation regulations limiting virgin fiber sourcing

Source: Secondary Research, Interviews with Experts, MarketsandMarkets Analysis
Driver: Growth in demand for recyclable mailers and corrugated inserts in E-commerce packaging
The increasing demand for recyclable mailers and corrugated inserts for e-commerce packaging is driving the paper and paperboard packaging market. As the e-commerce industry expands, the adoption of sustainable solutions to limit plastic waste comes under greater pressure. The recyclable paper mailers and corrugated inserts provide a stronger yet lighter, environmentally sustainable alternative to plastic-based packaging. These materials shield the products while shipping, plus they meet the expectations of consumers willing to choose products with a de facto environmentally responsible side. E-commerce brands are now moving toward paper-based packaging with sustainability in mind, which in turn fuels the paper and paperboard market
Restraint: Limited barrier properties as compared to plastics and materials
Paper and paperboard packaging are limited by their barrier properties compared to plastics and other materials. They are less effective at protecting products from moisture, oxygen, and light, crucial for maintaining freshness, especially in the food and beverage industry. While plastic packaging offers better protection, additional coatings or laminations are needed for paper products, increasing costs and reducing disposability. Therefore, paper-based packaging may not suit products requiring high protection, like perishables and pharmaceuticals. The inability to fully replace plastics limits market potential in industries needing preservation. Despite ongoing innovations, a gap remains between paper and plastic barrier qualities, restricting wider use in some sectors.
Opportunity: Integration of smart packaging technologies with paperboard formats
The fusion of smart packaging technologies with paperboard formats creates evolving opportunities in the paper industry by merging sustainability with enhanced functionality. As consumer preferences shift toward sustainable and engaging packaging, technologies such as RFID, NFC, QR codes, sensors, and augmented reality can be incorporated into recyclable paperboard to improve product tracking, authentication, condition monitoring, and consumer engagement. This enables companies to increase supply chain transparency, manage inventory better, and deliver personalized content, fostering brand differentiation. For example, QR codes on food packaging can provide real-time updates on freshness, nutrition, or recipes, adding value for consumers. At the same time, businesses benefit from reduced waste, streamlined logistics, and meeting sustainability goals and regulations. Smart paperboard packaging merges digital innovation with eco-friendly design, becoming increasingly appealing across sectors like food, healthcare, and cosmetics, and driving growth in the packaging industry.
Challenge: Balancing recyclability with barrier performance in food applications
Packaging manufacturers struggle to develop environmentally friendly yet functional solutions. While paperboard is recyclable and biodegradable, it doesn't offer sufficient protection against moisture, oxygen, grease, or contaminants affecting shelf life and quality. Plastics and waxes improve barriers but hinder recycling, increasing environmental impact. Managers must explore advanced, recyclable barrier materials or coatings. Increasing regulations and consumer demands make this a pressing issue. Different food segments have diverse barrier requirements, so no single solution suffices, making R&D investment more challenging.
Paper and Paperboard Packaging Market: COMMERCIAL USE CASES ACROSS INDUSTRIES
| COMPANY | USE CASE DESCRIPTION | BENEFITS |
|---|---|---|
 |
Green Bay Packaging sought to digitize and optimize its recycling operations to eliminate inefficiencies associated with manual processes, improve inspection tracking, and enhance overall operational efficiency. | The company implemented Augmentir's Connected Worker solution to digitize processes for plant inspections, facility checks, safety checklists, and auditing procedures. This digital transformation eliminated manual data capture, provided enhanced documentation for OEM and warranty communications, and standardized inspections across multiple sites. The adoption of this technology led to improved accountability, streamlined operations, and a more efficient recycling process. |
 |
Priwatt, a German solar energy company, aimed to enhance its packaging to support increased production volumes and reduce damage rates during transportation. The existing packaging was not sufficiently robust, leading to product damages and inefficiencies in the supply chain | Smurfit Kappa partnered with Priwatt to develop an improved packaging solution tailored to the specific needs of solar panels. The new design focused on enhancing protection, reducing material usage, and optimizing the packaging process. As a result, Priwatt more than tripled its daily output and significantly reduced damage rates, leading to cost savings and improved customer satisfaction. |
 |
Metsä Board, a leading European producer of premium fresh fiber paperboards, sought to improve the functionality, recyclability, and brand impact of its customers' packaging solutions. The company aimed to maximize product performance while minimizing both, carbon footprint and costs | Metsä Board implemented the 3DEXPERIENCE platform to enhance its packaging design and development processes. This digital solution enabled the company to create innovative, sustainable packaging solutions that met customer demands for both performance and environmental responsibility. The platform facilitated collaboration across teams, streamlined workflows, and reduced time-to-market for new packaging designs. |
Logos and trademarks shown above are the property of their respective owners. Their use here is for informational and illustrative purposes only.
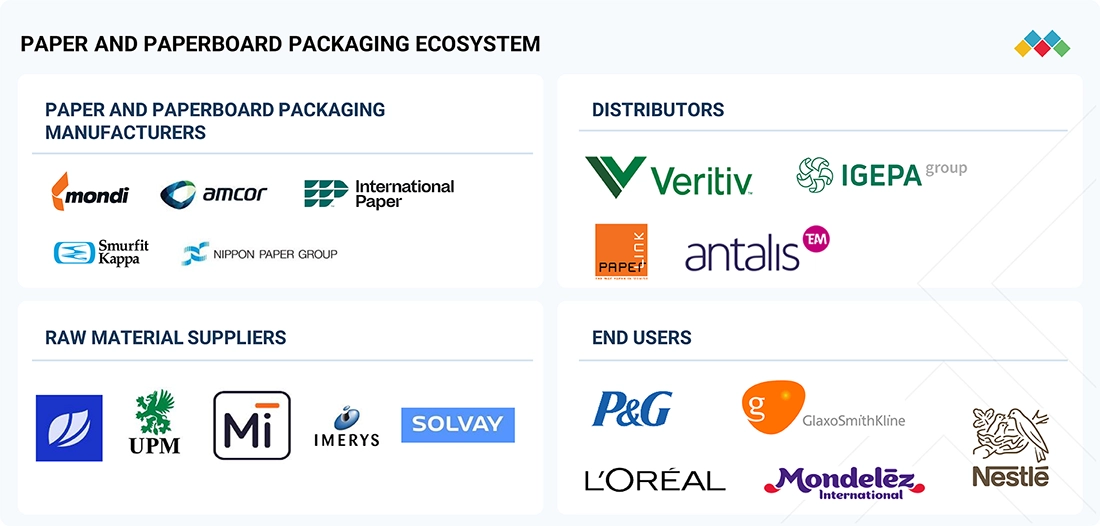
MARKET ECOSYSTEM
The paper and paperboard packaging market features a tightly integrated value chain, covering raw material procurement, manufacturing, and end-use industries like food, e-commerce, healthcare, and consumer products. It relies on virgin and recycled fibers, pulp, adhesives, coatings, and barriers, which are processed to achieve the desired strength, flexibility, and printability. Innovation in lightweight packaging, digital printing, and renewable materials boosts efficiency and performance. Regulatory standards, technological advancements, and circular economy practices drive competitiveness and environmental responsibility across the global value chain.
Logos and trademarks shown above are the property of their respective owners. Their use here is for informational and illustrative purposes only.
MARKET SEGMENTS
Source: Secondary Research, Interviews with Experts, MarketsandMarkets Analysis
Paper and Paperboard Packaging Market, By Type
Corrugated boxes dominate the paper packaging market due to their strength, cost-effectiveness, and versatility. The inner layer provides cushioning, rigidity, and compression resistance, protecting goods during storage and transit. Their lightweight design reduces shipping costs and ensures safety in fast supply chains. Driven by e-commerce, retail, and logistics growth, they are durable, sustainable, and customizable in size, shape, and printing for branding and consumer appeal. Made mainly from recycled materials, they align with sustainability goals. Innovations like water-resistant coatings and digital graphics enhance their functionality. Amid regulations to cut plastic and rising eco-friendly demand, corrugated boxes remain the preferred choice for safe, sustainable product distribution across industries.
Paper and Paperboard Packaging Market, By Grade
The Solid Bleached Sulfate (SBS) grade dominates the global paper and paperboard packaging market due to its ideal balance of aesthetics, strength, and versatility. Made from virgin bleached pulp, SBS offers a bright surface for high-quality printing, embossing, and coating, enabling brands to create appealing graphics and finishes. It is preferred in food, beverage, pharmaceutical, cosmetic, and consumer products for its stiffness, smoothness, and purity. SBS is FDA-compliant for various food items and is increasingly in demand due to trends toward sustainable luxury packaging. Advances in coating and barrier technologies will further improve its resistance to moisture, grease, and heat, broadening its applications.
Paper and Paperboard Packaging Market, By Applications
The food segment dominates the applications market due to its need for sustainable, safe, and economical packaging. Paper packaging is popular for baked goods, ready-to-eat, frozen foods, beverages, and fast foods because it protects, keeps products fresh, and is versatile. Rising environmental awareness encourages a shift from plastic to recyclable and biodegradable paper. The growing demand for convenience foods boosts the adoption of lightweight, disposable options like cartons, wrappers, trays, and cups. Consumers prefer paper packaging for easy printing, branding, and shelf appeal. Advances in coatings improve moisture, grease, and heat resistance, expanding use in various foods. Stricter regulations against single-use plastics and investment in compostable solutions support this trend. These factors make the food segment the largest and most promising market drive.
REGION
Asia Pacific's urban growth and growing end-use application areas drive paper and paperboard packaging demand
The APAC dominates the paper & paperboard packaging market due to urbanization, population growth, and increased demand for sustainable packaging driven by e-commerce and retail expansion. The region’s manufacturing hubs and access to raw materials offer cost advantages. Local sustainability initiatives and consumer awareness promote recyclable options, while technological advances boost quality and aesthetics for various products. Low labor costs and investments further strengthen APAC's market position.
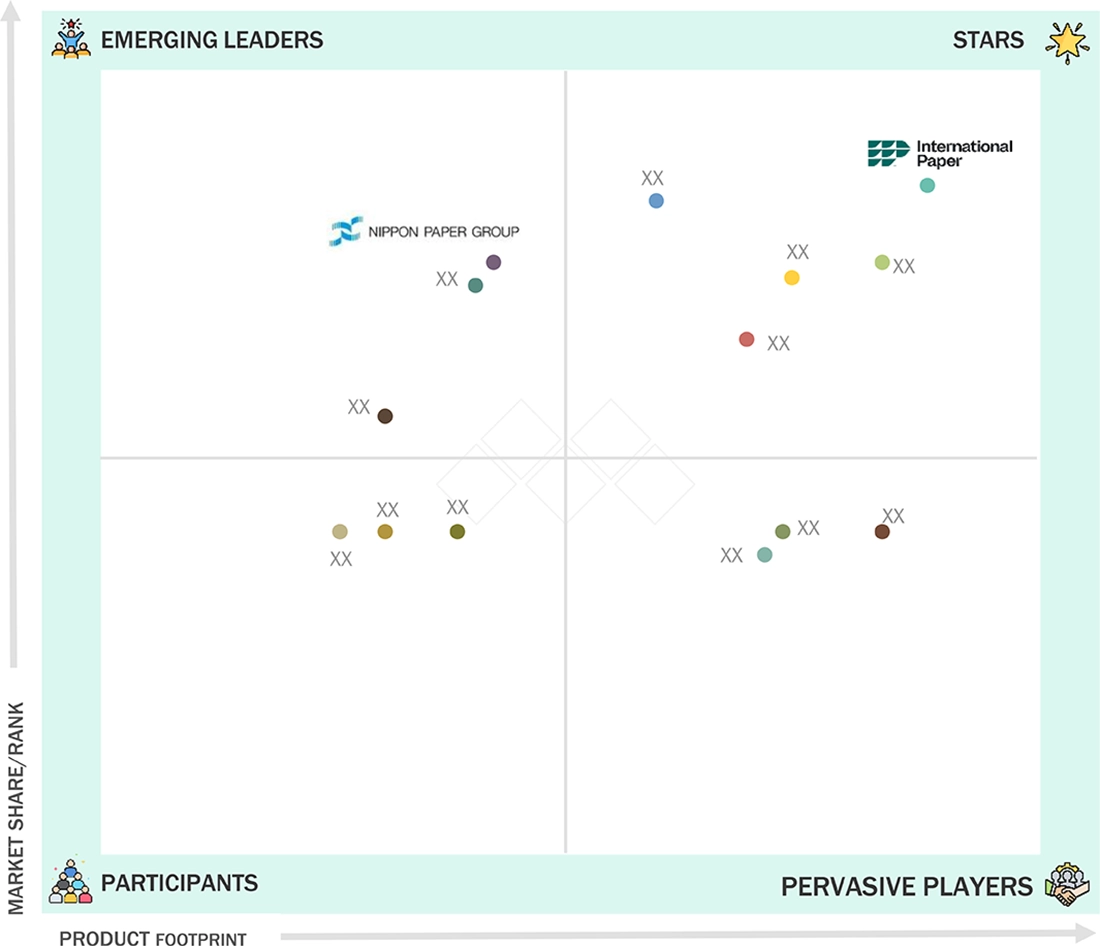
Paper and Paperboard Packaging Market: COMPANY EVALUATION MATRIX
International Paper (Star) dominates the paper and paperboard packaging market due to its diversified product range, robust global supply chain, and extensive experience in sustainable packaging. It is an innovation-driven company serving markets including food and beverage, e-commerce, and consumer goods, with operational excellence and customer-centric product offerings that adapt to the changing needs of industries. On the other hand, Nippon Paper Group has emerged as a leading player, driven by its significant investment in R&D, adoption of state-of-the-art technologies in production, and commitment to sustainable sourcing. The group has adopted a partnership approach with specialty brands, offering sustainable packaging solutions that further strengthen its market reputation and competitive advantages.
Source: Secondary Research, Interviews with Experts, MarketsandMarkets Analysis
KEY MARKET PLAYERS
MARKET SCOPE
| REPORT METRIC | DETAILS |
|---|---|
| Market Size in 2024 (Value) | USD 379. 95 Billion |
| Market Forecast in 2030 (Value) | USD 451.80 Billion |
| Growth Rate | CAGR of 2.9% from 2025-2030 |
| Years Considered | 2021-2030 |
| Base Year | 2024 |
| Forecast Period | 2025-2030 |
| Units Considered | Value (USD Million/Billion), Volume (Kiloton) |
| Report Coverage | Revenue forecast, company ranking, competitive landscape, growth factors, and trends |
| Segments Covered |
|
| Regions Covered | North America, Asia Pacific, Europe, South America, the Middle East & Africa |
WHAT IS IN IT FOR YOU: Paper and Paperboard Packaging Market REPORT CONTENT GUIDE
DELIVERED CUSTOMIZATIONS
We have successfully delivered the following deep-dive customizations:
| CLIENT REQUEST | CUSTOMIZATION DELIVERED | VALUE ADDS |
|---|---|---|
| Greaseproof Paper & Paperboard Packaging |
|
|
RECENT DEVELOPMENTS
- May 2025 : International Paper announced the groundbreaking of its new state-of-the-art sustainable packaging box plant in Waterloo, Iowa. Strategically located in the heart of the Midwest, the facility will focus on serving the protein segment, offering customized packaging solutions to meet the rising demand for high-quality, sustainable packaging.
- April 2025 : Mondi expanded its packaging portfolio and production capacity by completing the acquisition of Schumacher Packaging’s Western Europe operations. With this move, Mondi added solid board solutions to its product range, enhancing its ability to offer tailored packaging for eCommerce, FMCG, and other sectors.
- March 2025 : Amcor has launched its new AmFiber Performance Paper stand-up pouch, which is used to package instant coffee and dry beverage products.
- January 2025 : International Paper announced the completion of its acquisition of DS Smith plc, creating a global leader in sustainable packaging solutions. The merger combines the strengths of both companies, establishing the world’s leading sustainable packaging company focused on innovation, efficiency, and environmental responsibility.
- September 2023 : Solvay expanded its China Research & Innovation Center (R&I) with the inauguration of a new research building in the Solvay Shanghai Technology Park. The company invested over 4 billion RMB (approximately USD 541 million) in its Chinese R&I hub since 2005 to better support local customers and meet growing regional demand for innovative, sustainable solutions.
Table of Contents
 Exclusive indicates content/data unique to MarketsandMarkets and not available with any competitors.
Methodology
The study involved four major activities for estimating the current global size of the paper and paperboard packaging market. Exhaustive secondary research was conducted to gather information on the market, the peer market, and the parent market. The next step was to validate these findings, assumptions, and sizes with the industry experts across the value chain of paper and paperboard packaging through primary research. Both, the top-down and bottom-up approaches were employed to estimate the overall size of the paper and paperboard packaging market. After that, market breakdown and data triangulation procedures were used to determine the size of different segments and subsegments of the market.
Secondary Research
Various primary sources from both, the supply and demand sides of the paper and paperboard packaging market were interviewed to obtain qualitative and quantitative information. The primary sources from the supply side included industry experts, such as Chief Executive Officers (CEOs), vice presidents, marketing directors, sales professionals, and related key executives from various leading companies and organizations operating in the paper & paperboard packaging industry. The breakdown of the profiles of primary respondents is as follows:
Primary Research
Various primary sources from both, the supply and demand sides of the paper and paperboard packaging market were interviewed to obtain qualitative and quantitative information. The primary sources from the supply side included industry experts, such as Chief Executive Officers (CEOs), vice presidents, marketing directors, sales professionals, and related key executives from various leading companies and organizations operating in the paper & paperboard packaging industry. The breakdown of the profiles of primary respondents is as follows:
Breakdown of Primary Interviews

Note: Companies are classified based on their revenue–Tier 1 = >USD 7 billion, Tier 2 = USD 500 million to USD 7 billion, and Tier 3 = < USD 500 million.
Others include sales, marketing, and product managers.
To know about the assumptions considered for the study, download the pdf brochure
Market Size Estimation
Both, the top-down and bottom-up approaches were used to estimate and validate the global size of the paper and paperboard packaging market. These approaches were also used extensively to estimate the size of various dependent segments of the market. The research methodology used to estimate the market size included the following details:
- The key players were identified through extensive secondary research.
- The industry’s supply chain and market size, in terms of value, were determined through primary and secondary research processes.
- All percentage shares, splits, and breakdowns were determined using secondary sources and verified through primary sources.
- All possible parameters that affect the markets covered in this research study were accounted for, viewed in extensive detail, verified through primary research, and analyzed to obtain the final quantitative and qualitative data.
- The research includes the study of reports, reviews, and newsletters of key industry players, along with extensive interviews with key officials, such as directors and marketing executives.

Data Triangulation
After arriving at the overall market size from the estimation process explained above, the total market was split into several segments and subsegments. The data triangulation and market breakdown procedures were employed, wherever applicable, to complete the overall market engineering process and arrive at the exact statistics for all segments and subsegments of the paper and paperboard packaging market. The data was triangulated by studying various factors and trends from both, the demand- and supply-sides.
In addition, the market size was validated by using both, the top-down and bottom-up approaches. Then, it was verified through interviews with experts. Hence, for every data segment, there are three sources—top-down approach, bottom-up approach, and interviews with experts. The data was assumed to be correct when the values arrived at from the three sources matched.
Market Definition
Paper & paperboard packaging refers to packaging materials made from cellulose fibers derived from wood, recycled paper, or agricultural residues. Paper is typically lightweight and flexible, while paperboard is thicker and more rigid, making it suitable for folding cartons, boxes, and trays. These materials are widely used across the food, beverages, personal care, and consumer goods industries due to their recyclability, biodegradability, and printability, offering an eco-friendly alternative to plastic and other non-renewable packaging formats.
Stakeholders
- Paper & paperboard packaging manufacturers
- Paper & paperboard packaging distributors
- Raw material suppliers
- Research & development entities
- Industry associations and regulatory bodies
- End users
Report Objectives
- To estimate and forecast the paper & paperboard packaging market, in terms of value and volume
- To provide detailed information about the major factors (drivers, restraints, opportunities, and challenges) influencing market growth
- To define, describe, and forecast the market size, based on grade, type, application, and region
- To forecast the market size along with segments and submarkets, in key regions: North America, Europe, Asia Pacific (APAC), Middle East & Africa (MEA), and South America, along with their key countries
- To strategically analyze micromarkets, for individual growth trends, prospects, and their contribution to the total market
- To analyze growth opportunities in the market for stakeholders and provide details on the competitive landscape for market leaders
- To strategically profile key players and comprehensively analyze their market shares and core competencies
- To analyze competitive developments, such as mergers & acquisitions, expansions & investments, and agreements in the paper and paperboard packaging market
Key Questions Addressed by the Report
What are the major drivers influencing the growth of the paper and paperboard packaging market?
Rising consumer preference for sustainable paper-based packaging, recyclability as a driver for sustainable packaging, growth in e-commerce packaging demand, and legislative bans on single-use plastics promoting fiber-based alternatives are key growth drivers.
What are the major challenges in the paper and paperboard packaging market?
Balancing recyclability with barrier performance in food packaging and tightening deforestation regulations that limit virgin fiber sourcing are major challenges.
What are the restraining factors in the paper and paperboard packaging market?
Limited barrier properties compared to plastics and metals, along with price volatility of raw materials, are key restraining factors.
What is the key opportunity in the paper and paperboard packaging market?
The integration of smart packaging technologies and the use of agro-residue or alternative fibers in paperboard production present major opportunities for market growth.
Who are the key players in the paper & paperboard packaging market?
Key players include Mondi Group (UK), International Paper (US), Smurfit Kappa (Ireland), NIPPON PAPER INDUSTRIES CO., LTD. (Japan), Amcor (Switzerland), Oji Holdings Corporation (Japan), ITC Limited (India), Metsä Group (Finland), Clearwater Paper Corporation (US), and Packaging Corporation of America (US).
Need a Tailored Report?
Customize this report to your needs
Get 10% FREE Customization
Customize This ReportPersonalize This Research
- Triangulate with your Own Data
- Get Data as per your Format and Definition
- Gain a Deeper Dive on a Specific Application, Geography, Customer or Competitor
- Any level of Personalization
Let Us Help You
- What are the Known and Unknown Adjacencies Impacting the Paper and Paperboard Packaging Market
- What will your New Revenue Sources be?
- Who will be your Top Customer; what will make them switch?
- Defend your Market Share or Win Competitors
- Get a Scorecard for Target Partners

Custom Market Research Services
We Will Customise The Research For You, In Case The Report Listed Above Does Not Meet With Your Requirements
Get 10% Free CustomisationTESTIMONIALS

We at Nissan Chemicals Corporation have been clients of MarketsandMarkets for more than a year now. We recently consulted MarketsandMarkets for a study, the team at MarketsandMarkets was extremely professional and organized. The business insights were very detailed and aligned well with our expectations that really helped us formulate the Business Plans and device new strategies for development themes. MarketsandMarkets offers a unique combination of expertise and dedicated engagement model. Their research findings have helped us in designing our Pricing Strategy which will make it easier for us to predict the future sales and profits for the next ten years. We look forward to working with MarketsandMarkets in the future.
VP of Strategy & New Business Development
Leading Specialty Chemical Company
The MarketsandMarkets Engagement Model, composed of both the Knowledge Store and advisory custom research, has greatly helped us in understanding our markets and making strategic decisions. The Knowledge Store is a fast way to allow everyone in our organization to understand more about most any market they are interested in. The ability to then get custom research done and get answers to specific strategic questions and market insight has been spectacular. The Markets and Markets team feel more like colleagues than vendors and their services have helped us change our culture where statements of things like growth opportunities and competitive position are always backed by industry research.

Rich Gibson,
Director, Corporate Strategy
Milliken & Company,
Leading Industrial Manufacturer of specialty chemical, floor covering, performance and protective textile materials, and healthcaremilliken.com
MarketsandMarkets is a trusted resource that helps us to better understand markets that are near-adjacencies-whether its technology, value chain or geography. Their Knowledge Store platform provides a dashboard of markets and their characteristics which is easy to use and saves us time.
Adam Shaw,
Market Development and Strategy Manager
AdvanSix Inc. USA,
An American Leader in Chemicalswww.advansix.com
The Knowledge Store from MarketsandMarkets is a valuable tool which has helped my team acquire greater insight in to the end markets that our business serves. This has enabled us to help our company build stronger strategies throughout our planning process.
TOSHIO KINOSHITA
Senior Chif Consultion Research & Consulting Division
Mitsubishi Chemical Research Corporation,
Leading Manufacturer of Chemical Productswww.mitsubishichem-res.co.jp/en/

We recently engaged with MarketsandMarkets for a study, the team not only clearly understood our business objectives but was also extremely professional in the way they handled the entire project. The study was efficiently conducted in a phase-wise manner, and the engagement model furnished us with high-quality business insights that far exceeded our expectations at each phase. We were especially happy that MarketsandMarkets could provide us with both, an English as well as a Japanese version of the study. A special thanks to the Analyst Team and Client Services Team, whose fluency in Japanese enhanced our comfort level, as we could converse with them in our preferred language.
Independent entrepreneurs
Arrow Precision
We approached MarketsandMarkets for study on Proppants Market, and their work exceeded our expectations. The study conducted was comprehensive and enabled us to view the market through the various dimensions. In addition, the team was extraordinarily responsive throughout the process and resolved our queries on time. I strongly recommend MarketsandMarkets and will certainly consider them for additional market assessments we will need in the future.
Global engineering company, Japan
Deputy Manager,
Strategic Planning OfficeThe high-quality insights shared by the MarketsandMarkets team helped us understand the pharmaceutical plant designers in a specific geography. It also captured the risks that we may likely face in communicating with our potential partners. The study would enable us identify partners, which would impact our future growth.


Growth opportunities and latent adjacency in Paper and Paperboard Packaging Market