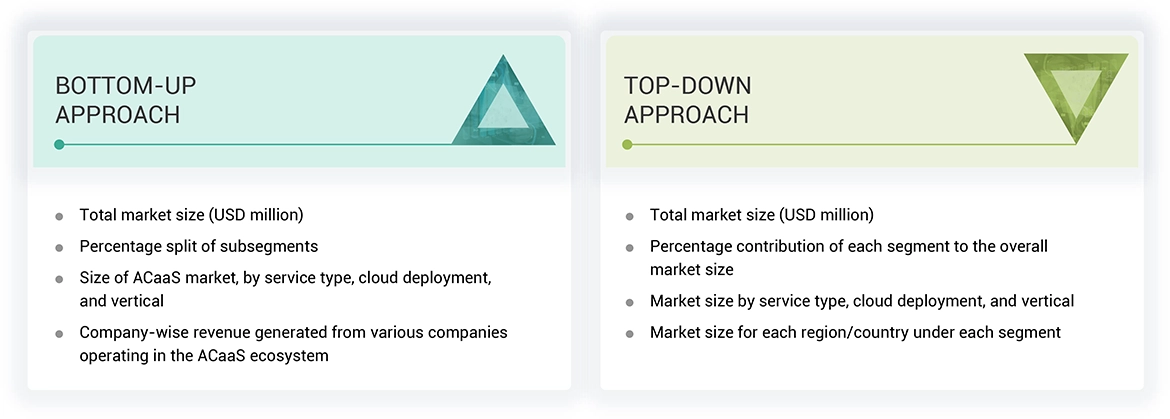
The study involved four major activities in estimating the current size of the access control as a service market—exhaustive secondary research collected information on the market, peer, and parent markets. The next step was to validate these findings, assumptions, and sizing with industry experts across the value chain through primary research. Both top-down and bottom-up approaches were employed to estimate the complete market size. After that, market breakdown and data triangulation were used to estimate the market size of segments and subsegments.
Secondary Research
Various secondary sources have been referred to in the secondary research process to identify and collect information important for this study. The secondary sources include annual reports, press releases, and investor presentations of companies; white papers; journals and certified publications; and articles from recognized authors, websites, directories, and databases. Secondary research has been conducted to obtain critical information about the industry’s supply chain, the market’s value chain, the total pool of key players, market segmentation according to the industry trends (to the bottom-most level), regional markets, and key developments from market- and technology-oriented perspectives. The secondary data has been collected and analyzed to determine the overall market size, further validated by primary research.
List of major secondary sources
Primary Research
In the primary research process, various primary sources from both the supply and demand sides were interviewed to obtain qualitative and quantitative information for this report. The primary sources from the supply side included industry experts, such as Chief Executive Officers (CEOs), Vice Presidents (VPs), marketing directors, technology and innovation directors, and related key executives from various key companies and organizations operating in the blockchain market. After the complete market engineering (calculations for market statistics, market breakdown, market size estimations, market forecasting, and data triangulation), extensive primary research was conducted to gather information and verify and validate the critical numbers arrived at. Primary research was also conducted to identify the segmentation types, industry trends, competitive landscape of blockchain solutions offered by various market players, and key market dynamics, such as drivers, restraints, opportunities, challenges, industry trends, and key player strategies.
In the complete market engineering process, the top-down and bottom-up approaches were extensively used, along with several data triangulation methods, to perform the market estimation and market forecasting for the overall market segments and subsegments listed in this report. Extensive qualitative and quantitative analysis was performed on the complete market engineering process to list the key information/insights throughout the report.
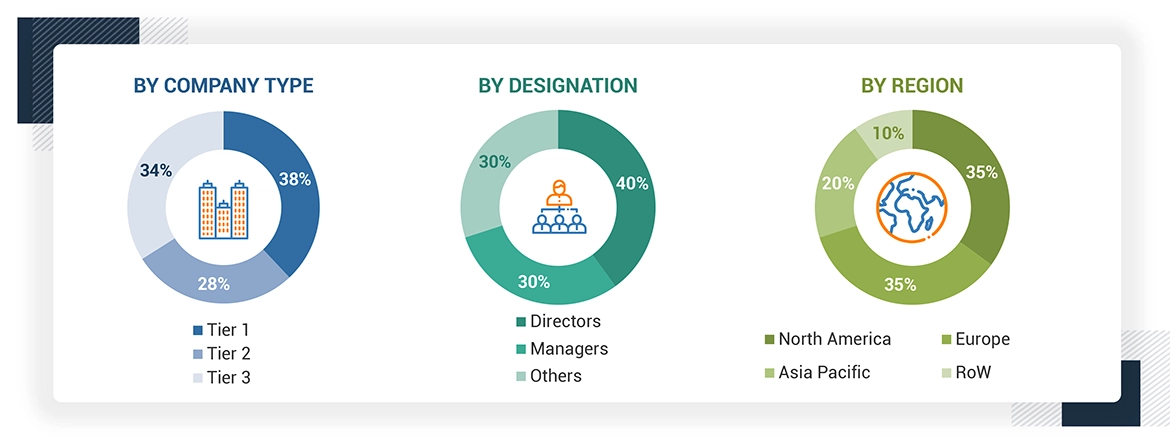
Note: Other designations include sales managers, marketing managers, and product managers.
The three tiers of the companies have been defined based on their total revenue as of 2023: tier 1: revenue greater than USD 1 billion, tier 2: revenue between USD 500 million and USD 1 billion, and tier 3: revenue less than USD 500 million.
About the assumptions considered for the study, To know download the pdf brochure
Market Size Estimation
In the complete market engineering process, top-down and bottom-up approaches and several data triangulation methods have been used to estimate and forecast the overall market segments and subsegments listed in this report. Key players in the market have been identified through secondary research, and their market shares in the respective regions have been determined through primary and secondary research. This entire procedure includes the study of annual and financial reports of the top market players and extensive interviews for key insights (quantitative and qualitative) with industry experts (CEOs, VPs, directors, and marketing executives).
All percentage shares, splits, and breakdowns have been determined using secondary sources and verified through primary sources. All the parameters affecting the markets covered in this research study have been accounted for, viewed in detail, verified through primary research, and analyzed to obtain the final quantitative and qualitative data. This data has been consolidated and supplemented with detailed inputs and analysis from MarketsandMarkets and presented in this report. The following figure represents this study’s overall market size estimation process.
Data Triangulation
After arriving at the overall market size from the above estimation process, the market has been split into several segments and subsegments. The data triangulation procedure has been employed wherever applicable to complete the overall market engineering process and arrive at the exact statistics for all segments and subsegments. The data has been triangulated by studying various factors and trends from both the demand and supply sides. Additionally, the market size has been validated using top-down and bottom-up approaches.
Market Definition
ACaaS combines the benefits of Software as a Service (SaaS) with on-premises access control devices. These cloud-based solutions control access remotely and backup and store data securely, providing permanent records of who accessed controlled areas or systems. It is a service provided by ACaaS companies that provides value-added functions to organizations in different verticals, such as residential, commercial, education, government bodies, manufacturing & industrial, retail, and transportation. ACaaS gives administrators the ability to manage a system and review logs anytime, anywhere, through a web browser. It also enables the management of all facilities of a multi-location business from a central location. It is easier to add more users and change permissions using ACaaS. Some systems even allow users to use their smartphones to verify their identity access.
Key Stakeholders
-
Raw Material Suppliers
-
Original Equipment Manufacturers (OEMs)
-
Original Design Manufacturers (ODMs)
-
Research Institutes
-
Access Control Service as a Service Provider
-
Forums, Alliances, and Associations
-
Governments and Financial Institutions
-
Analysts and Strategic Business Planners
-
Government and Corporate Bodies
-
Research Institutes and Organizations
-
Venture Capitalists, Private Equity Firms, and Startup Companies
-
Distributors and Traders
-
End Users
Report Objectives
-
To define and forecast the access control as a servicemarket based on service tyeps, cloud deployment types and verticals in terms of value for access control as a service.
-
To describe and forecast the access control as a service market based on four key regions, namely, North America, Europe, Asia Pacific, and the Rest of the World (RoW), along with their respective countries
-
To provide detailed information regarding drivers, restraints, opportunities, and challenges influencing the growth of the market
-
To strategically analyze micromarkets with respect to individual growth trends, prospects, and contributions to the overall market size
-
To study the complete value chain of the access control as a service market
-
To analyze opportunities in the market for stakeholders by identifying high-growth segments of the access control as a service ecosystem
-
To strategically profile the key players and comprehensively analyze their market positions in terms of their ranking and core competencies, and provide a detailed competitive landscape
-
To analyze competitive developments, such as product launches and developments, acquisitions, collaborations, agreements, and partnerships, in the access control as a service market
Available Customizations
With the given market data, MarketsandMarkets offers customizations according to the specific requirements of companies. The following customization options are available for the report:
Company Information:
-
Detailed analysis and profiling of additional market players (up to 5)
-
Additional country-level analysis of the access control as a servicemarket
Product Analysis
-
Product matrix provides a detailed comparison of the product portfolio of each company in the access control as a servicemarket.

 Market")


 Market")
 Market Companies")
 LARGEST MARKET SHARE IN 2023
 INDIA FASTER-GROWING MARKET IN REGION
 Market Size, and Share")


Rob
Jul, 2019
Hi there. We are developing an innovative access control solution that we intend to offer as a service. Wanted to get some basic market information on things like market size, growth rate, major players of Access Control Market as a Service.
Kaitlin
Dec, 2017
Looking into the markets of contractors and worker safety credentials and cloud based access control for industrial and construction markets..
Kristian
Mar, 2019
Hi, I�m currently acting as a project manager for Securitas future path towards ACaaS. I would appreciate if you could provide me all types of information about ACaaS..
Jacob
Dec, 2019
Trying to understand total market size for the ACaaS space and what drives customer switching behavior..