
AI-based Image Analysis Market Size, Share & Trends

AI-based Image Analysis Market Size, Share & Trends by Deployment Mode (On-premises, Cloud-based), Technology (Deep Learning, Traditional Machine Learning, Hybrid & Other AI Technologies), End-use Industry and Region - Global Forecast to 2030


AI-based Image Analysis Market OVERVIEW
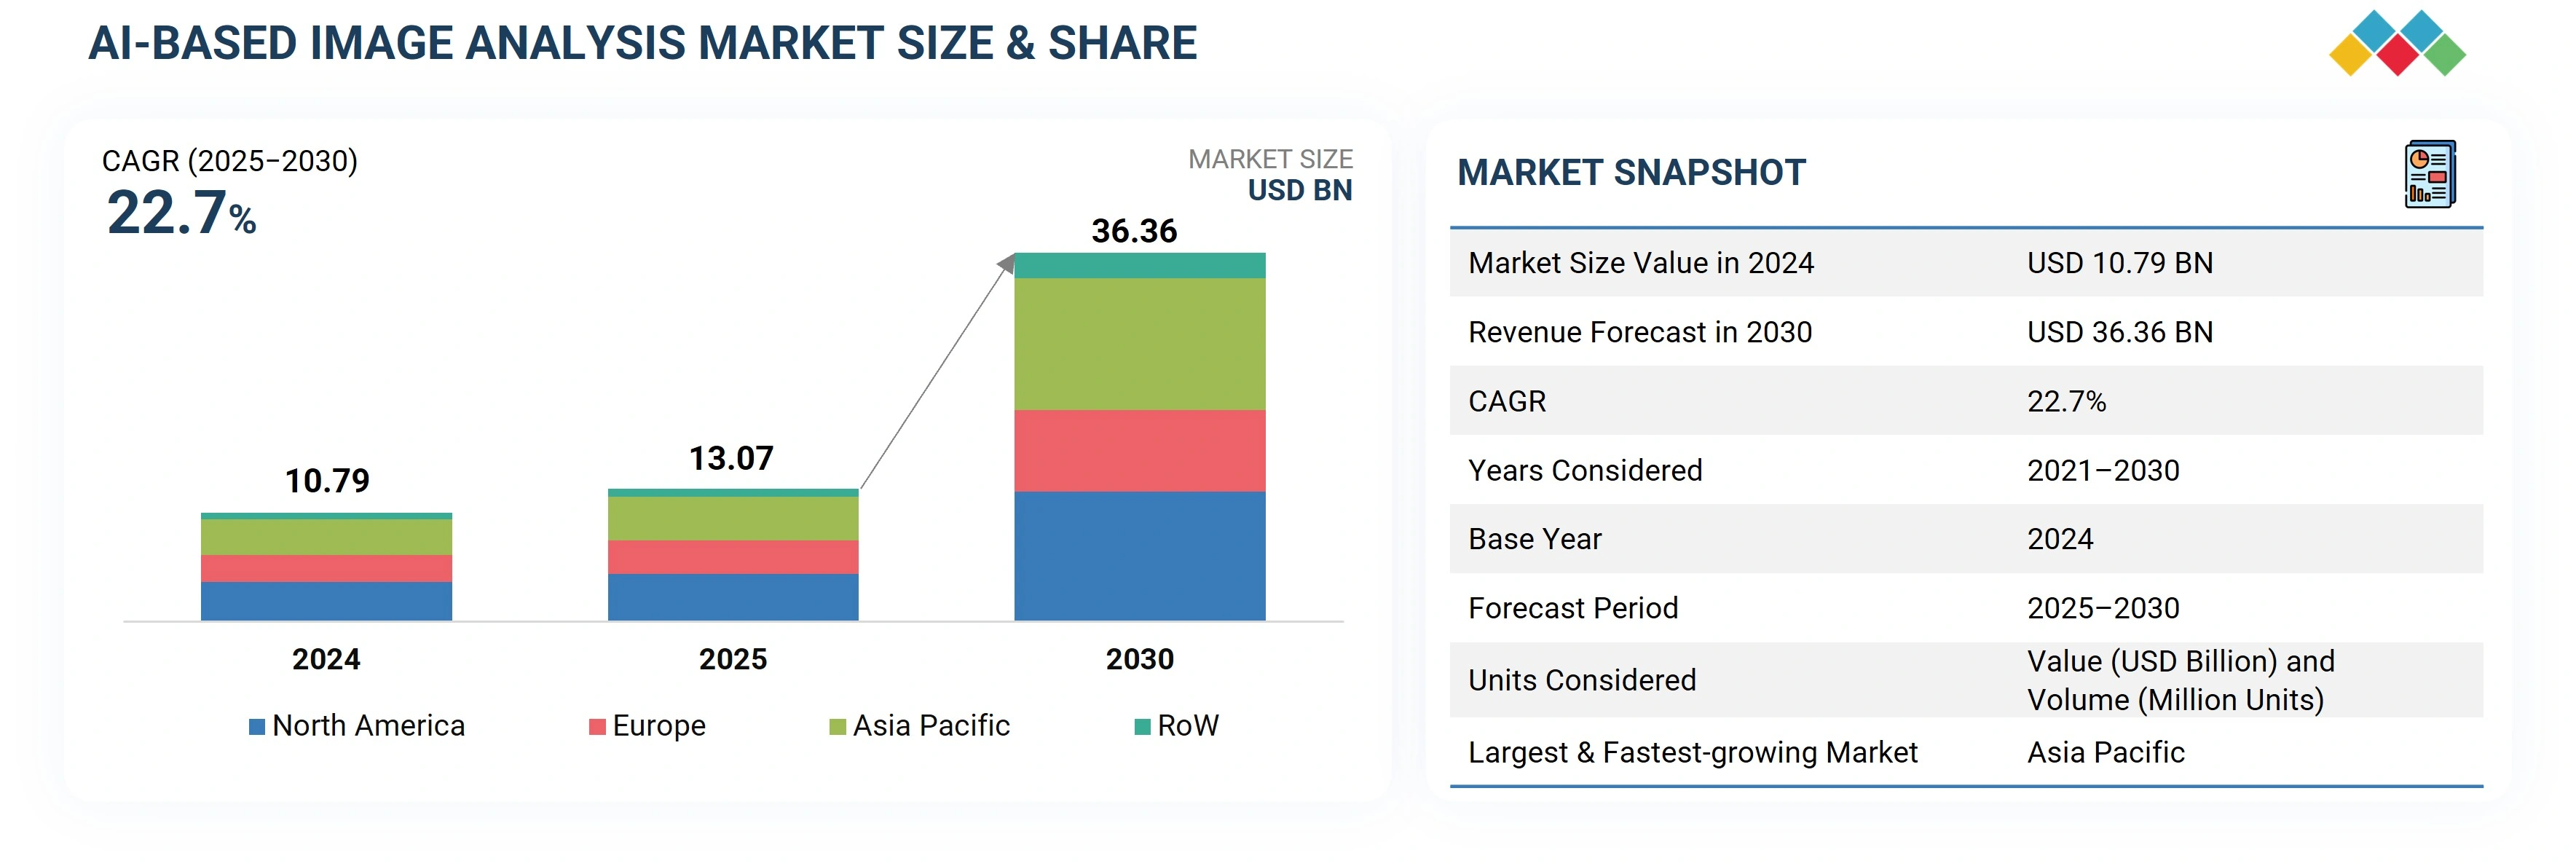
According to Marketsandmarkets, the AI-based image analysis market size is projected to grow from USD 13.07 billion in 2025 to USD 36.36 billion by 2030, at a CAGR of 22.7% from 2025 to 2030. The demand for AI-based image analysis is rapidly increasing in the automotive and manufacturing sectors. In the automotive industry, AI-based image analysis is leveraged for autonomous driving system, where real-time object detection, lane identification, and driver's monitoring require high-speed visual interpretation.
MARKET SCOPE
| REPORT METRIC | DETAILS |
|---|---|
| Market Size in 2025 (Value) | USD 13.07 Billion |
| Market Forecast in 2030 (Value) | USD 36.36 Billion |
| Growth Rate | CAGR of 22.7% from 2025–2030 |
| Years Considered | 2021-2030 |
| Base Year | 2024 |
| Forecast Period | 2025–2030 |
| Units Considered | Value (USD Billion/Billion) and Volume (Thousand/Million Units) |
| Top Companies |
|
| Growth Driver |
|
| Report Coverage | Revenue Forecast, Company Ranking, Competitive Landscape, Growth Factors, and Trends |
| Segments Covered | By Technology: Deep Learning, Traditional Machine Learning, Hybrid, and Other AI Technologies; By Deployment Mode: On-premises and Cloud-based; By End-use Industry: Healthcare, Retail & E-commerce, Automotive & Transportation, Manufacturing, and Other End |
| Regional Scope | North America, Europe, Asia Pacific, and RoW |
Market Size & Forecast
KEY TAKEAWAYS
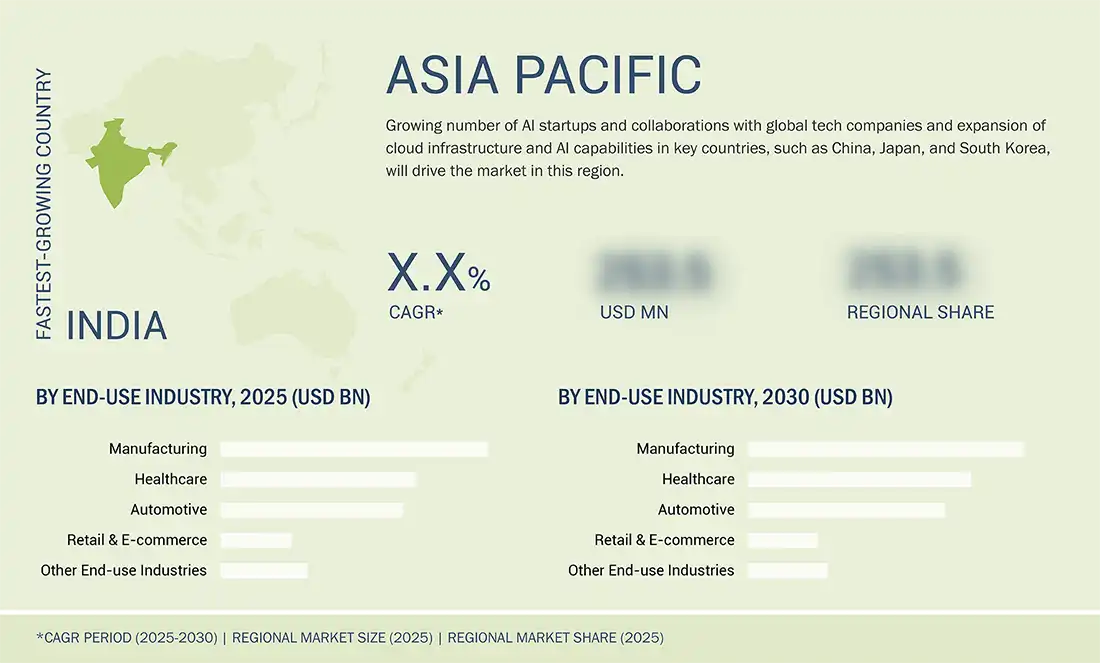
- The Asia Pacific AI-based image analysis market is expected to register the highest CAGR of 25.0%.
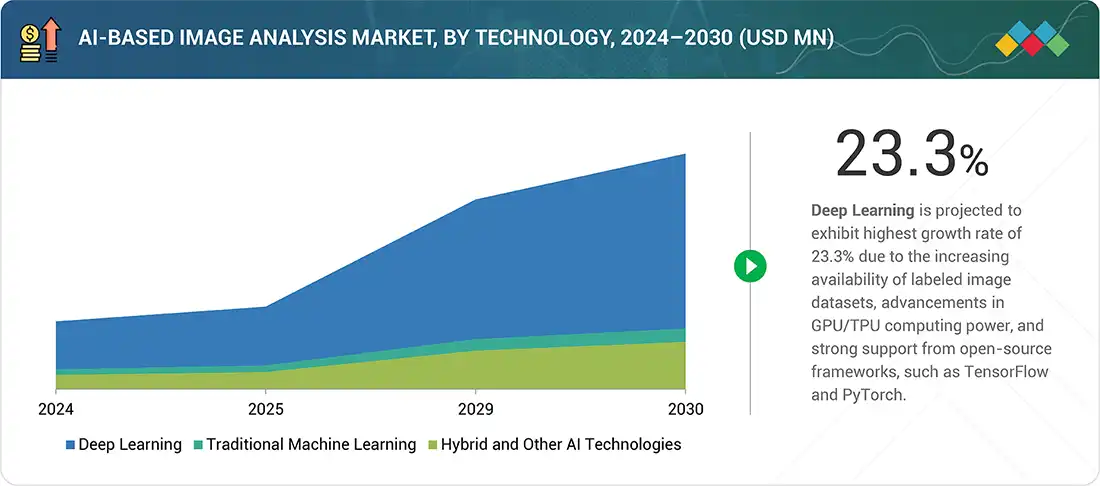
- By technology, deep learning is expected to register the highest CAGR of 23.3%.
- By deployment mode, cloud-based is projected to grow at the fastest rate from 2025 to 2030.
- By end-use industry, manufacturing accounted for a 30.8% revenue share in 2024.
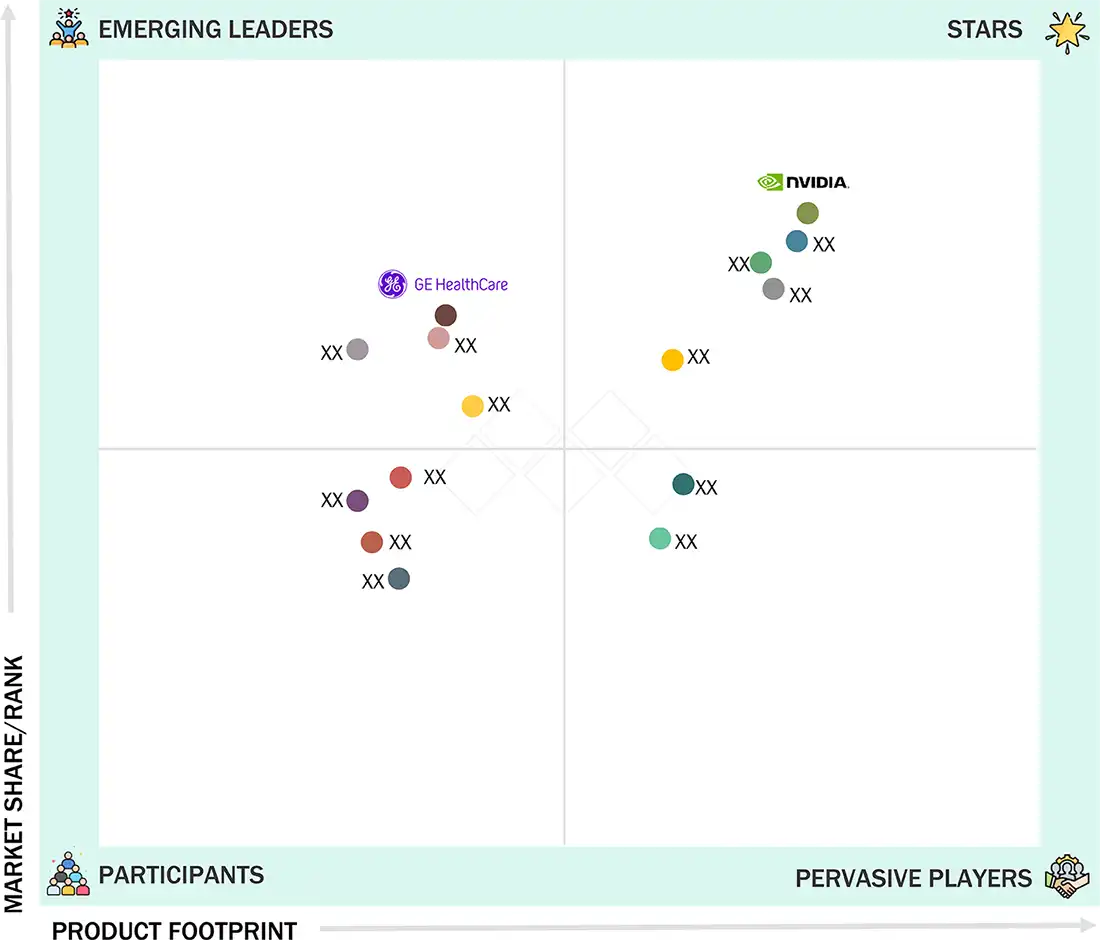
- Company NVIDIA Corporation, KUKA AG, and YASKAWA Electric Corporation were identified as some of the star players in the AI-based image analysis market (global), given their strong market share and product footprint.
- Companies Mvision AI, Enlitic, Inc., among others, have distinguished themselves among startups and SMEs by securing strong footholds in specialised niche areas, underscoring their potential as emerging market leaders
The AI-based image analysis market share is projected to grow rapidly over the next decade due to increasing demand for AI-based image analysis across the automotive and manufacturing sectors. This is driven by the need for greater efficiency, quality control, and real-time decision-making in production environments. In the automotive industry, AI-powered image analysis is leveraged for autonomous driving systems, where real-time object detection, lane recognition, and driver monitoring require high-speed visual interpretation. Additionally, vehicle inspection systems powered by AI enable accurate defect detection in bodywork, paint, and assembly components, significantly reducing manual errors and inspection time.
Source: Secondary Research, Interviews with Experts, MarketsandMarkets Analysis
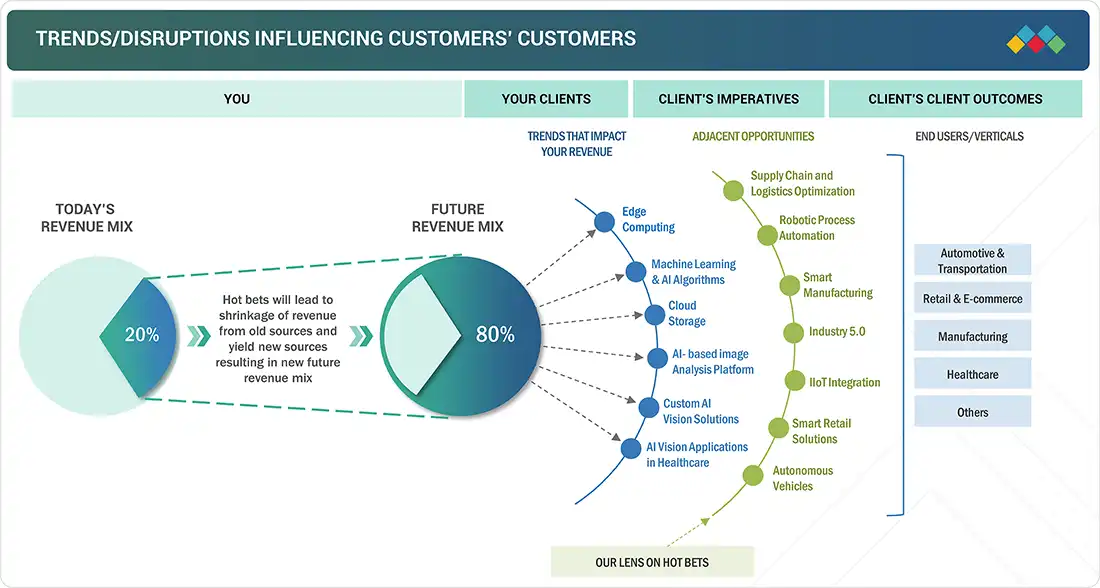
TRENDS & DISRUPTIONS IMPACTING CUSTOMERS' CUSTOMERS
The disruptions and emerging trends impacting customers' businesses in the AI-based image analysis market trends include increasing demand edge computing, machine learning, and AI vision various industries and sectors.
Source: Secondary Research, Interviews with Experts, MarketsandMarkets Analysis
MARKET DYNAMICS
Level
-
§Rising integration of ML and DL technologies and inclination toward cloud computing

-
§Increasing demand of edge computing solutions for real-time image analysis

Level
-
§Data privacy concerns

Level
-
§Rapid technological innovations in healthcare

-
§Growing demand for optical character recognition technology from AI image analysis providers

Level
-
§High data storage and management costs

Source: Secondary Research, Interviews with Experts, MarketsandMarkets Analysis
Driver: Increasing demand for edge computing solutions for real-time image analysis
Edge computing offers significant benefits in the market by enabling real-time data processing and increases the speed, scalability, and efficiency of vision systems. This technique reduces delays and increases the speed of AI-based image analysis applications, which is crucial for object detection, facial identification, and video analytics functions. Edge computing reduces the need to send all visual data to the cloud by performing processing locally.
Restraint: Dependence on high-quality data for accurate results
AI-based image analysis depends on high-quality data to train the algorithm for heavy image recognition, facial identification, and object classification applications. However, obtaining large versions of high quality data, especially in special or niche domains, can be challenging and expensive. In addition, if the data is incomplete, biased, lack diversity, or of low quality, the resulting algorithms can cause incorrect or discriminatory consequences. Thus, more suitable training data may be required to speed up the development and deployment of AI-based image analysis systems.
Opportunity: Rapid technological innovations in healthcare
AI-based image analysis is likely create an opportunity for the market by accelerating the development and use of advanced visual technologies from rapid innovations in healthcare. Progress in medical imaging and diagnostic tools is likely to create the need for AI-based image analysis systems that can analyze images, identify issues and support treatment decisions. As healthcare technology progresses, AI vision will be crucial for early disease detection and customized treatment schemes. AI-based image analysis software helps promote the use of AI-vision technologies in healthcare applications, creating better patient support systems and clinical equipment.
Challenge: High data storage and management costs
High data storage and management costs create challenges, especially for small companies with limited budget. AI vision technologies require adequate storage for the data that they process, and managing this data can add significant costs to businesses. AI vision technologies, especially deep learning require high quality images and video data for training. This increases the storage cost of raw data and processed data sets. However, these challenges can be reduced by the growing demand of AI vision in various industrires, such as healthcare and automotive.
AI-based Image Analysis Market: COMMERCIAL USE CASES ACROSS INDUSTRIES
| COMPANY | USE CASE DESCRIPTION | BENEFITS |
|---|---|---|
 |
AI vision solutions and software for various industries, such as manufacturing, automotive & transportation, and telecommunication, among others | Image comparison & analysis suitable for vision AI developers, software partners, startups, and OEMs creating IVA applications and services |
 |
AI vision services for BFSI, healthcare, and manufacturing, among others | Analyze visual content in various ways, such as image analysis, spatial analysis, optical character recognition, and facial recognition based on inputs and user preferences |
 |
AI vision software for aerospace, retail, and healthcare, among others | Simplifies data labeling, model training, optimization, and speeds up data upload, model training, and inference workflows |
 |
AI vision software & services for manufacturing, retail, and healthcare, among others | Support real-time video data and store insights in vision warehouse for querying and metadata access |
 |
Amazon Rekognition for retail, healthcare, BFSI, and telecommunications, among others | Reduces costs and automates image recognition and video analysis using machine learning |
Logos and trademarks shown above are the property of their respective owners. Their use here is for informational and illustrative purposes only.
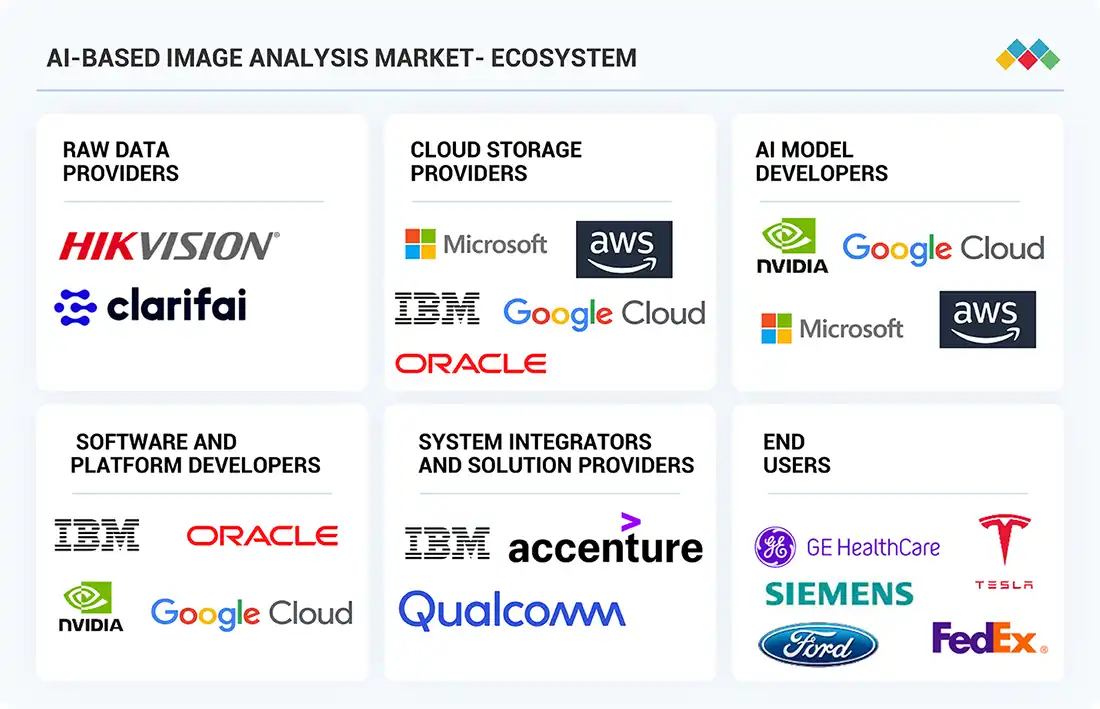
MARKET ECOSYSTEM
The AI-based image analysis ecosystem comprises raw data providers, cloud storage providers, AI model developers, software and platform developers, system integrators and solution providers, and end users. AI-based image analysis market serves various end-use industries, such as automotive & transportation, retail & e-commerce, healthcare, and manufacturing.
Logos and trademarks shown above are the property of their respective owners. Their use here is for informational and illustrative purposes only.
MARKET SEGMENTS
Source: Secondary Research, Interviews with Experts, MarketsandMarkets Analysis
AI-based Image Analysis Market, By Technology
The deep learning segment is projected to witness the highest CAGR in the AI-based image analysis market during the forecast period, due to the increasing availability of labeled image datasets, advancements in GPU/TPU computing power, and strong support from open-source frameworks, such as TensorFlow and PyTorch. Moreover, deep learning models benefit from scalability, continuous learning, and adaptability to complex and unstructured image data.
AI-based Image Analysis Market, By Deployment Mode
The on-premises segment is expected to hold the largest share of the AI-based image analysis market in 2024. An on-premises platform refers to an infrastructure that runs services and applications entirely within an organization's physical environment rather than relying on cloud-based hosting. This deployment mode model ensures that all data processing, storage, and management occur on local servers, giving the organization complete control over its operations.
AI-based Image Analysis Market, By End-use Industry
Between 2025 and 2030, the healthcare segment is expected to register the highest CAGR in the AI-based image analysis market. The increasing adoption of AI-powered imaging technologies for more accurate diagnoses and treatment planning revolutionizes patient care. Additionally, the growing need for efficient hospital management systems and the rising demand for remote patient monitoring solutions drive the adoption of AI-based image analysis systems.
REGION
Asia Pacific to hold the largest share of the global AI-based image analysis market during the forecast period
Asia Pacific is projected to grow at the highest CAGR in the AI-based image analysis industry during the forecast period. Expanding cloud infrastructure, digital transformation, rapid industrialization, and advancements in technologies such as IoT, AI, 5G, robotics, and cloud computing are the key factors boosting the growth of the AI-based image analysis market in the region.
AI-based Image Analysis Market: COMPANY EVALUATION MATRIX
In the AI-based image analysis companies matrix, NVIDIA Corporation (Star) leads with a strong market presence and an extensive product portfolio, enabling widespread adoption across CSPs, enterprises, and government organizations. GE Healthcare (Emerging Leader) is steadily gaining traction with innovative AI-based image analysi in healthcare, BFSI, automotive, and other industries. While NVIDIA Corporation dominates through scale and an established customer base, GE Healthcare demonstrates solid growth potential to advance toward the leaders' quadrant.
Source: Secondary Research, Interviews with Experts, MarketsandMarkets Analysis
KEY MARKET PLAYERS
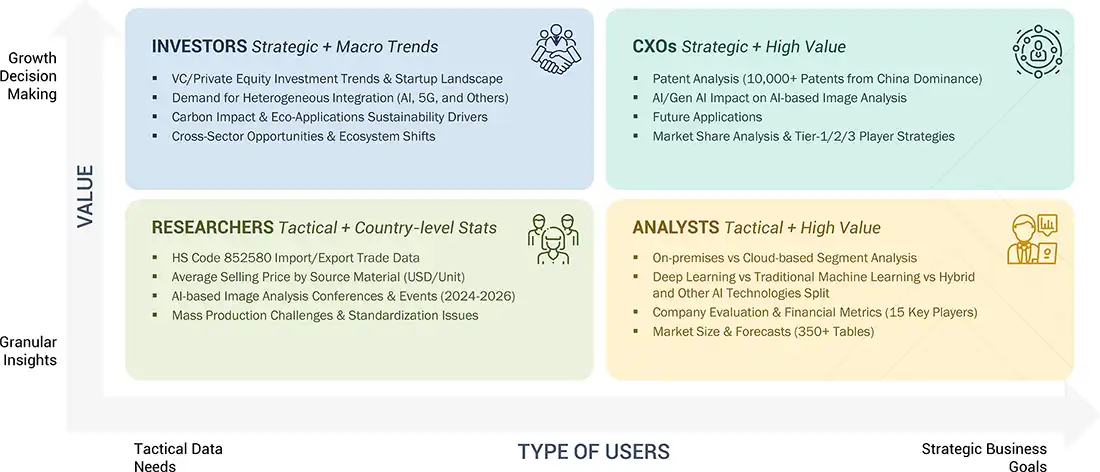
WHAT IS IN IT FOR YOU: AI-based Image Analysis Market REPORT CONTENT GUIDE
DELIVERED CUSTOMIZATIONS
We have successfully delivered the following deep-dive customizations:
| CLIENT REQUEST | CUSTOMIZATION DELIVERED | VALUE ADDS |
|---|---|---|
| AI-based Image Analysis Solution Provider | • Benchmarking adoption trends and use cases across healthcare, retail, surveillance, and automotive industries | • Identified cost competitiveness and differentiation vs key global peers |
| Enterprise Healthcare Provider | • Custom assessment of regulatory compliance (HIPAA/GDPR) and AI models | • Accelerated go-to-market with tailored compliance strategy |
RECENT DEVELOPMENTS
- January 2025 : NVIDIA Corporation (US) launched Nvidia Cosmos, a broad platform designed to increase the development of physical AI-scene, including autonomous vehicles (AVs) and robots. The platform integrates advanced devices to understand visual data, which are crucial to develop the physical AI system.
- October 2024 : Microsoft Corporation (US) and Rezolve.ai (US) established a strategic partnership aimed at transforming the global retail landscape through advanced AI-powered commerce solutions. This collaboration integrates Rezolve AI's Brain Suite, which includes tools such as Brain Commerce, Brain Checkout, and Brain Assistant, with Microsoft's Azure cloud platform, making these solutions available globally via the Azure Marketplace and co-sell channels. The integration of AI-powered solutions in retail includes the use of computer vision, which enables retailers to gather and analyze visual data collected through cameras and sensors.
- September 2024 : Cognex Corporation (US) recently launched the Dataman 380 fixed-mount barcode reader. It involves the AI-accelerated decoding technique, which increases the ability to quickly and accurately read a variety of barcodes in a complex environment with several symbols.
- April 2024 : IBM (US) launched the IBM Z Intelligent Vision Software Platform for Z/OS, which is the performance analysis software for IBM Z System. It provides flexible data analysis with custom, no-code visualization, enables analysts to identify risks and adapt the workload.
- February 2023 : Intel released an updated version of its AI vision software, GETI 1.5.0. It enhances purposeful, performance, signs flexibility and labeling functionality and speed up data uploads, model training, and invention workflows.
Table of Contents
 Exclusive indicates content/data unique to MarketsandMarkets and not available with any competitors.
Methodology
The study involved major activities in estimating the current size of the AI-based image analysis market. Exhaustive secondary research was done to collect information on the AI-based image analysis market. The next step was to validate these findings, assumptions, and sizing with industry experts across the value chain using primary research. Different approaches, such as top-down and bottom-up, were employed to estimate the total market size. After that, the market breakup and data triangulation procedures were used to estimate the market size of the segments and subsegments of the AI-based image analysis market.
Secondary Research
In the secondary research process, various secondary sources were referred to identify and collect information relevant to this study. Secondary sources included annual reports, press releases, and investor presentations of companies; white papers, certified publications, and articles from recognized authors; directories; and databases. Secondary research was mainly carried out to obtain critical information about the industry's supply chain, value chain, the total pool of key players, and market classification and segmentation according to industry trends, geographic markets, and key developments from both market- and technology-oriented perspectives. Secondary data has been gathered and analyzed to determine the overall market size, which has also been validated through primary research.
Primary Research
Extensive primary research was conducted after understanding and analyzing the current scenario of the AI-based image analysis market through secondary research. Several primary interviews were held with key opinion leaders from the demand and supply sides in four key regions: North America, Europe, Asia Pacific, and the rest of the world. Nearly 25% of the primary interviews were held with the demand side and 75% with the supply side. The primary data was gathered primarily through telephonic interviews, which were 80% of the total primary interviews. Surveys and e-mails were also utilized to gather data.

Note: The three tiers of companies are defined based on their total revenue as of 2024; tier 1: revenue more than or equal to USD 500 million, tier 2: revenue between USD 100 million and USD 500 million, and tier 3: revenue less than or equal to USD 100 million. Other designations include sales and marketing executives and researchers, as well as members of various AI-based image analysis organizations.
To know about the assumptions considered for the study, download the pdf brochure
Market Size Estimation
This report implemented both the top-down and bottom-up approaches to estimate and validate the size of the AI-based image analysis market and various other dependent submarkets. Secondary research identified key players in this market, and their market shares in the respective regions were determined through primary and secondary research.
This entire research methodology included the study of annual and financial reports of top companies, as well as interviews with experts (such as CEOs, VPs, directors, and marketing executives) for key insights (both quantitative and qualitative). All percentage shares, splits, and breakdowns were determined using secondary sources and verified through primary sources. All the possible parameters that affect the market covered in this research study were accounted for, viewed in detail, verified through primary research, and analyzed to obtain the final quantitative and qualitative data. This data was consolidated and supplemented with detailed inputs and analysis from MarketsandMarkets and presented in this report. The figures given below show the overall market size estimation process employed for this study.
Bottom-Up Approach
- The first step involved identifying companies that offer AI-based image analysis services and solutions, followed by mapping their products according to various parameters, such as technology, deployment mode, end-use industry, and region.
- The size of the AI-based image analysis market has been calculated based on the demand from various end-use industries and the revenue generated by companies within the AI-based image analysis ecosystem.
- To confirm the global market size, primary interviews have been conducted with a few major players in the AI-based image analysis market.
- The market size has also been cross-checked using secondary sources, which included the Institute of Electrical and Electronics Engineers (IEEE), Edge AI and Vision Alliance, International Society of Automation (ISA), Microsoft, General Data Protection Regulation (GDPR), and Partnership on AI. Other secondary sources comprised company websites, press releases, and research journals.
- To determine the compound annual growth rate (CAGR) of the AI vision market, both historical and projected market trends have been analyzed by examining the industry's penetration rate, as well as the supply and demand from various verticals.
- All estimates at each stage have been confirmed through discussions with key opinion leaders, including corporate executives (CXOs), directors, and sales heads, as well as industry experts from MarketsandMarkets.
- Several paid and unpaid information sources, such as annual reports, press releases, white papers, and databases, have also been reviewed during the research process.
Top-Down Approach
- To estimate the global size of the AI-based image analysis market, revenue information from leading manufacturers and providers of AI-based image analysis systems and solutions has been gathered and analyzed.
- The AI-based image analysis market is projected to exhibit a steady growth trend during the forecast period, reflecting its maturity and the presence of numerous well-established players across various sectors.
- The revenues, geographic footprint, key market sectors, and product offerings of all identified players in the AI-based image analysis market have been studied to estimate the percentage distribution of different market segments.
- Major players in each category in the AI-based image analysis market have been identified through secondary research, and information has been confirmed through brief discussions with industry experts.
- Several discussions with key opinion leaders from leading companies involved in developing AI-based image analysis systems have been conducted to validate the market segmentation based on technologies, deployment mode, end-use industry, and region.
- Geographic splits have been estimated using secondary sources, considering various factors, such as the number of companies offering AI-based image analysis solutions in a specific country or region and the types of AI-based image analysis services provided by these players.
AI-based Image Analysis Market : Top-Down and Bottom-Up Approach

Data Triangulation
After arriving at the overall size of the AI-based image analysis market from the estimation process explained above, the market was split into several segments and subsegments. The data triangulation and market breakdown procedures were employed (wherever applicable) to complete the overall market engineering process and arrive at the exact statistics for all segments and subsegments. The data was triangulated by studying various factors and trends from both the demand and supply sides. The size of the AI-based image analysis market was validated using both top-down and bottom-up approaches.
Market Definition
The AI-based image analysis refers to the use of machine learning (ML) and deep learning (DL), which automatically process and interpret data from visuals. It involves extracting information automatically to identify objects, recognize patterns, and make decisions based on visual data. It has a wide range of applications, including medical diagnosis, facial identification, and quality inspection, in the healthcare, manufacturing, automotive, retail, and agriculture sectors. This technique enables machines to recognize patterns, classify items, detect discrepancies, and make data-driven decisions based on visual input.
The AI-based Image Analysis Market is segmented based on sensor technology, implementation type, detection range, process stage, application, and region. The market comprises electrochemical, catalytic, metal-oxide-semiconductor (MOS), thermal conductivity, and micro-electromechanical systems (MEMS) by sensor technology. Each sensor type offers unique advantages, such as fast response time, high sensitivity, and cost-efficiency, making them suitable for various industrial requirements. In terms of implementation type, hydrogen detectors are available as fixed and portable systems, with fixed systems deployed in industrial plants and portable units used for field inspections or emergency response. The market is also categorized by detection range, including 0–1,000 ppm, 0–5,000 ppm, 0–20,000 ppm, and beyond 20,000 ppm, based on the safety threshold and detection needs of different environments. The hydrogen lifecycle is addressed across four process stages: generation, storage, transportation, and usage, each requiring real-time leak monitoring and safety assurance. Key application areas include oil & gas, automotive & transportation, chemicals, metals & mining, power & energy, and other sectors such as semiconductors, food & beverage, and medical industries. Each segment demands tailored detection technologies to meet compliance, safety, and operational efficiency standards.
Key Stakeholders
- Government and financial institutions and investment communities
- Raw data providers
- Cloud storage service providers
- AI-based image analysis system providers
- AI-based image analysis software providers
- Integrators and solution providers
- Professional service/solution providers
- Research institutions and organizations
Report Objectives
- To define, describe, segment, and forecast the AI-based image analysis market size, by technology, deployment mode, and end-use Industry, in terms of value
- To forecast the market size of four key regions, namely, North America, Europe, Asia Pacific, and the RoW, in terms of value
- To present detailed information regarding the major factors influencing the growth of the market (drivers, restraints, opportunities, and challenges)
- To provide an ecosystem analysis, investment and funding analysis, case study analysis, patent analysis, technology analysis, key conferences and events, ASP analysis, Porter's Five Forces analysis, key stakeholders and buying criteria, and regulations pertaining to the market
- To offer a comprehensive overview of the value chain of the AI-based image analysis market ecosystem
- To critically analyze micromarkets1 with respect to individual growth trends, prospects, and contributions to the total market
- To strategically profile the key players and comprehensively analyze their market shares and core competencies
- To assess the opportunities in the market for stakeholders and describe the competitive landscape of the market
- To analyze competitive developments in the market, such as collaborations, partnerships, product developments, and research and development (R&D)
Available customizations:
With the market data given, MarketsandMarkets offers customizations according to the company's specific needs. The following customization options are available for the report:
Company Information
- Detailed analysis and profiling of additional market players (up to 7)
Key Questions Addressed by the Report
What is the current size of the AI-based Image Analysis Market?
The global AI-based Image Analysis Market was valued at USD 10.79 billion in 2024 and is projected to reach USD 13.07 billion in 2025.
What is the projected market size of the AI-based Image Analysis Market by 2030?
The market is expected to reach USD 36.36 billion by 2030, driven by increasing adoption of AI-powered vision systems across healthcare, manufacturing, automotive, and retail industries.
What is the CAGR of the AI-based Image Analysis Market during the forecast period?
The AI-based Image Analysis Market is projected to grow at a CAGR of 22.7% from 2025 to 2030, reflecting strong demand for automated visual intelligence solutions.
What are the major growth drivers of the AI-based Image Analysis Market?
Key growth drivers include increasing integration of machine learning and deep learning technologies, rising demand for edge computing, cloud adoption, and growing use of AI vision systems in automotive and manufacturing applications.
Which technology segment is expected to grow the fastest?
The deep learning segment is expected to register the highest CAGR of 23.3% during the forecast period due to its superior accuracy in image recognition, object detection, and pattern analysis.
Which deployment mode is expected to drive market growth?
The cloud-based segment is projected to grow at the fastest rate between 2025 and 2030 due to scalability, lower infrastructure costs, and easier integration with AI-powered analytics platforms.
Which end-use industry holds the largest share of the AI-based Image Analysis Market?
Manufacturing accounted for 30.8% of the market revenue in 2024, driven by increasing adoption of AI-based quality inspection, defect detection, and industrial automation solutions.
Which region dominates the AI-based Image Analysis Market?
Asia Pacific holds the largest market share and is also expected to register the highest regional CAGR of 25.0%, supported by rapid industrialization, digital transformation, AI adoption, and expanding cloud infrastructure.
Who are the leading companies operating in the AI-based Image Analysis Market?
Major market participants include NVIDIA Corporation, Microsoft Corporation, Intel Corporation, Alphabet Inc., and Amazon.com, Inc.
What opportunities are highlighted in the AI-based Image Analysis Market report?
Major opportunities include growing adoption of AI-powered medical imaging, increasing demand for optical character recognition (OCR), advancements in healthcare diagnostics, expansion of smart manufacturing, and rising investments in computer vision tech
Need a Tailored Report?
Customize this report to your needs
Get 10% FREE Customization
Customize This ReportPersonalize This Research
- Triangulate with your Own Data
- Get Data as per your Format and Definition
- Gain a Deeper Dive on a Specific Application, Geography, Customer or Competitor
- Any level of Personalization
Let Us Help You
- What are the Known and Unknown Adjacencies Impacting the AI-based Image Analysis Market
- What will your New Revenue Sources be?
- Who will be your Top Customer; what will make them switch?
- Defend your Market Share or Win Competitors
- Get a Scorecard for Target Partners

Custom Market Research Services
We Will Customise The Research For You, In Case The Report Listed Above Does Not Meet With Your Requirements
Get 10% Free CustomisationTESTIMONIALS

Tetsuya Ohhira
Business Development Manager-Technology Business
Nikon Corporation,
Leading Japanese MNC specializing in optics and imaging productswww.nikon.com
MarketsandMarkets™ response
is quick. Their attitude is flexible and positive. Analyst Insights are globally considered and
significant. Client Services quickly respond to our inquiry and demand. Their wide range of global
surveys help us make our strategic plan.
We hope Knowledge Store will be easier to search
for a report.
VP - Marketing & Business Development
Leading Provider of Process Control Solutions
We engaged with MarketsandMarkets on a study to perform an analysis and recommend a Go-To-Market strategy for metrology and process control in the semiconductor market. The study was tailored to our targets and needs with well-defined milestones. Our overall experience with the MarketsandMarkets team was very good throughout the project in all aspects including the analysis methodologies used, the quality and depth of primary and secondary data sets, the professionalism and flexibility of the team and the ability to meet the target schedule and milestones. We want to thank MarketsandMarkets team for a job well done.
Growth opportunities and latent adjacency in AI-based Image Analysis Market


Ian
Apr, 2026
Does the study include primary interviews with industry experts?.
Billy
Apr, 2026
Will it help me benchmark against competitors or find potential partners/acquisition targets?.