
Aluminum Brazing Market

Aluminum Brazing Market by Product Type, Product Form (Sheets, Paste, Wires, Rods, Other Product Forms), End-use Industry (Automotive, Aerospace & Defense, Industrial, Electrical & Electronics, Other End-use Industries), and Region - Global Forecast to 2032
Updated on : November 27, 2025


ALUMINUM BRAZING MARKET OVERVIEW
Source: Secondary Research, Interviews with Experts, MarketsandMarkets Analysis
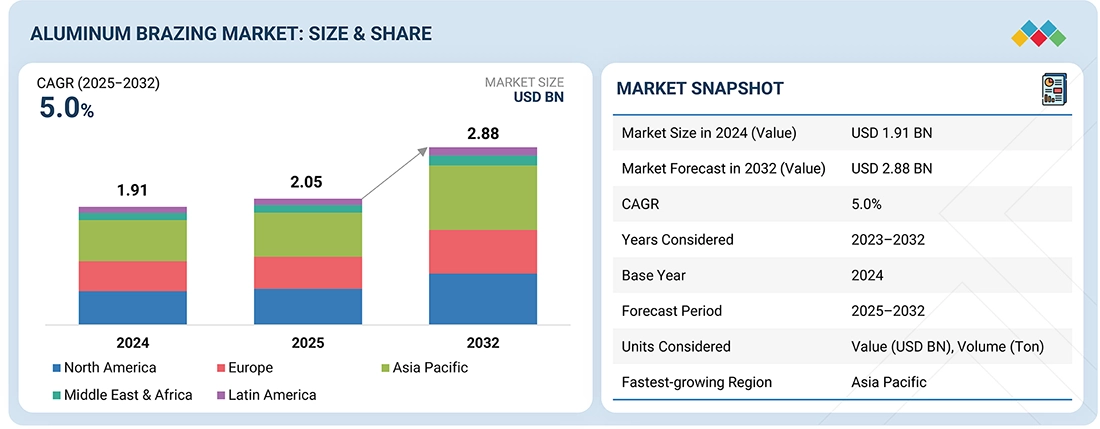
The aluminum brazing market is projected to reach USD 2.88 billion by 2032 from USD 2.05 billion in 2025, at a CAGR of 5.0% from 2025 to 2032. The aluminum brazing market is primarily driven by the growing demand for lightweight and energy-efficient components in the automotive, aerospace & defense, industrial, and electrical & electronics sectors. The shift towards electric vehicles and eco-friendly HVAC systems necessitates aluminum brazing alloys for superior thermal management and corrosion resistance. Expanding aerospace and electronics sectors focused on high-strength, lightweight materials also significantly contribute to the market growth.
KEY TAKEAWAYS
-
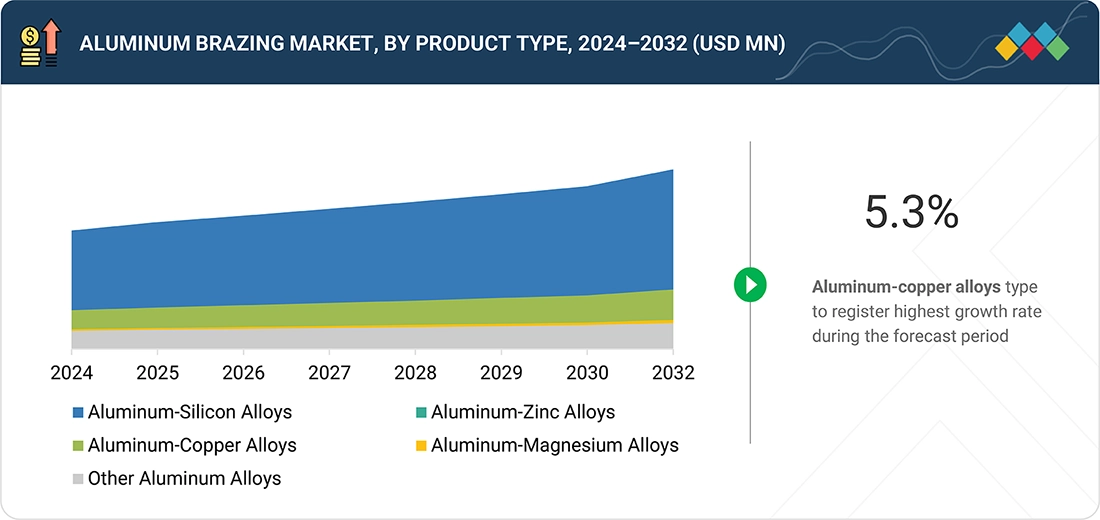
BY PRODUCT TYPEThe aluminum brazing market comprises various product types, including aluminum-silicon alloys, aluminum-zinc alloys, aluminum-copper alloys, aluminum-magnesium alloys, and others. Aluminum-copper alloys are expected to register the highest CAGR, in terms of value, during the forecast period due to increasing usage in various applications.
-
BY PRODUCT FORMThe aluminum brazing market is segmented based on product form into sheets, paste, wires, rods, and other product forms. The sheets segment accounted for the largest market share in 2024, while the paste segment is projected to register the highest CAGR during the forecast period.
-
BY END-USE INDUSTRYKey end-use industries of aluminum brazing include aerospace & defense, automotive, industrial, electrical & electronics, and other end-use industries. The aerospace & defense segment is projected to register the highest CAGR during the forecast period, as aluminum brazing process is widely used in this industry for lightweight aluminum alloy brazed joints in structural and thermal management components.
-
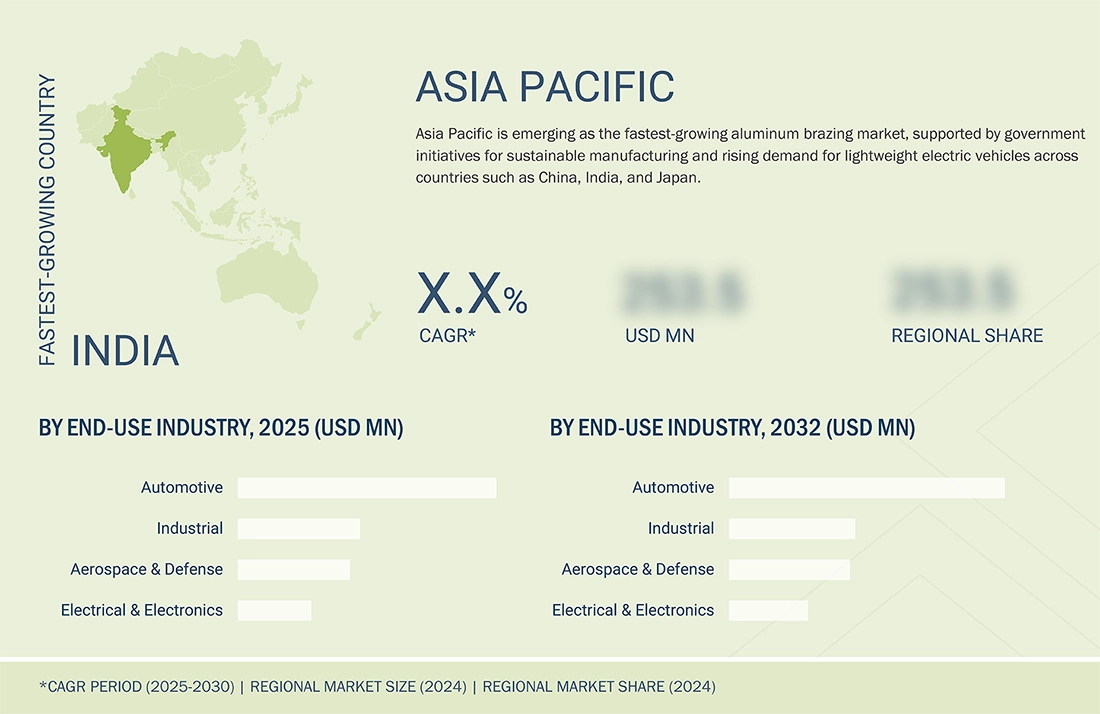
BY REGIONThe aluminum brazing market covers Europe, North America, Asia Pacific, Latin America, and the Middle East & Africa. Asia Pacific is the largest market for aluminum brazing. The region is also projected to register the highest CAGR during the forecast period.
-
COMPETITIVE LANDSCAPEMajor market players have adopted both organic and inorganic strategies, including partnerships and investments. For instance, Lucas-Milhaupt LLC (US), Solvay (Belgium), Prince & Izant Company (US) have entered into a number of agreements and partnerships to cater to the growing demand for aluminum brazing materials across innovative applications.
The aluminum brazing market is experiencing robust growth driven by the increasing demand for lightweight, high-strength aluminum components, particularly in the automotive, aerospace & defense, industrial, and electrical & electronics industries. Ongoing advancements for the development of improved brazing alloys with enhanced flow, strength, corrosion resistance, and environmentally friendly compositions, alongside progress in fluxless brazing technology that reduces contaminants and improves joint durability, has increased their usage in various applications. The demand is also fueled by the automotive industry's push for fuel efficiency and electric vehicles, requiring efficient joining for battery packs and heat exchangers, as well as aerospace and electronics sectors seeking weight reduction and high performance.
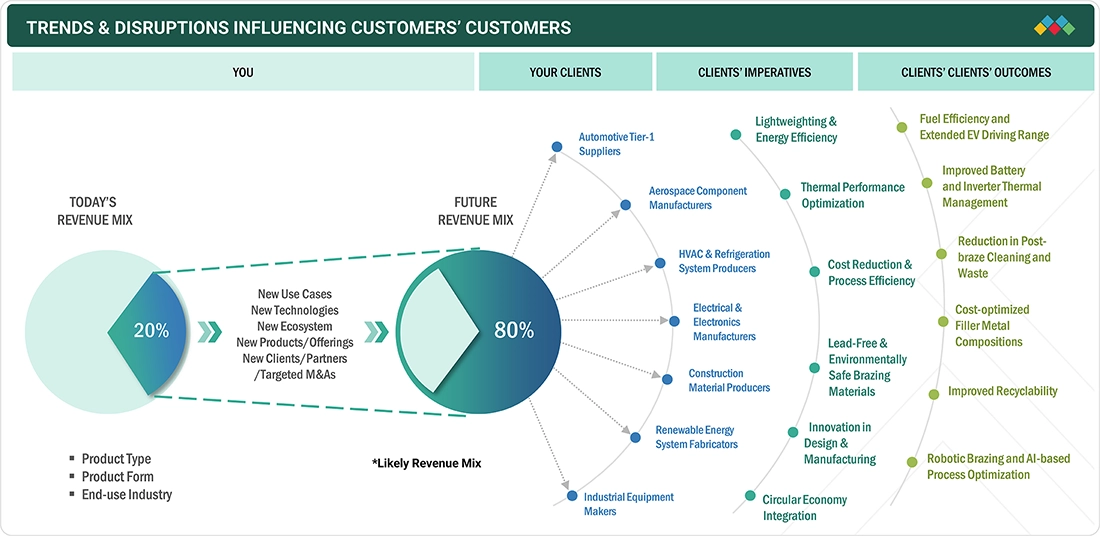
TRENDS & DISRUPTIONS IMPACTING CUSTOMERS' CUSTOMERS
Changes in customer trends or disruptions impact consumers’ businesses. These shifts impact the revenues of end users. Consequently, the revenue impact on end users is expected to affect the revenues of aluminum brazing alloy & flux suppliers, which, in turn, impacts the revenues of aluminum brazing alloy & flux manufacturers.
Source: Secondary Research, Interviews with Experts, MarketsandMarkets Analysis
MARKET DYNAMICS
Level
-
Increasing demand for aluminum brazing in electric vehicles

-
Growing use in HVACR applications

Level
-
Oxide layer barrier in aluminum brazing

-
Dissolution and erosion of base metals during brazing

Level
-
Growing adoption in renewable energy projects

-
Next-gen aluminum brazing technology for space exploration

Level
-
Volatility in raw material prices

-
Environmental and regulatory compliance

Source: Secondary Research, Interviews with Experts, MarketsandMarkets Analysis
Driver: Increasing demand for aluminum brazing in electric vehicles
Aluminum brazing is experiencing surging demand in the electric vehicle (EV) sector, with automakers relying heavily on this joining technology to produce lightweight, leak-tight battery cooling plates, heat exchangers, and enclosures essential for EV thermal management and safety. This expansion is driven by the need for strong, reliable joints in delicate, thin-walled aluminum components that improve battery efficiency and vehicle range, while advanced process controls including controlled atmosphere brazing ensure high-volume, uniform production with minimal corrosion risk. The growth for aluminum brazing materials and systems is propelled by rising EV adoption, strict efficiency regulations, and continuous innovation in alloy and flux technologies, making aluminum brazing a cornerstone of modern EV assembly and performance.
Restraint: Oxide layer barrier in aluminum brazing
In aluminum brazing, a tough and instantly forming oxide layer acts as a major barrier to successful joint formation because it prevents the filler metal from properly wetting and bonding with the base aluminum. This oxide layer has a melting point far higher than aluminum itself and reforms rapidly even after removal. To overcome this challenge, brazing fluxes especially potassium fluoroaluminate solutions are used to chemically dissolve or displace the oxide barrier, exposing clean metal for the filler to flow and seal, while clean surface preparation and controlled heating are critical to achieving strong, reliable joints in sensitive automotive, HVAC, and electronics applications.
Opportunity: Growing adoption in renewable energy projects
Aluminum brazing materials are increasingly adopted in renewable energy projects due to its lightweight, corrosion resistance, and thermal efficiency, making it ideal for solar panels, wind turbines, battery cooling systems, and power electronics. This technology enables stronger, more durable, and environmentally friendly connections essential for heat exchangers and structural components in clean energy infrastructure. Innovations like fluxless vacuum brazing improve environmental sustainability by eliminating harmful residues and reducing production costs. Countries like India and Europe are leveraging aluminum brazing to boost their renewable energy industries, with aluminum playing a central role in solar photovoltaic frames, mounting structures, and wind turbine assemblies, accelerating the shift toward decarbonization and longer-lasting renewable energy systems.
Challenge: Volatility in raw material prices
Volatility in raw material prices is a significant challenge in the aluminum brazing market, impacting production costs and manufacturer profitability. Key raw materials such as aluminum, silver, nickel, and copper essential for brazing alloys experience price fluctuations due to global demand shifts, geopolitical tensions, supply chain disruptions, and mining output variability. For example, aluminum prices can fluctuate more than 30% annually, directly affecting manufacturing economics and pricing strategies. This volatility creates difficulties in maintaining cost efficiency while ensuring product quality, especially impacting small and medium manufacturers who struggle to secure stable supplies or pass costs to customers.
Aluminum Brazing Market: COMMERCIAL USE CASES ACROSS INDUSTRIES
| COMPANY | USE CASE DESCRIPTION | BENEFITS |
|---|---|---|
 |
Uses controlled atmosphere brazing (CAB) with aluminum filler metals and flux to produce high-efficiency automotive heat exchangers, including radiators and intercoolers for internal combustion engine (ICE) and electric vehicles (EV) | Enhances thermal performance, enables lightweight designs, reduces corrosion risk, and improves manufacturing throughput for high-volume automotive production |
 |
Applies aluminum vacuum brazing for aircraft environmental control systems (ECS) and fuel system heat exchangers, using high-strength filler alloys for reliability under extreme temperature and pressure conditions | Maintains structural integrity under aerospace-grade thermal cycles, achieves leak-free joints, and reduces overall aircraft weight compared to copper systems |
 |
Uses aluminum brazing to assemble battery cooling plates and condensers in EV thermal management systems, with precision filler metal application for complex geometries | Improves EV battery life by maintaining optimal temperatures, reduces manufacturing steps through part consolidation, and supports scalable production |
 |
Utilizes aluminum brazing to connect heat sinks and cooling plates for high-power semiconductor devices and LED displays | Enables efficient heat dissipation, lighter weight, and improved long-term reliability for densely packed electronic modules |
Logos and trademarks shown above are the property of their respective owners. Their use here is for informational and illustrative purposes only.
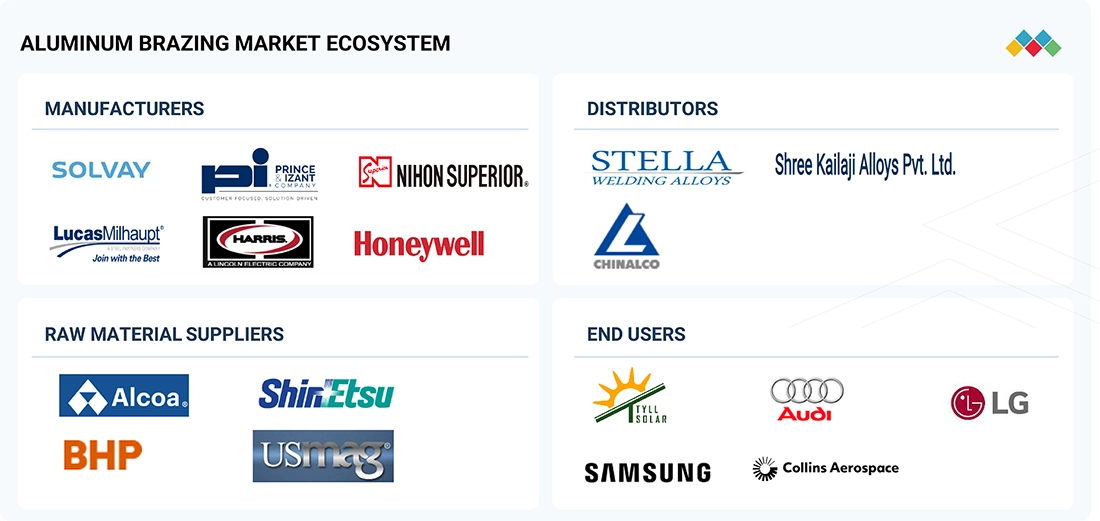
MARKET ECOSYSTEM
The aluminum brazing market ecosystem is a highly integrated and specialized network that covers the entire value chain from raw materials to final applications in the automotive, HVAC, aerospace, and industrial sectors. The ecosystem begins with suppliers of aluminum alloys, filler metals (Al-Si, Zn-Al, Cu-Al), and fluxes, along with equipment manufacturers supplying controlled atmosphere and vacuum brazing systems. Component manufacturers then use these inputs to fabricate products such as heat exchangers, radiators, and battery cooling plates.
Logos and trademarks shown above are the property of their respective owners. Their use here is for informational and illustrative purposes only.
MARKET SEGMENTS
Source: Secondary Research, Interviews with Experts, MarketsandMarkets Analysis
Aluminum Brazing Market, By Product Type
Aluminum-silicon alloys led the aluminum brazing market as they offer outstanding overall performance, including excellent wettability, high joint strength, good color, and superior corrosion resistance. The presence of silicon lowers the melting range of the alloy, enabling reliable brazing at lower temperatures without damaging base metals. These alloys are especially suited for applications like automotive heat exchangers and HVACR systems due to their ability to form leak-tight joints while maintaining lightweight characteristics. Variants with added elements like copper and magnesium tailor the alloys for diverse industrial needs, supporting high production efficiency in automatic brazing processes.
Aluminum Brazing Market, By Product Form
The sheets segment dominated the aluminum brazing market primarily due to their critical role in lightweighting, especially in the automotive industry, where they are essential for fuel efficiency and electric vehicle battery thermal management. These sheets consist of aluminum alloy cores clad with low-melting aluminum-silicon brazing alloys, providing superior thermal conductivity, corrosion resistance, and strong joints. Their widespread use in automotive heat exchangers, HVAC systems, and aerospace & defense applications is driven by high strength-to-weight ratios and thermal performance advantages. The growth is further fueled by technological advancements in brazing alloys, and stringent environmental regulations promoting aluminum recycling and energy efficiency.
Aluminum Brazing Market, By End-use Industry
The automotive industry holds the largest share in the aluminum brazing market primarily due to the strong push for lightweight vehicles to improve fuel efficiency and reduce emissions. Aluminum components, joined by brazing, are widely used in automotive heat exchangers, radiators, and condensers, which are critical for thermal management, especially in electric vehicles. Advancements in brazing technologies provide high-strength, leak-tight joints necessary for the complex assemblies in modern vehicles. Additionally, rapid growth in automotive manufacturing in regions like Asia, driven by rising vehicle production and stringent environmental regulations, sustains high demand for aluminum brazing alloys in this sector.
REGION
Asia Pacific to be fastest-growing market for aluminum brazing during forecast period
Asia Pacific is projected to be the fastest-growing market for aluminum brazing during the forecast period due to rapid industrialization and urbanization in key economies like China, India, Japan, and South Korea. These countries are expanding their manufacturing sectors, particularly in automotive, electrical & electronics, industrial, and construction industries, driving demand for high-performance brazing alloys. The push towards electric vehicles and sustainable manufacturing, along with government policies promoting energy-efficient and eco-friendly materials, further fuels growth. Technological advancements in alloy compositions and increasing investments in infrastructure development enhance product performance and market adoption.
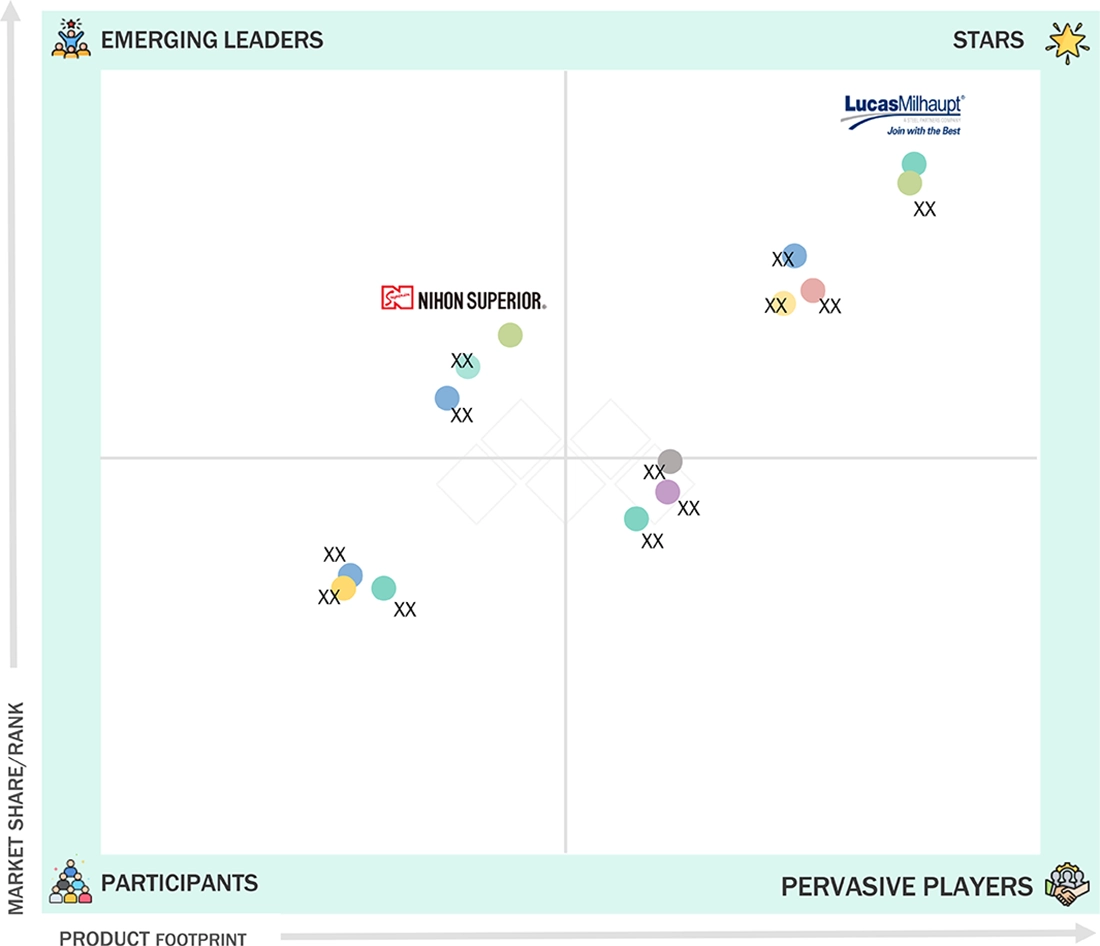
Aluminum Brazing Market: COMPANY EVALUATION MATRIX
In the aluminum brazing market, Lucas-Milhaupt LLC (Star) leads with a strong market share and extensive product footprint, driven by its collaborations and partnerships with end users. Nihon Superior Co., Ltd. (Emerging Leader) is gaining visibility because of its strong portfolio of advanced soldering and aluminum brazing technologies. While Lucas-Milhaupt LLC dominates through scale and a diverse portfolio, Nihon Superior Co., Ltd. shows significant potential to move toward the leaders’ quadrant as the demand for aluminum brazing materials continues to rise.
Source: Secondary Research, Interviews with Experts, MarketsandMarkets Analysis
KEY MARKET PLAYERS
MARKET SCOPE
| REPORT METRIC | DETAILS |
|---|---|
| Market Size in 2024 (Value) | USD 1.91 Billion |
| Market Forecast in 2032 (Value) | USD 2.88 Billion |
| Growth Rate | CAGR of 5.0% from 2025 to 2032 |
| Years Considered | 2023–2032 |
| Base Year | 2024 |
| Forecast Period | 2025–2032 |
| Units Considered | Value (USD Billion), Volume (Ton) |
| Report Coverage | Revenue Forecast, Company Ranking, Competitive Landscape, Growth Factors, and Trends |
| Segments Covered |
|
| Regions Covered | North America, Asia Pacific, Europe, Latin America, and the Middle East & Africa |
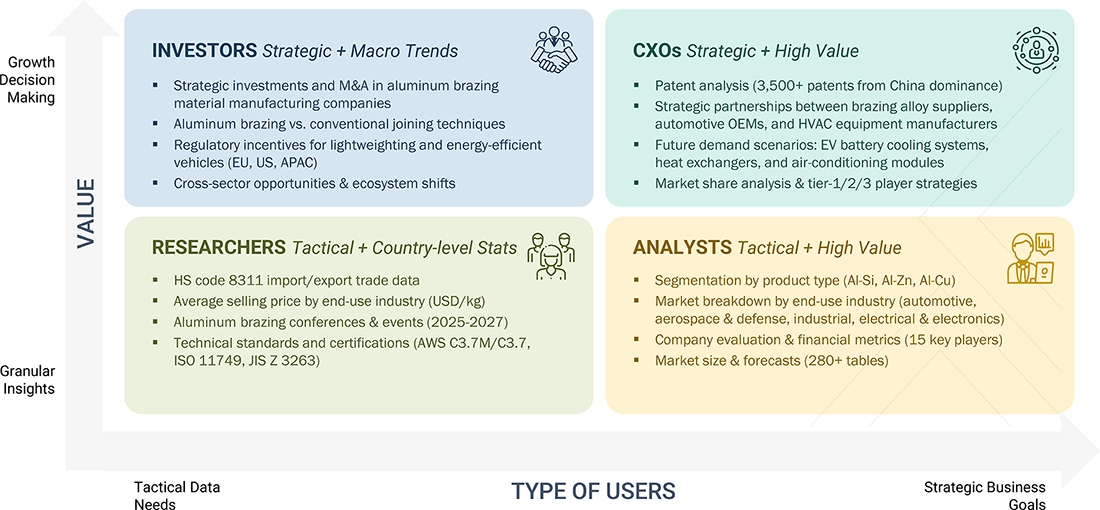
WHAT IS IN IT FOR YOU: Aluminum Brazing Market REPORT CONTENT GUIDE
DELIVERED CUSTOMIZATIONS
We have successfully delivered the following deep-dive customizations:
| CLIENT REQUEST | CUSTOMIZATION DELIVERED | VALUE ADDS |
|---|---|---|
| Raw Material Supplier (Aluminum Alloys, Fluxes, Filler Metals) |
|
|
| Brazing Alloy and Flux Manufacturers |
|
|
| OEMs and Component Manufacturers (Heat Exchangers, EV Battery Cooling Plates, Aerospace Systems) |
|
|
| End-use Industries (Automotive, Aerospace, HVACR, Electronics, Energy) |
|
|
RECENT DEVELOPMENTS
- April 2024 : Sunkwang AMPA established a partnership with Samsung Electronics to provide aluminum brazing materials for refrigeration and air conditioning systems, reinforcing its presence in the global market.
- October 2022 : Prince & Izant Company expanded its offerings by acquiring Peltier Mfg., Inc., known for producing specialized brazing preforms and complex metal microstampings for high-precision industrial applications. This move bolstered Prince & Izant’s manufacturing presence and customer relationships.
- November 2021 : Harris Products Group expanded its HVACR capabilities by acquiring two manufacturers: Fabricated Tube Products (FTP) and Shoals Tubular, Inc. These companies specialize in producing copper and aluminum headers, distributor assemblies, and other complex brazed components in the US and Mexico.
Table of Contents
 Exclusive indicates content/data unique to MarketsandMarkets and not available with any competitors.
Methodology
The study involves two major activities in estimating the current market size for the aluminum brazing market. Exhaustive secondary research was done to collect information on the market, peer market, and parent market. The next step was to validate these findings, assumptions, and sizing with industry experts across the value chain through primary research. Both top-down and bottom-up approaches were employed to estimate the complete market size. After that, market breakdown and data triangulation were used to estimate the market size of segments and subsegments.
Secondary Research
Secondary sources referred to for this research study include financial statements of companies offering aluminum brazing materials and information from various trade, business, and professional associations. Secondary research has been used to obtain critical information about the industry’s value chain, the total pool of key players, market classification, and segmentation according to industry trends, to the bottom-most level, and regional markets. Secondary data was collected and analyzed to arrive at the overall size of the aluminum brazing market, which was validated by primary respondents.
Primary Research
Extensive primary research was conducted after obtaining information regarding the aluminum brazing market scenario through secondary research. Several primary interviews were conducted with market experts from both the demand and supply sides across major countries of North America, Europe, Asia Pacific, the Middle East & Africa, and Latin America. Primary data was collected through questionnaires, emails, and telephonic interviews. The primary sources from the supply side included various industry experts, such as chief experience officers (CXOs), vice presidents (VPs), business development/marketing directors, product development/innovation teams, related key executives from the aluminum brazing industry, system integrators, component providers, distributors, and key opinion leaders. Primary interviews were conducted to gather insights such as market statistics, data on revenue collected from the products and services, market breakdowns, market size estimations, market forecasting, and data triangulation. Primary research also helped in understanding the various trends related to product type, product form, end-use industry, and region. Stakeholders from the demand side, including CIOs, CTOs, CSOs, and installation teams of customers/end users for aluminum brazing services, were interviewed to understand the buyer’s perspective on the suppliers, products, component providers, and their current usage of aluminum brazing materials and future outlook of their business, which will affect the overall market.
Breakup of Primary Research:

To know about the assumptions considered for the study, download the pdf brochure
Market Size Estimation
The research methodology used to estimate the size of the aluminum brazing market includes the following details. The market size was determined from the demand side. The market was upsized based on the demand for aluminum brazing materials in different end-use industries at the regional level. Such procurements provide information on the demand aspects of the aluminum brazing industry for each industry. For each end-use industry, all possible segments of the aluminum brazing market were integrated and mapped.

Data Triangulation
After arriving at the overall size from the market size estimation process explained above, the total market was split into several segments and subsegments. The data triangulation and market breakdown procedures explained below were implemented, wherever applicable, to complete the overall market engineering process and arrive at the exact statistics for various market segments and subsegments. The data was triangulated by studying various factors and trends from the demand and supply sides. Along with this, the market size was validated using both the top-down and bottom-up approaches.
Market Definition
Aluminum brazing is a joining process where a filler metal with a lower melting point than the base aluminum is melted and distributed between close-fitting parts by capillary action, creating strong, corrosion-resistant, and lightweight joints. The aluminum brazing market refers to the industry focused on aluminum-based filler materials such as aluminum-silicon, zinc, copper, magnesium, and other alloys available in forms like wires, rods, paste, and sheets. These materials are widely used across the automotive, aerospace & defense, electrical & electronics, industrial, marine, and renewable energy sectors.
The growth of aluminum brazing alloys has been significantly driven by rising demand across industries such as automotive, HVAC, aerospace, and electronics, where lightweight, corrosion-resistant, and thermally efficient materials are essential. These alloys, primarily based on aluminum-silicon compositions, are increasingly used in manufacturing heat exchangers, radiators, condensers, and battery cooling systems, particularly in electric vehicles. Technological advancements such as Controlled Atmosphere Brazing (CAB), development of clad materials, and improved filler compositions with elements like zinc, copper, and magnesium have enhanced performance, joining quality, and corrosion resistance.
Stakeholders
- Aluminum Brazing Materials Manufacturers
- Aluminum Brazing Materials Distributors and Suppliers
- Universities, Governments, and Research Organizations
- Associations and Industrial Bodies
- R&D Institutes
- Environmental Support Agencies
- Investment Banks and Private Equity Firms
- Research and Consulting Firms
Report Objectives
- To define, describe, and forecast the aluminum brazing market size in terms of volume and value
- To provide detailed information regarding the key factors, such as drivers, restraints, opportunities, and challenges influencing the market growth
- To analyze and project the global aluminum brazing market by product type, product form, end-use industry, and region
- To forecast the market size concerning five main regions (along with country-level data), namely, North America, Europe, Asia Pacific, Middle East & Africa, and Latin America, and analyze the significant region-specific trends
- To strategically analyze micromarkets with respect to individual growth trends, prospects, and contributions of the submarkets to the overall market
- To analyze the market opportunities and the competitive landscape for stakeholders and market leaders
- To assess recent market developments and competitive strategies, such as agreements, contracts, acquisitions, and product developments/product launches, to draw the competitive landscape
- To strategically profile the key market players and comprehensively analyze their core competencies
Key Questions Addressed by the Report
What is aluminum brazing?
Aluminum brazing joins aluminum parts using a filler metal (like aluminum-silicon alloys) melted at 400-600°C via capillary action for strong, leak-tight bonds.
How does aluminum brazing work?
A flux removes the oxide layer, the filler melts and flows into joints under heat (often controlled atmosphere brazing), then solidifies for corrosion-resistant connections.
Which industries aluminum brazing use it most?
Primarily automotive (65% share for heat exchangers and EV batteries), aerospace, HVAC, and electronics for lightweight, efficient components.
Why is demand growing for aluminum brazing?
Rising need for fuel-efficient EVs, lightweight materials, and thermal management drives the market from $2.05B in 2025 to $2.88B by 2032 at 5% CAGR.
What challenges exist in aluminum brazing market?
Oxide barriers, base metal erosion, raw material price volatility, and regulatory compliance for eco-friendly fluxes hinder process reliability.
Need a Tailored Report?
Customize this report to your needs
Get 10% FREE Customization
Customize This ReportPersonalize This Research
- Triangulate with your Own Data
- Get Data as per your Format and Definition
- Gain a Deeper Dive on a Specific Application, Geography, Customer or Competitor
- Any level of Personalization
Let Us Help You
- What are the Known and Unknown Adjacencies Impacting the Aluminum Brazing Market
- What will your New Revenue Sources be?
- Who will be your Top Customer; what will make them switch?
- Defend your Market Share or Win Competitors
- Get a Scorecard for Target Partners

Custom Market Research Services
We Will Customise The Research For You, In Case The Report Listed Above Does Not Meet With Your Requirements
Get 10% Free CustomisationTESTIMONIALS

We at Nissan Chemicals Corporation have been clients of MarketsandMarkets for more than a year now. We recently consulted MarketsandMarkets for a study, the team at MarketsandMarkets was extremely professional and organized. The business insights were very detailed and aligned well with our expectations that really helped us formulate the Business Plans and device new strategies for development themes. MarketsandMarkets offers a unique combination of expertise and dedicated engagement model. Their research findings have helped us in designing our Pricing Strategy which will make it easier for us to predict the future sales and profits for the next ten years. We look forward to working with MarketsandMarkets in the future.
VP of Strategy & New Business Development
Leading Specialty Chemical Company
The MarketsandMarkets Engagement Model, composed of both the Knowledge Store and advisory custom research, has greatly helped us in understanding our markets and making strategic decisions. The Knowledge Store is a fast way to allow everyone in our organization to understand more about most any market they are interested in. The ability to then get custom research done and get answers to specific strategic questions and market insight has been spectacular. The Markets and Markets team feel more like colleagues than vendors and their services have helped us change our culture where statements of things like growth opportunities and competitive position are always backed by industry research.

Rich Gibson,
Director, Corporate Strategy
Milliken & Company,
Leading Industrial Manufacturer of specialty chemical, floor covering, performance and protective textile materials, and healthcaremilliken.com
MarketsandMarkets is a trusted resource that helps us to better understand markets that are near-adjacencies-whether its technology, value chain or geography. Their Knowledge Store platform provides a dashboard of markets and their characteristics which is easy to use and saves us time.
Adam Shaw,
Market Development and Strategy Manager
AdvanSix Inc. USA,
An American Leader in Chemicalswww.advansix.com
The Knowledge Store from MarketsandMarkets is a valuable tool which has helped my team acquire greater insight in to the end markets that our business serves. This has enabled us to help our company build stronger strategies throughout our planning process.
TOSHIO KINOSHITA
Senior Chif Consultion Research & Consulting Division
Mitsubishi Chemical Research Corporation,
Leading Manufacturer of Chemical Productswww.mitsubishichem-res.co.jp/en/

We recently engaged with MarketsandMarkets for a study, the team not only clearly understood our business objectives but was also extremely professional in the way they handled the entire project. The study was efficiently conducted in a phase-wise manner, and the engagement model furnished us with high-quality business insights that far exceeded our expectations at each phase. We were especially happy that MarketsandMarkets could provide us with both, an English as well as a Japanese version of the study. A special thanks to the Analyst Team and Client Services Team, whose fluency in Japanese enhanced our comfort level, as we could converse with them in our preferred language.
Independent entrepreneurs
Arrow Precision
We approached MarketsandMarkets for study on Proppants Market, and their work exceeded our expectations. The study conducted was comprehensive and enabled us to view the market through the various dimensions. In addition, the team was extraordinarily responsive throughout the process and resolved our queries on time. I strongly recommend MarketsandMarkets and will certainly consider them for additional market assessments we will need in the future.
Global engineering company, Japan
Deputy Manager,
Strategic Planning OfficeThe high-quality insights shared by the MarketsandMarkets team helped us understand the pharmaceutical plant designers in a specific geography. It also captured the risks that we may likely face in communicating with our potential partners. The study would enable us identify partners, which would impact our future growth.


Growth opportunities and latent adjacency in Aluminum Brazing Market