
Anti-Drone Market Size, Share & Trends, 2025 To 2030

Anti-Drone Market Size, Share, Growth & Trends by Electronic Systems, Kinetic Systems, Laser Systems, Hybrid Systems, Ground-based, Handheld, UAV-based, Detection, Detection & Disruption, Long-range, Medium-range and Short-range - Global Forecast to 2030


ANTI-DRONE MARKET OVERVIEW
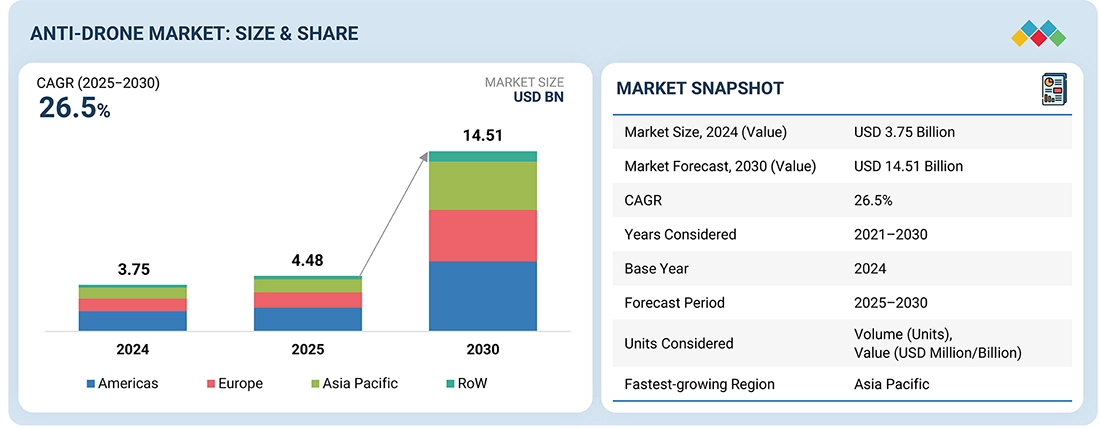
According to Marketsandmarkets, the global anti-drone market size will reach USD 14.51 billion by 2030 from USD 4.48 billion in 2025, registering a CAGR of 26.5% from 2025 to 2030. Rising frequency of unauthorized unmanned aerial aircraft (UAS) sightings near international airports, growing adoption of anti-drone solutions by military & defense agencies, rising illicit activities, advancements in detection and jamming technologies, integration of AI and ML in drone detection and tracking, ongoing advancements in anti-drone technology, and expanding infrastructure in smart cities are the major factors influencing market growth.
The Anti-Drone industry size is expanding rapidly as governments, defense agencies, and private organizations focus on protecting critical infrastructure from unauthorized unmanned aerial vehicles. The increasing use of drones in surveillance, logistics, and recreational activities has also created new security challenges, which is driving significant anti-drone market growth worldwide. Many countries are investing heavily in advanced detection and neutralization technologies such as radar systems, radio frequency jammers, and directed energy weapons, strengthening the overall anti-drone market of major defense technology providers. In addition, evolving anti-drone market such as AI-based drone detection, integrated airspace security platforms, and portable counter-drone systems are transforming the global Anti-Drone industry.
Furthermore, rising security concerns around airports, military bases, government facilities, and public events are accelerating anti-drone market across multiple regions. The Anti-Drone industry is witnessing increasing collaboration between defense contractors, technology firms, and regulatory authorities to develop more effective counter-drone solutions. As a result, the anti-drone market size continues to increase with growing adoption of multi-layered security systems capable of detecting, tracking, and mitigating drone threats. At the same time, emerging anti-drone market such as autonomous defense systems and advanced sensor integration are expected to further strengthen anti-drone market, positioning the Anti-Drone industry for substantial long-term expansion.
REPORT SCOPE
| REPORT METRIC | DETAILS |
|---|---|
| Market Size, 2025 (Value) | USD 4.48 Billion |
| Market Forecast, 2030 (Value) | USD 14.51 Billion |
| Growth Rate | CAGR of 26.5% from 2025 to 2030 |
| Years Considered | 2021–2030 |
| Base Year | 2024 |
| Forecast Period | 2025–2030 |
| Units Considered | Value (USD Million/Billion), Volume (Units) |
| Report Coverage | Revenue Forecast, Company Ranking, Competitive Landscape, Growth Factors, and Trends |
| Top Companies |
|
| Growth Drivers |
|
| Segments Covered |
|
| Regions Covered | Americas, Europe, Asia Pacific, Rest of the World (RoW) |
Market Size & Forecast
ANTI-DRONE MARKET KEY TAKEAWAYS
-
BY SYSTEM TYPESystem types include electronics systems, kinetic systems, laser systems, and hybrid systems. Laser systems are set to lead in terms of growth due to their precision and rapid neutralization capabilities.
-
BY RANGEThe range segment includes short range, medium range, and long range. Long-range systems are estimated to record the highest CAGR due to their extended coverage and enhanced threat interception capabilities.
-
BY PLATFORM TYPEPlatform types include ground-based, handheld, and UAV-based. Ground-based systems are preferred due to their reliable deployment, ease of integration, and continuous monitoring capabilities.
-
BY RADAR TYPEThe radar types include mechanically scanned array, phased array, AESA, PESA, and conventional radar. AESA radars are expected to have the highest CAGR due to their superior detection accuracy, faster target tracking, and multi-threat handling capabilities.
-
BY DEPLOYMENT TYPEThe deployment type segment includes portable radar, fixed radar, and vehicle-mounted radar. Fixed radar systems lead due to their continuous, wide-area coverage and stable, long-term surveillance capabilities.
-
BY FREQUENCY BANDFrequency bands include KU-band, X-band, C-band, S-band, L-band, and other frequency bands. S-band radars are projected to witness the highest CAGR due to their optimal balance of range, resolution, and performance in all-weather conditions.
-
BY APPLICATIONApplications include detection and detection & disruption. Detection & disruption lead due to their comprehensive threat management, enabling early identification and neutralization of unauthorized drones.
-
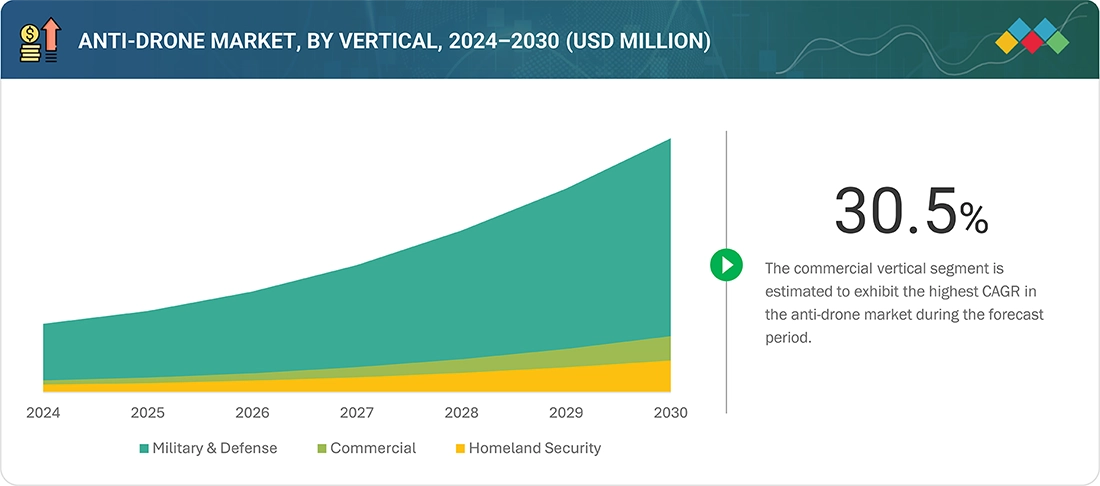
BY VERTICALMilitary & defense, commercial, and homeland security are the verticals considered. Military & defense is estimated to lead due to high-security priorities, significant budgets, and increasing adoption of counter-drone systems for asset and personnel protection.
-
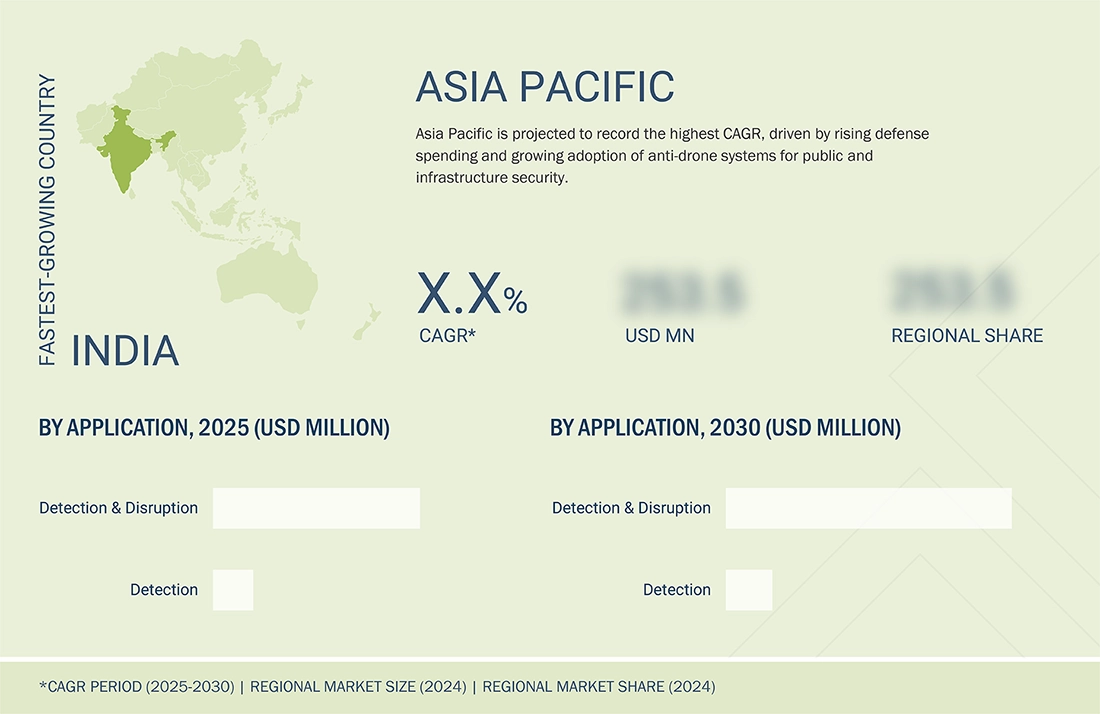
BY REGIONAsia Pacific is projected to exhibit the highest CAGR due to rising defense modernization, increasing drone threats, and growing investments in airport and critical infrastructure security.
-
COMPETITIVE LANDSCAPEThe major market players have adopted both organic and inorganic strategies, including partnerships, expansions, and product launches. In May 2025, Rafael Advanced Defense Systems introduced a cutting-edge mobile Counter-Unmanned Aerial System (C-UAS) integrated onto the Plasan StormRider 4×4 tactical armored vehicle.
The anti-drone market is experiencing strong growth driven by rising incidences of unauthorized drone activities near military bases, airports, and critical infrastructure. Defense modernization programs and increasing investments in electronic warfare are accelerating the adoption of advanced counter-UAS systems integrating radar, RF, and electro-optical sensors. Additionally, the growing use of AI and machine learning for autonomous drone detection and threat classification is enhancing system accuracy and response times. Expansion of smart city surveillance and border security initiatives further supports the deployment of scalable anti-drone solutions across both defense and civilian domains.
Source: Secondary Research, Interviews with Experts, MarketsandMarkets Analysis
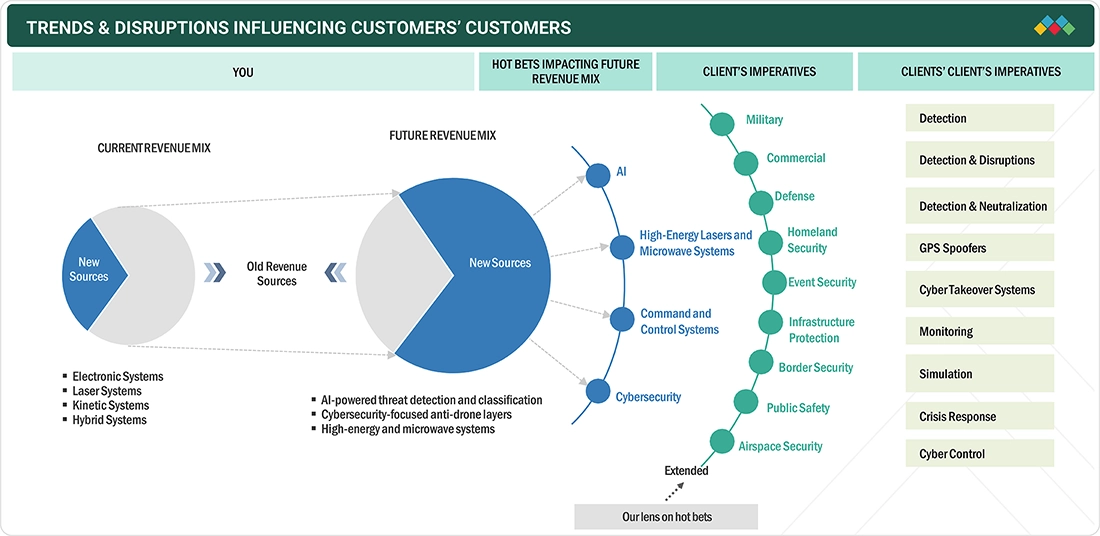
TRENDS & DISRUPTIONS IMPACTING CUSTOMERS' CUSTOMERS
The increasing use of high-energy lasers, AI detection, and hybrid systems is shifting revenue from traditional electronics to advanced counter-drone solutions. These systems are essential for addressing imperatives like border security, public safety, and infrastructure protection. While drones offer benefits, they also pose risks such as surveillance and safety threats at large gatherings. Anti-drone technologies enable real-time detection and neutralization of unauthorized drones, enhancing security by intercepting illegal activities and protecting critical infrastructure. They also ensure airspace safety, improving crisis response readiness and training through simulation. Overall, these systems contribute to a more secure environment against rising drone-related threats.
Revenue Shift – Trends & Disruptions Impacting Customers' Business
The anti-drone market is witnessing a shift in revenue generation from standalone drone detection systems toward integrated Counter-UAS platforms combining radar, RF sensing, EO/IR cameras, AI analytics, electronic warfare, and kinetic/non-kinetic mitigation. As drone threats become more sophisticated, customers are increasing investments in layered, AI-enabled solutions, creating new revenue opportunities through software upgrades, managed services, and system integration.
Investment and funding context:
The anti-drone market has witnessed rapid growth over the last few years due to the increasing use of drones for surveillance, smuggling, and unauthorized activities around critical infrastructure. Rising defense modernization programs, geopolitical tensions, and growing investments in AI-enabled detection, radar, RF, and jamming technologies continue to accelerate market adoption across military and civilian applications.
Source: Secondary Research, Interviews with Experts, MarketsandMarkets Analysis
ANTI-DRONE MARKET SHARE DYNAMICS
Level
-
Growing adoption of drone countermeasures in defense sector

-
Rising unauthorized drone sightings near airports globally

Level
-
Requirement for substantial upfront capital

-
Operational complexities and risk of false positives in drone detection

Level
-
Integration of AI and ML into drone detection and tracking platforms

-
Expansion of smart city infrastructure

Level
-
Vulnerabilities to hacking

-
Integration with existing security and surveillance ecosystems

Source: Secondary Research, Interviews with Experts, MarketsandMarkets Analysis
Driver: Rising unauthorized drone sightings near airports globally
Frequent safety incidents and near-misses at airports, plus drone intrusions at stadia and VIP events, have increased regulatory pressure and urgency for deployed anti-drone systems. Airports and event organizers are prioritizing detection, geofencing, and mitigation capabilities to avoid operational shutdowns and liability. This operational risk translates directly into commercial demand for turnkey counter-UAS solutions.
Restraint: Requirement for substantial upfront capital
Anti-drone solutions require expensive sensors (RADAR, RF, EO/IR), effectors, integration work, and ongoing maintenance, creating a steep total cost of ownership that can deter smaller airports, municipalities, and private venues. Budget constraints slow adoption and favor phased or as-a-service procurement models, but those add recurring costs.
Opportunity: Integration of AI and ML into drone detection and tracking platforms
AI and ML can significantly lower false positives by fusing radar, RF, and visual data, enabling reliable classification of birds vs. drones and improved tracking in cluttered environments. Vendors that deliver adaptive, software-driven upgrades can tap recurring revenue through analytics, model updates, and platform subscriptions.
Challenge: Vulnerabilities to hacking
Counter-UAS platforms rely on networks, firmware, and cloud components, making them potential targets for cyberattack or spoofing that could blind systems or create false alarms. Ensuring secure communications, tamper resistance, and resilient fail-safe modes is essential but costly, and failure undermines trust in the systems.
Anti-Drone Market Growth: COMMERCIAL USE CASES ACROSS INDUSTRIES
| COMPANY | USE CASE DESCRIPTION | BENEFITS |
|---|---|---|
 |
Counter-drone systems for military and critical infrastructure, focusing on radar-based detection and jamming solutions | Enhanced situational awareness, rapid drone threat neutralization, and protection of critical assets |
 |
Integrated anti-UAS solutions combining sensors, command-and-control systems, and neutralization technologies for defense applications | Comprehensive detection-to-neutralization coverage, seamless integration with existing defense systems, and scalable deployment |
 |
Multi-layered drone defense systems targeting urban environments and high-risk facilities, offering both detection and interception | Improved urban airspace safety, reduced collateral risk, and effective multi-threat management |
 |
Advanced C-UAS platforms for military and commercial use, emphasizing AI-based threat detection and electronic countermeasures | Faster threat response, intelligent detection algorithms, and adaptable countermeasure options for diverse scenarios |
 |
Modular counter-UAS solutions designed for battlefield and strategic asset protection, supporting kinetic and non-kinetic neutralization | Flexible deployment, reduced operational complexity, and protection of strategic sites from aerial threats |
Logos and trademarks shown above are the property of their respective owners. Their use here is for informational and illustrative purposes only.
ANTI-DRONE MARKET GROWTH ECOSYSTEM
The anti-drone ecosystem spans raw material and component suppliers, who provide sensors, radars, and electronics, system manufacturers developing integrated counter-UAS solutions, and distributors facilitating deployment. End users, including defense, airports, smart cities, and critical infrastructure, complete the chain, leveraging these solutions for detection, disruption, and neutralization of unauthorized drones. This interconnected ecosystem drives innovation, adoption, and market growth.
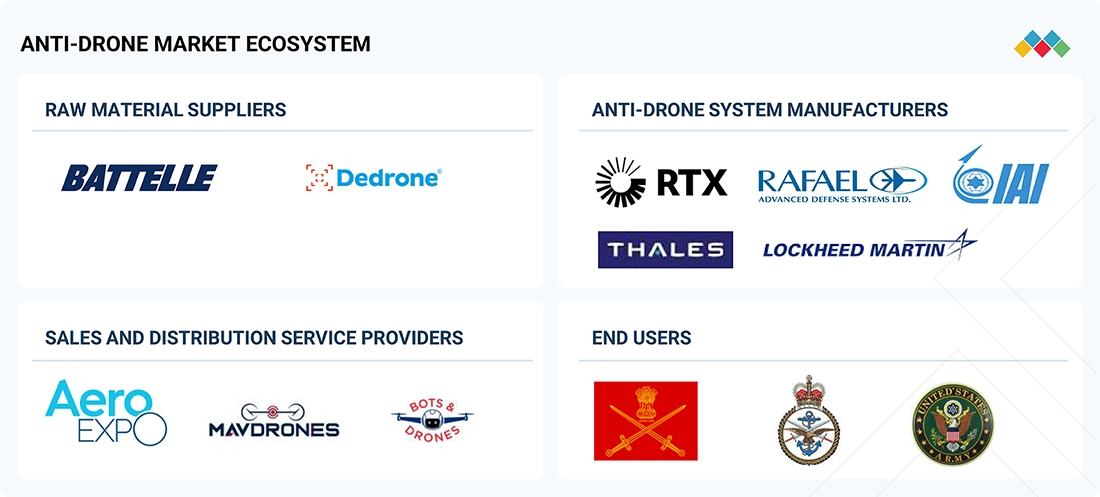
Logos and trademarks shown above are the property of their respective owners. Their use here is for informational and illustrative purposes only.
ANTI-DRONE MARKET SEGMENTS
Source: Secondary Research, Interviews with Experts, MarketsandMarkets Analysis
Anti-drone Market Trends, by System Type
Laser systems offer precise targeting and rapid neutralization of UAV threats with minimal collateral impact. Their effectiveness against fast-moving or high-altitude drones is driving adoption across defense and critical infrastructure sectors. As technological advancements reduce costs and improve reliability, laser systems are expected to grow fastest in the market.
Anti-drone Market, by Range
Long-range counter-drone systems provide extended coverage, allowing early detection and interception of unauthorized UAVs before they reach sensitive areas. Their ability to secure larger perimeters makes them attractive for airports, military bases, and large industrial sites. Increasing demand for perimeter security solutions is propelling the market growth for long-range systems.
Anti-drone Market, by Platform Type
Ground-based anti-drone systems remain dominant due to their stable deployment, ease of maintenance, and continuous surveillance capability. They can integrate multiple detection and mitigation technologies, providing reliable protection for static assets. These systems are widely deployed in defense installations, airports, and critical infrastructure.
Anti-drone Market, by Radar Type
Active Electronically Scanned Array (AESA) radars offer superior detection accuracy, faster multi-target tracking, and adaptability to complex threat environments. Their ability to handle multiple drones simultaneously and resist electronic interference makes them highly attractive. As adoption grows in both defense and commercial sectors, AESA radars are expected to exhibit a rapid CAGR.
Anti-drone Market, by Deployment Type
Fixed radar systems provide continuous, wide-area monitoring with consistent performance over long periods. Due to their stability and low operational complexity, they are ideal for securing airports, borders, and large infrastructure. Their reliability and integration capability keep them leading in market share.
Anti-drone Market, by Frequency Band
S-band radars balance range, resolution, and all-weather operational performance, making them suitable for both short- and long-range counter-UAS applications. Their versatility across diverse environments drives increasing adoption in airports, urban areas, and military sites. This adaptability is a key factor behind their high projected CAGR.
Anti-drone Market, by Application
Detection & disruption applications lead the market because they provide comprehensive threat management, from early identification to neutralization. They combine multiple technologies—RF, radar, optical, and jamming—to mitigate drone threats effectively. Their critical role in ensuring airspace safety drives consistent demand.
Anti-drone Market, by Vertical
The military & defense segment dominates due to high-security priorities, dedicated budgets, and the need to protect personnel and critical assets. Counter-drone solutions are increasingly integrated into national defense strategies, boosting procurement and deployment. Strategic importance ensures this segment maintains the largest market share.
ANTI-DRONE MARKET BY REGION
Asia Pacific to exhibit the fastest CAGR in the global anti-drone market during the forecast period
Asia Pacific is projected to grow the fastest due to rising defense modernization, increasing drone threats, and growing investment in airport, border, and critical infrastructure security. Countries like China, India, Japan, and South Korea are rapidly adopting advanced counter-drone systems. Regional geopolitical tensions and urbanization further drive market expansion.
The Asia Pacific anti-drone market is projected to reach USD 3.89 billion by 2030 from USD 1.05 billion in 2025, at a CAGR of 30.0% from 2025 to 2030. The regional market is projected to witness rapid expansion, driven by escalating unauthorized drone activity around international borders, airports, energy facilities, military bases, and high-density urban zones. The market is expected to grow strongly through 2030 as governments, defense forces, and homeland security agencies accelerate investments in advanced counter-UAS solutions. Rising cross-border drone smuggling, espionage attempts, and airspace violations are prompting large-scale adoption of radar, RF-based detection, EO/IR tracking, and AI-enabled mitigation systems. National modernization programs, including India’s defense procurement initiatives, Japan’s civil-airspace safety upgrades, China’s critical-infrastructure protection efforts, and Australia’s airport and seaport security enhancements, further boost demand.
The Europe anti-drone market is projected to reach USD 4.16 billion by 2030 from USD 1.24 billion in 2025, at a CAGR of 27.5% from 2025 to 2030. The Europe anti-drone market is driven by the steady rise in unauthorized drone activities around airports, critical infrastructure, military facilities, and public event venues, prompting governments and security agencies to adopt advanced counter-UAS solutions. Growing investments by the European Union, NATO member states, and national defense ministries are accelerating the deployment of radar, RF-based detection, EO/IR, and AI-enhanced mitigation platforms across both border protection and civilian airspace management operations.
The North American anti-drone market is projected to reach USD 5.22 billion by 2030 from USD 1.79 billion in 2025, at a CAGR of 23.8% from 2025 to 2030. The regional market is driven by the rapid rise in unauthorized drone intrusions across critical infrastructure, defense bases, airports, and public events, prompting agencies to adopt advanced counter-UAS systems. Increasing investments by the US Department of Defense and homeland security bodies are accelerating the deployment of radar, RF, EO/IR, and AI-enabled detection and mitigation platforms. The strong defense industrial base, coupled with active R&D programs in electronic warfare and autonomous threat neutralization, further strengthens adoption. Additionally, growing commercial drone traffic and evolving regulatory frameworks requiring enhanced airspace protection continue to fuel long-term market demand.
Anti-Drone Market: COMPANY EVALUATION MATRIX
RTX is a leading player with a substantial market share and a broad product portfolio across radar, detection, and counter-drone solutions, supported by extensive deployments and technology expertise. Boeing is an emerging leader with a growing market presence and an expanding product lineup, leveraging advanced technologies and strategic initiatives to strengthen its position in the anti-drone market.

Source: Secondary Research, Interviews with Experts, MarketsandMarkets Analysis
KEY MARKET PLAYERS - Top Anti-drone Companies
WHAT IS IN IT FOR YOU: Anti-Drone Market REPORT CONTENT GUIDE
DELIVERED CUSTOMIZATIONS
We have successfully delivered the following deep-dive customizations:
| CLIENT REQUEST | CUSTOMIZATION DELIVERED | VALUE ADDS |
|---|---|---|
| Global Defense OEM | Comprehensive benchmarking of anti-drone technologies—radar, RF, laser, and hybrid systems—across Tier-1 vendors (RTX, Lockheed, Leonardo, Thales, IAI) |
|
| European Homeland Security Authority | Analysis of counter-UAS deployment models in airports and public venues with a focus on regulatory compliance and airspace safety |
|
| North American Defense Integrator | Evaluation of AI/ML-based detection and classification algorithms in multi-sensor systems |
|
| Asia Pacific Border Protection Agency | Cost-performance benchmarking of kinetic versus non-kinetic countermeasures for mobile and fixed installations |
|
| Middle East Critical Infrastructure Operator | Assessment of anti-drone systems for energy and petrochemical facilities with radar and RF integration |
|
RECENT DEVELOPMENTS IN ANTI-DRONE INDUSTRY
- Jun 2026 : Anduril Industries expanded its anti-drone (Counter-UAS) portfolio by integrating AI-enabled autonomous detection and interception capabilities to strengthen protection of military bases and critical infrastructure.
- May 2026 : RTX (Raytheon) enhanced its anti-drone (Counter-UAS) solutions by integrating radar, EO/IR sensors, RF detection, and electronic warfare technologies to improve defense against evolving drone threats.
- April 2026 : Lockheed Martin advanced its anti-drone (Counter-UAS) capabilities by strengthening AI-driven target identification and command-and-control integration for layered air defense operations.
- March 2026 : Leonardo upgraded its anti-drone (Counter-UAS) Falcon Shield system with enhanced radar and electronic countermeasure capabilities to safeguard airports, military installations, and critical infrastructure from unauthorized drones.
- January 2026 : Dedrone strengthened its anti-drone (Counter-UAS) platform by expanding AI-powered drone detection, identification, and mitigation capabilities, enabling faster response to unauthorized drone activities across airports, stadiums, and critical infrastructure.
Table of Contents
 Exclusive indicates content/data unique to MarketsandMarkets and not available with any competitors.
Methodology
The study involved major activities in estimating the current market size for the anti-drone market. Exhaustive secondary research was done to collect information on the market. The next step was to validate these findings, assumptions, and sizing with industry experts across the value chain using primary research. Different approaches, such as top-down and bottom-up, were employed to estimate the total market size. After that, the market breakup and data triangulation procedures were used to estimate the market size of the segments and subsegments of the anti-drone market.
Secondary Research
The secondary research for this study involved gathering information from various credible sources. These included company annual reports, investor presentations, press releases, whitepapers, certified publications, and articles from reputable associations and government publications. Additional data was obtained from corporate filings, professional and trade associations, journals, and industry-recognized authors. Research from consortia, councils, and gold- and silver-standard websites, directories, and databases also contributed to the qualitative framework. Key global sources, such as the International Trade Centre (ITC) and the International Monetary Fund (IMF), were consulted to support and validate the market analysis.
Primary Research
Extensive primary research was conducted after understanding and analyzing the anti-drone market scenario through secondary research. Several primary interviews were conducted with key opinion leaders from demand- and supply-side vendors across four major regions—Americas, Europe, Asia Pacific, and RoW. Approximately 20% of the primary interviews were conducted with the demand side and 80% with the supply side. Primary data was collected through questionnaires, e-mails, and telephonic interviews. Various departments within organizations, such as sales, operations, and administration, were contacted to provide a holistic viewpoint in the report..

To know about the assumptions considered for the study, download the pdf brochure
Market Size Estimation
Both top-down and bottom-up approaches were used to estimate and validate the total size of the anti-drone market. These methods were also used extensively to estimate the size of various subsegments in the market. The research methodology used to estimate the market size includes the following:
Anti-Drone Market : Top-Down and Bottom-Up Approach

Data Triangulation
After arriving at the overall size of the anti-drone market through the process explained above, the overall market has been split into several segments. Data triangulation procedures have been employed to complete the overall market engineering process and arrive at the exact statistics for all the segments, wherever applicable. The data has been triangulated by studying various factors and trends from the demand and supply sides. The market has also been validated using top-down and bottom-up approaches.
Market Definition
An anti-drone system refers to a comprehensive set of technologies and solutions designed to detect, monitor, identify, and mitigate threats posed by unauthorized or hostile drones. These systems are increasingly essential as the use of drones grows across various sectors, raising concerns over security, privacy, and safety. Anti-drone technologies employ a combination of sensors such as radar, radio frequency (RF) detectors, electro-optical and infrared cameras, and acoustic sensors to detect and track drones in real time accurately. Once detected, these systems can neutralize the threat through various disruption methods, including RF jamming, GPS spoofing, directed energy weapons such as lasers, or physical interception. Anti-drone solutions safeguard critical infrastructure, military installations, airports, public gatherings, and sensitive government or commercial sites from potential risks, such as espionage, smuggling, sabotage, or attacks.
Key Stakeholders
- Brand Product Manufacturers/Original Equipment Manufacturers (OEMs)/Original Device Manufacturers (ODMs)
- Anti-drones Product Manufacturers
- Anti-Drone Material and Component Suppliers
- Manufacturing Equipment Suppliers
- System Integrators
- Technology/IP Developers
- Consulting and Market Research Service Providers
- Government and Military Agencies
- Anti-drones-related Associations, Organizations, Forums, and Alliances
- Venture Capitalists and Startups
- Research and Educational Institutes
- Distributors and Resellers
- End Users
Report Objectives
- To define, describe, and forecast the anti-drone market size, by system type, platform type, application, vertical, range, radar type, radar deployment type, and radar frequency band, in terms of value
- To describe and forecast the market size for four key regions: the Americas, Europe, Asia Pacific, and the Rest of the World (RoW), in terms of value
- To define, describe, and forecast the anti-drone market size, by vertical, in terms of volume
- To provide detailed insights regarding drivers, restraints, opportunities, and challenges influencing the growth of the market
- To analyze emerging applications and standards in the anti-drone market
- To examine manufacturers of anti-drone solutions, their strategies, production plans, and the overall value chain, including material and component suppliers
- To strategically analyze the micromarkets1 with respect to individual growth trends, prospects, and contributions to the overall market
- To analyze the market opportunities for stakeholders and provide a comprehensive competitive landscape analysis
- To provide a detailed overview of the anti-drone ecosystem
- To provide a detailed overview of the impact of AI/Gen AI, the macroeconomic outlook for all regions, and the 2025 US tariff impact on the anti-drone market
- To provide information about the key technology trends, trade analysis, and patents related to the anti-drone market
- To strategically analyze average selling price trends, trends impacting customer business, regulatory landscape, patent landscape, Porter’s five forces, import and export scenarios, trade landscape, and case studies pertaining to the market under study
- To benchmark the market players using the proprietary company evaluation matrix framework, which analyzes them on various parameters within the broad categories of market ranking/share and product portfolio
- To analyze competitive developments, such as partnerships, acquisitions, expansions, collaborations, and product launches, in the market
- To strategically profile key players and analyze their market share, ranking, and core competencies
Customization Options
With the market data given, MarketsandMarkets offers customizations according to the company’s specific needs. The following customization options are available for the report:
Company Information
- Detailed analysis and profiling of additional market players (up to 7)
Key Questions Addressed by the Report
What is the current size of the global Anti-Drone market?
According to MarketsandMarkets, the global anti-drone market size will reach USD 14.51 billion by 2030 from USD 4.48 billion in 2025. adoption across defense and critical infrastructure sectors.
What is the expected growth rate of the Anti-Drone market?
The Anti-Drone market is expected to grow at a CAGR of 26.5% during 2025–2030, driven by increasing drone threats, defense modernization, and demand for airspace protection.
What are the major growth drivers of the Anti-Drone industry?
Key growth drivers include rising unauthorized drone activities near airports and military bases, increasing defense investments, protection of critical infrastructure, AI-enabled drone detection, and expanding smart city security initiatives.
What are the latest trends in the Anti-Drone market?
Major trends include AI and Machine Learning integration, multi-sensor detection systems, laser-based counter-drone technologies, RF jamming, directed-energy weapons, portable anti-drone systems, and integrated airspace security platforms.
Which companies are leading the global Anti-Drone market?
Leading companies include RTX, Lockheed Martin Corporation, Leonardo S.p.A., Thales, and Israel Aerospace Industries (IAI), which focus on advanced detection, tracking, and neutralization technologies.
Which region is expected to witness the highest market growth?
Asia Pacific is projected to register the fastest growth with a CAGR of 30.0%, increasing from USD 1.05 billion in 2025 to approximately USD 3.89 billion by 2030, supported by defense modernization and border security investments.
Which industry segment dominates the Anti-Drone market?
The Military & Defense segment holds the largest market share because of growing investments in national security, border surveillance, critical infrastructure protection, and counter-UAS deployment.
Which technology segments are expected to grow the fastest?
Laser systems are expected to witness the highest growth among system types, while long-range anti-drone systems are projected to record the fastest CAGR due to their extended surveillance and interception capabilities.
What analysis does the MarketsandMarkets report provide?
The report provides analysis by system type, platform, application, vertical, range, radar type, deployment type, frequency band, company rankings, competitive landscape, market dynamics, trends, forecasts, and regional outlook across the Americas, Europe
What factors could challenge the growth of the Anti-Drone market?
Major challenges include high initial deployment costs, operational complexity, false-positive detections, cybersecurity vulnerabilities, integration with existing surveillance systems, and regulatory restrictions on counter-drone technologies.
Need a Tailored Report?
Customize this report to your needs
Get 10% FREE Customization
Customize This ReportPersonalize This Research
- Triangulate with your Own Data
- Get Data as per your Format and Definition
- Gain a Deeper Dive on a Specific Application, Geography, Customer or Competitor
- Any level of Personalization
Let Us Help You
- What are the Known and Unknown Adjacencies Impacting the Anti-Drone Market
- What will your New Revenue Sources be?
- Who will be your Top Customer; what will make them switch?
- Defend your Market Share or Win Competitors
- Get a Scorecard for Target Partners

Custom Market Research Services
We Will Customise The Research For You, In Case The Report Listed Above Does Not Meet With Your Requirements
Get 10% Free CustomisationTESTIMONIALS

Tetsuya Ohhira
Business Development Manager-Technology Business
Nikon Corporation,
Leading Japanese MNC specializing in optics and imaging productswww.nikon.com
MarketsandMarkets™ response
is quick. Their attitude is flexible and positive. Analyst Insights are globally considered and
significant. Client Services quickly respond to our inquiry and demand. Their wide range of global
surveys help us make our strategic plan.
We hope Knowledge Store will be easier to search
for a report.
VP - Marketing & Business Development
Leading Provider of Process Control Solutions
We engaged with MarketsandMarkets on a study to perform an analysis and recommend a Go-To-Market strategy for metrology and process control in the semiconductor market. The study was tailored to our targets and needs with well-defined milestones. Our overall experience with the MarketsandMarkets team was very good throughout the project in all aspects including the analysis methodologies used, the quality and depth of primary and secondary data sets, the professionalism and flexibility of the team and the ability to meet the target schedule and milestones. We want to thank MarketsandMarkets team for a job well done.
- US Anti-Drone Market
- Canada Anti-Drone Market
- Mexico Anti-Drone Market
- UK Anti-Drone Market
- Germany Anti-Drone Market
- France Anti-Drone Market
- Italy Anti-Drone Market
- Spain Anti-Drone Market
- Russia Anti-Drone Market
- Poland Anti-Drone Market
- China Anti-Drone Market
- Japan Anti-Drone Market
- India Anti-Drone Market
- South Korea Anti-Drone Market
- Australia Anti-Drone Market
- Indonesia Anti-Drone Market
- Malaysia Anti-Drone Market
- Thailand Anti-Drone Market
- Vietnam Anti-Drone Market
- Nordics Anti-Drone Market
- Rest Of Europe Anti-Drone Market
- Rest Of Asia Pacific Anti-Drone Market
- Bahrain Anti-Drone Market
Growth opportunities and latent adjacency in Anti-Drone Market


Elliot
Apr, 2026
What are the primary drivers, restraints, opportunities, and challenges influencing the adoption of anti-drone systems globally, especially in relation to increasing unauthorized drone activities near airports and critical infrastructure?.
Adam
Apr, 2026
How do different anti-drone system types such as electronic systems, laser systems, kinetic systems, and hybrid systems compare in terms of effectiveness, cost, and deployment across various defense and commercial applications?.
Aric
Apr, 2026
What role does radar technology play in anti-drone systems, and how do different frequency bands like X-band, C-band, and Ku-band impact detection accuracy and operational performance?.
naveen
Jul, 2017
I visited IFSEC, London. There were few talks about the booming market for counter-drone system and hence would like to have a deep dive on this report for understanding preposition with drones market..
Viacheslav
Sep, 2019
Final goal is the overview of anti-drone market in order to workout the strategy for planning protection of an oilfield ..
User
Sep, 2019
The Federal Aviation Administration (FAA) of US prohibits the operation of drones near other aircraft, especially near airports, over groups of people, public events, or stadiums. Who are major regulating authorities impacting the drone regulations worldwide?.
David
Jan, 2019
Hello, I am writing a report for a class at my University on innovation in the counter-UAV space. I cannot afford the $5.6K license, but I would really love to read your report. I will not share or send it to anybody else..
Peter
Apr, 2019
We observe that you have included analysis of counter UAS for commercial places too. Would like to know the companies specifically targeting these infrastructures..
User
Sep, 2019
We look forward to low-cost and effective counter-drone technology. Who are the players offering both detection and intrusion systems in the market? We are looking forward to acquiring or partnering with such players especially in Eastern Europe..
Jorge
Oct, 2019
We are one of the main global consulting and technology companies in the world especially for detection systems. We would like to contribute to your analysis in order to increase the knowledge basis. .
User
Sep, 2019
Would be interested in knowing the role of radars as counter drone defense systems. How is the adoption rate of radars in the next 5 years? Which application would be using radar counter drone systems?.
Dunja
Jan, 2019
I am looking for insights on the drone industry, information specifically on the use of drones in the military applications and counter drone market for the same. I need this information for presenting it to investors. .
Kenneth
Mar, 2016
The report mentions companies such as Lockheed, SAAB, Blighter, etc. as providers of anti-drone systems. But these manufacturers have solutions suitable for governments and their national defense budgets, what about solutions for privately held companies and residential?.
Andres
Dec, 2019
Dear Sir/Madam, I would like to kindly request the PDF brochure and a sample of the Anti-Drone Market Global Forecast to 2024 to evaluate the possibility of purchasing the complete study with the purpose of complementing the business outlook for our company. .
Anthony
Dec, 2017
It's hard to have any faith in your report given that you did not even mention the single largest supplier of anti-drone technology to the US Army, SRC, Inc. Gryphon Sensors is a subsidiary of SRC and builds sophisticated sensor systems of the commercial and near commercial drone security markets. Gryphon was also one of the 4 companies to demonstrate drone detection technology for the FAA Drone Detection CRDA..
User
Nov, 2019
Drone legislation is still scarce and differs from country to country. Does the report cover detailed analysis of regulations in major countries mentioned in the report?.
ramon
Oct, 2016
I am looking to get some overall market statistics, market overview, and market forecasts (in $ and quantity)..
hailing
Jul, 2019
We are a start-up company designing and manufacturing anti-drone radar. We are working on our business plan and hence would like to understand the dynamics from you..
Dipal
Jun, 2017
I am doing research on Drone detection market. I am interested specifically in US market. Primary thing I am looking for is Porter's five force analysis..
Aislan
May, 2016
Hi, I'm a student of a well-known University and my project is related to drones. Is it possible to get this report for education propose to cite it in my research publication?.
User
Mar, 2019
Artificial intelligence and other related concepts are able to provide an early solution to future drone threats such as swarms, autonomous drones, and new types of drones with unique RF signatures. What are the latest trends in anti-drone technologies?.
Yashodhan
Feb, 2019
I am writing a research paper on the rise of Drone Technology and I need to cover up entire segments of the market. From ATC to Anti-Drone. I'm only a student and it would be great if you could assist me on this. Thanks..
Nam
Feb, 2019
I'm looking for a general understanding of the players involved in the anti-drone space, what technology they're developing and the commercial viability of said tech.
Christophe
Jan, 2019
I am more interested in share of various technologies in anti drone systems market, and which one should be preferred more for developing new system..