
Can Coatings Market

Can Coatings Market by Type (Epoxy, Acrylic, Polyester, Other Types), Application (Food Cans, Beverage Cans, Aerosol Cans, Other Applications), and Region - Global Forecast to 2030


CAN COATINGS MARKET OVERVIEW
Source: Secondary Research, Interviews with Experts, MarketsandMarkets Analysis
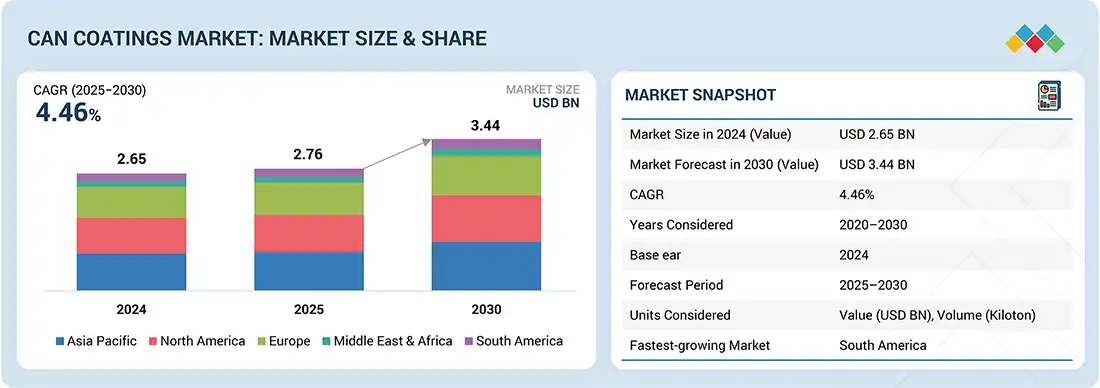
The global can coatings market is expected to grow from USD 2.76 billion in 2025 to USD 3.44 billion by 2030, at a CAGR of 4.46% during this period. Can coatings refer to protective, decorative, or functional coatings applied to cans, metal sheets, or components, and include applications such as coatings for two-piece and three-piece cans, sheet coating lines, side-seam sprays, and sealing compounds. This market is expanding due to the increasing demand for safe, durable, and sustainable packaging solutions within the food and beverage industry.
KEY TAKEAWAYS
-
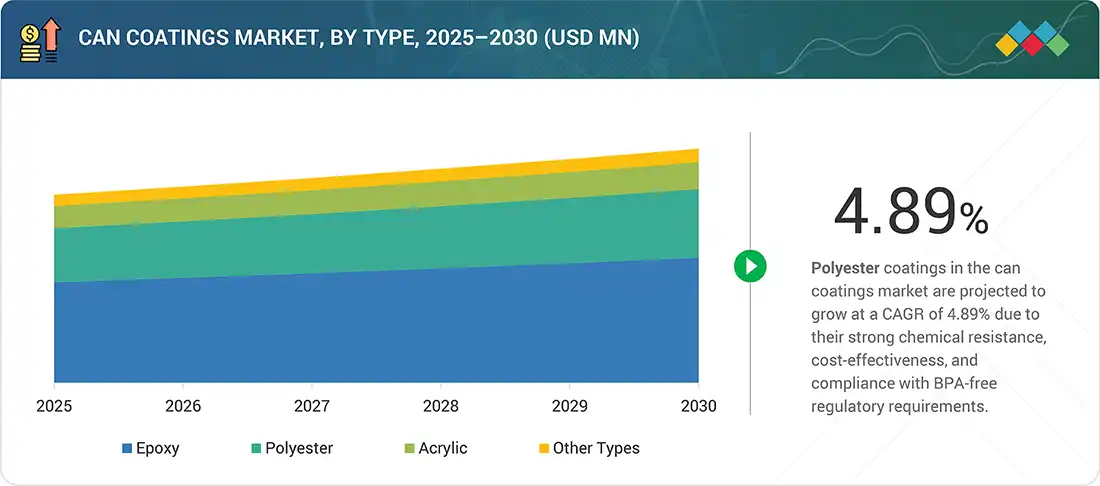
BY TYPEEpoxy can coatings are projected to grow at a CAGR of 4.43% as they offer excellent adhesion, chemical resistance, and durability, making them widely preferred for beverage and food cans while transitioning toward BPA-non-intent alternatives to meet regulatory demands.
-
BY APPLICATIONThe food cans segment is projected to register a CAGR of 4.27%, making it the second-fastest-growing segment in its category. This growth is driven by an increase in the consumption of packaged and canned foods, a demand for extended shelf life, and safety regulations that require effective protective linings.
-
BY REGIONThe South American can coatings market is experiencing rapid growth; the region is projected to register a CAGR of 5.07%. This growth is driven by the increased demand for packaged food and beverages, rising urbanization, and growing investments in sustainable, corrosion-resistant can packaging solutions in emerging economies. As a result, the region is leading in terms of growth rate.
-
COMPETITIVE LANDSCAPEThe major market players have adopted both organic and inorganic strategies, including expansions, collaborations, acquisitions, and investments. For instance, PPG Industries, Inc. announced the global expansion of its BPA-NI (Bisphenol A-Non-Intent) easy-open end coatings for aluminum beverage cans.
The increasing focus on food safety and compliance is impacting the can coatings market, as manufacturers are under increasing pressure to adhere to potential global regulations. A major driver has been the general phase-out of bisphenol-A (BPA), with the FDA, EFSA, and Health Canada either regulating it or having set extremely low tolerable limits on BPA migration into food and beverage products. For example, the European Union’s Regulation (EU) No. 10/2011 has placed strict conditions on food contact materials, requiring coatings to be tested under certain conditions, with zero leaching of harmful materials. In addition, the US has already banned BPA-based coatings in infant formula packaging, so many manufacturers anticipate nationwide bans under the enforcement of food safety regulations. Thus, the evolving stringent regulations are now causing companies to switch to epoxy-free options such as polyester, acrylic, and oleoresin-based coatings that ensure food safety while improving product stability. In addition to regulatory compliance momentum, consumer awareness has prompted increased core brand recognition among health-conscious consumers seeking safer packaging options. With the risk of reputational issues associated with non-compliance or risk of toxic exposure, alignment with both food safety regulations and consumer needs is needed for the product as part of the brand.
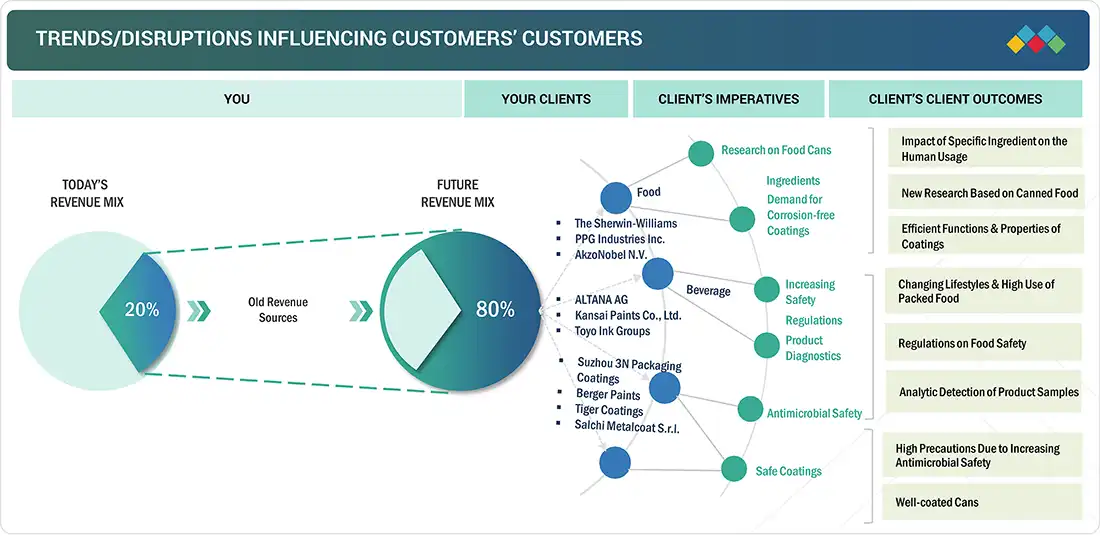
TRENDS & DISRUPTIONS IMPACTING CUSTOMERS' CUSTOMERS
The can coatings market primarily for food and beverage brands is experiencing shifting trends and disruptions driven by evolving consumer preferences and regulatory pressures. The rising demand for sustainable, BPA-free packaging is pushing manufacturers to adopt alternative coating technologies that ensure safety without compromising product performance. Disruptions such as fluctuating raw material prices, increasing recycling mandates, and advancements in lightweight metal packaging are further reshaping strategies, compelling end users to prioritize innovation, supply chain resilience, and eco-friendly solutions in their packaged products.
Source: Secondary Research, Interviews with Experts, MarketsandMarkets Analysis
MARKET DYNAMICS
Level
-
Adoption of aluminum over glass and plastic

-
Rising health & wellness for clean-label beverages and canned coatings

Level
-
Stringent regulations on epoxy resins and bisphenol-A

-
Complexity of developing multi-application coating technologies

Level
-
Growth in emerging economies

-
Eco-friendly raw materials and BPA-NI–based coatings

Level
-
Slow technological adoption in emerging markets

Source: Secondary Research, Interviews with Experts, MarketsandMarkets Analysis
Driver: Rising health & wellness for clean-label beverages and canned coatings
The global trend of health and wellness shapes the can coatings market, as consumers are compiling beverages packaged with health/wellness clean-first information. As concerns over chemical migration to food/drinks from can linings rise (especially about bisphenol-A, BPA), it is up to manufacturers to provide protective coatings that can be argued as safe and have performance assurance. The US Food and Drug Administration (FDA) has enacted specific restrictions on BPA in the packaging used for infant formulas, and the European Food Safety Authority has further tightened migration limits on BPA. This leads beverage companies to market transparency as a point of differentiation while promoting cans that are free from dangerous chemicals, showcasing the assurance of flavor and freshness from use of top can coatings in marketing materials.
Restraint: Complexity of developing multi-application coating technologies
A key challenge in the can coating industry is the inherent complexity involved in developing coatings that can be reliably used for a variety of beverage and food products. The chemical and physical challenges in different products, carbonated soft drinks, acidic juices, dairy-based beverages, and alcoholic beverages are unique owing to the high acidity, carbonation pressure, and thermal sterilization. Formulating a coating that is acid and alkaline-chemical-resistant, flexible, adhesive, and durable has been very complicated. Manufacturers are often confronted with trade-offs since the enhancement of one characteristic, such as acid resistance, can have a detrimental effect on another, e.g., flexibility or taste neutrality. Designing products that can fulfill this range of requirements requires significant research, complex blending of materials, and long-term testing, which only adds to the development time and financial cost of developing products. It is especially problematic when small and medium-sized manufacturers cannot afford to devise various specialized coatings to be used on various product lines.
Opportunity: Growth in emerging economies
The can coatings industry has significant potential in emerging markets, driven by demographic changes and economic factors that boost demand for packaged foods and beverages. Increased incomes, high urbanization rates, and the expansion of retail networks in regions such as the Asia Pacific, Latin America, and parts of Africa are accelerating the market for canned products. Consumer preferences are shifting toward convenience, with many people opting for ready-to-drink beverages, processed foods, and long-shelf-life products. This trend directly increases the demand for can coatings that ensure product integrity, preserve flavor, and guarantee safety. Additionally, governments are enforcing stricter safety regulations. Countries like Brazil and India are implementing more comprehensive packaging standards, which create opportunities for advanced coating technologies.
Challenge: Slow technological adoption in emerging markets
A significant challenge for the can coatings market is the pace of modernization in emerging regions, where buying decisions are often based on very tight budgets. While there may be demand from consumers for safe and sustainable packaging, many local producers are still using traditional coating systems which may not conform to the evolving health or sustainability criteria of their higher cost international counterparts. Reformulated coatings with advanced technologies require prolonged investments in improved equipment, training workers, and unique curing processes that also become economically untenable for small- and medium-sized producers in emerging regions. The lack of consistency and strict enforcement by local regulatory authorities further lowers the degree of urgency for transitioning to safer products.
Can Coatings Market: COMMERCIAL USE CASES ACROSS INDUSTRIES
| COMPANY | USE CASE DESCRIPTION | BENEFITS |
|---|---|---|
 |
Interior polymer lining of aluminum beverage cans to separate cola from metal | Prevents corrosion and metallic taste, and preserves flavor and carbonation during shelf life |
 |
Food-grade internal can coatings for soda and juice cans to protect product integrity | Maintains taste, prevents metal migration, and extends shelf life while enabling efficient filling |
 |
Uses internally coated aluminum cans for beer and partners on low-carbon can developments | Protects beer quality, supports shelf life, and sustainability goals via recyclable coated cans |
 |
Interior coatings for beer cans and external finishes/decorations for brand differentiation | Preserves flavor and carbonation; decorative coatings improve shelf appeal and tactile brand cues |
 |
Uses polymer linings in food and beverage cans to separate product from metal | Protects nutrients and taste, reduces corrosion, and addresses regulatory/consumer safety concerns |
Logos and trademarks shown above are the property of their respective owners. Their use here is for informational and illustrative purposes only.
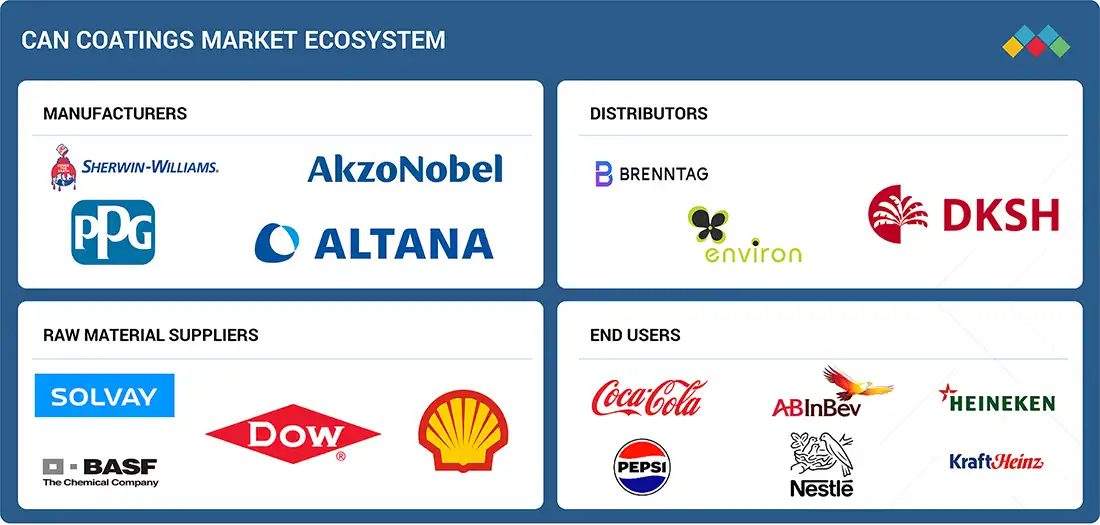
MARKET ECOSYSTEM
The can coatings market ecosystem involves identifying and analyzing interconnected relationships among various stakeholders, including raw material suppliers, manufacturers, distributors, and end users. Raw material suppliers are the source of raw materials for can coatings manufacturers. Manufacturers use technologies to produce can coatings. Distributors play a crucial role by facilitating contact between manufacturing companies and end users, focusing on optimizing the supply chain to enhance operational efficiency and profitability.
Logos and trademarks shown above are the property of their respective owners. Their use here is for informational and illustrative purposes only.
MARKET SEGMENTS
Source: Secondary Research, Interviews with Experts, MarketsandMarkets Analysis
Can Coatings Market, by Type
The polyester segment is projected to be the fastest-growing segment in the can coatings market. Polyester coatings are being applied increasingly, often in verticals where the purity and sensory qualities of the contents of the package are critically important. Polyester coatings differ from other alternatives that may carry flavor or aroma from the final product. These polyester formulations provide neutral and stable barriers to help protect the integrity of the products. Sensitivity is vital for high-sensitivity categories, such as infant nutrition, dairy, juices, and specialized beverages. When there is a problem around flavor, aroma, or safety, significant brand validity issues arise that will only lead to predictable performance solutions. Polyester coatings demonstrate superb resistance to product migrations and to participate in chemical reactions while providing a film that performs well and is safe, thus allowing for extended shelf life while not jeopardizing consumer expectations for high-quality consumer experiences. These products also exhibit extremely good performance with a range of product formulations to include acidic liquids to protein or other high meal formulations, thereby expanding their use category throughout the industry.
Can Coatings Market, by Application Type
The aerosol cans segment accounted for the third-largest share of the can coatings market in 2024. Aerosol cans are proving to be versatile-packaging medium in applications across multiple industries, such as cosmetics, personal care, household care, pharmaceutical, and automotive products. Each of these industries have their own unique chemical characteristics which brand owners must be aware of through careful technical management. Many of these formulations consist of lots of solvents and cleaners, alcohols, and oils in the case of cosmetics. These solvents/chemicals can easily attack metal and the unintended consequence of this occurs in the can – the result is contamination of the formulation/product, destabilization of the product, and safety concerns. Coatings serve as an invisible and effective shield and barrier, providing inert protection between the can contents and the metal itself. These coatings provide barriers and inhibit unwanted chemical reactions, so the formulation retains its structural characteristics, whether it be smell, functionality, or shelf life. Coatings built for specific formulations open doors for brand owners to expand their portfolios without the fear of material incompatibility. Coatings also stimulate innovation for companies, knowing that they can experiment with new formulations as coatings help initialize safety and preserve integrity.
REGION
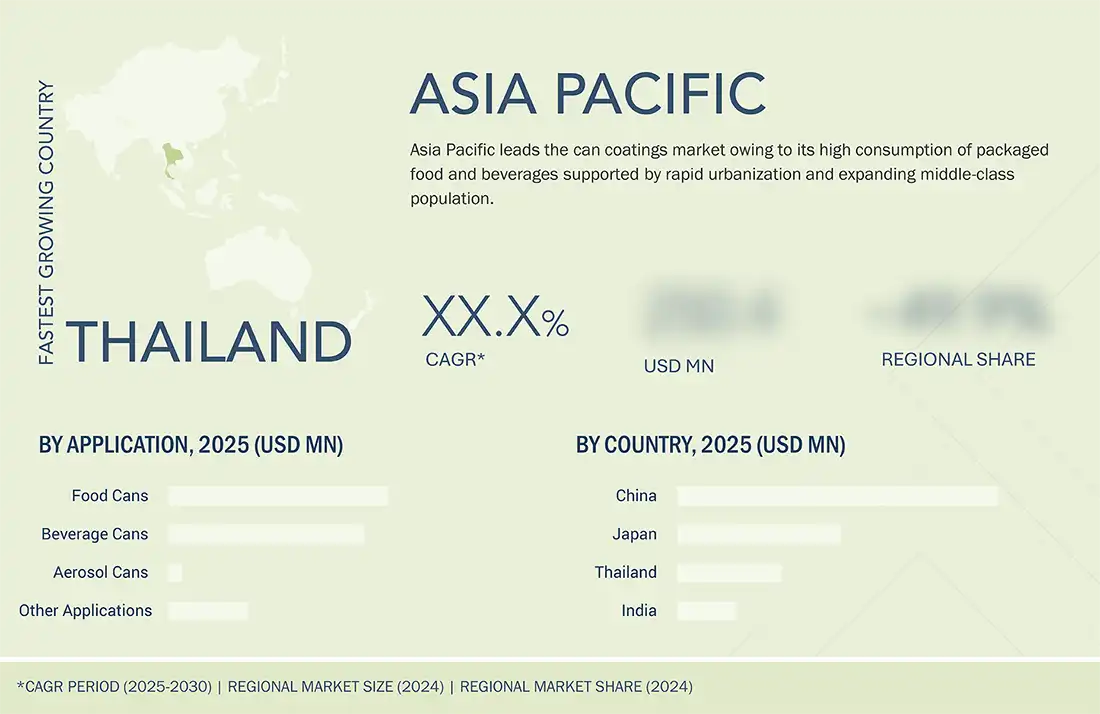
Asia Pacific is expected to account for largest share of can coatings market during forecast period
The Asia Pacific region is projected to be the largest market for can coatings from 2025 to 2030. It has established itself as a hub for can manufacturing, efficiently serving both local and international markets with significant volumes of beverage and food cans. The region's leadership comes from a combination of cost-effective labor, a highly efficient logistics network, and substantial production capacity, enabling manufacturers to achieve economies of scale. This allows them to offer consistently low prices without sacrificing quality, encouraging suppliers to maintain a steady global supply. Local producers are now focused on more than just large volumes; they have moved beyond the minimum capital investments of the past. Investments in new technologies, especially in advanced coatings that enhance durability, resistance, and safety, are underway. These coatings ensure cans retain integrity across varying climates and during long-distance shipping — a critical factor given the region’s strong export focus. Governments across the Asia Pacific are promoting industrial upgrades and urging manufacturers to adopt internationally recognized safety and quality standards. With well-established clusters in China, Japan, South Korea, and India, the region fosters collaboration and support that drive innovation and adaptability. This industrial ecosystem not only meets local demands but also solidifies Asia Pacific’s role as a trusted supplier, and unquestionably, the region will influence and shape the next era of the global can coatings market through scale, innovation, and strategic growth dependability.
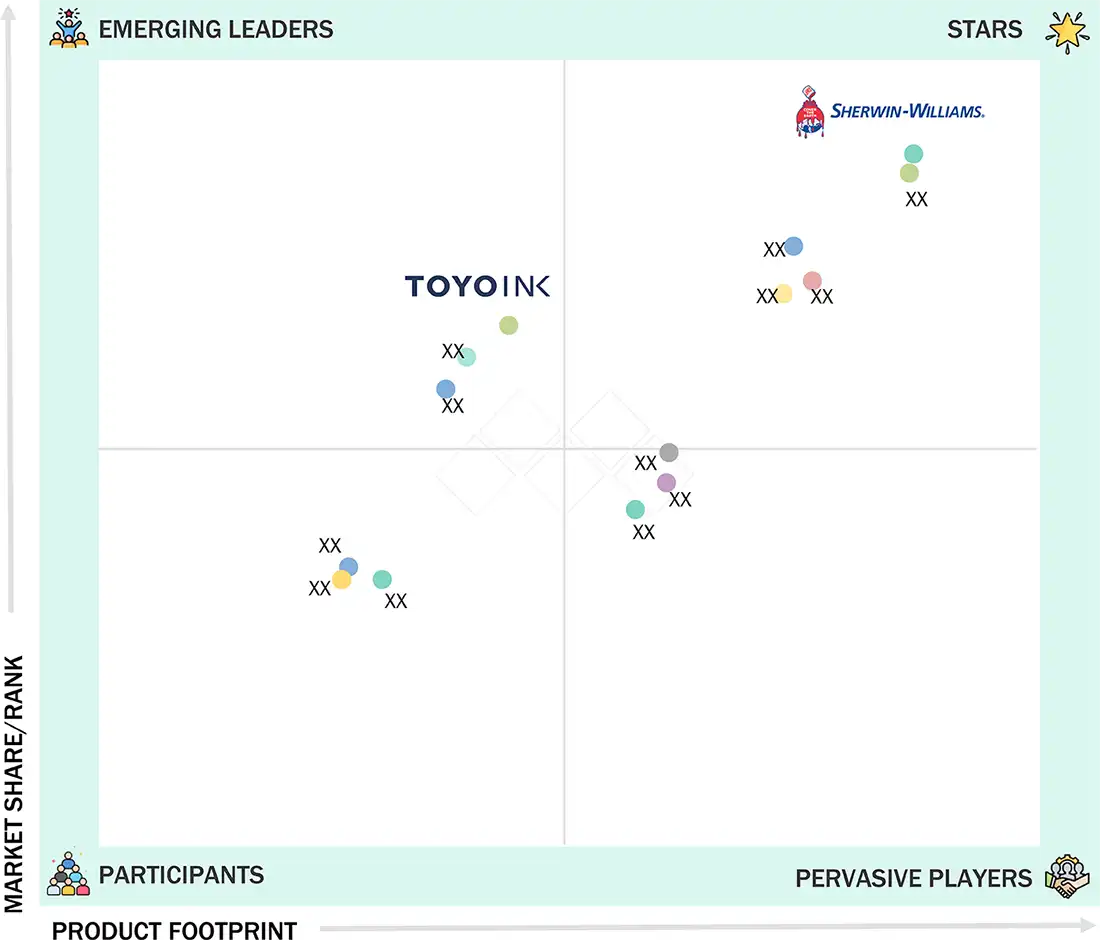
Can Coatings Market: COMPANY EVALUATION MATRIX
In the can coatings market matrix, Sherwin-Williams (Star) leads with a strong market presence and a wide product portfolio, driving large-scale adoption across the industry. Toyo Ink Groups (Emerging Leader) is gaining traction due to its diversified product portfolio, continuous investment in R&D, and focus on high-performance solutions. While Sherwin-Williams dominates with scale, Toyo Ink Groups shows strong growth potential to advance toward the leaders’ quadrant.
Source: Secondary Research, Interviews with Experts, MarketsandMarkets Analysis
KEY MARKET PLAYERS
MARKET SCOPE
| REPORT METRIC | DETAILS |
|---|---|
| Market Size in 2024 (Value) | USD 2.65 BN |
| Market Forecast in 2030 (Value) | USD 3.44 BN |
| Growth Rate | CAGR of 4.46% from 2025-2030 |
| Years Considered | 2020−2030 |
| Base Year | 2024 |
| Forecast Period | 2025−2030 |
| Units Considered | Value (USD Billion), Volume (Kiloton) |
| Report Coverage | Revenue forecast, company ranking, competitive landscape, growth factors, and trends |
| Segments Covered | • By Type: Epoxy, Polyester, Acrylic, and Other Types • By Application: Food Cans, Beverage Cans, Aerosol Cans, and Other Applications |
| Regions Covered | Asia Pacific, North America, Europe, South America, and Middle East & Africa |
WHAT IS IN IT FOR YOU: Can Coatings Market REPORT CONTENT GUIDE
DELIVERED CUSTOMIZATIONS
We have successfully delivered the following deep-dive customizations:
| CLIENT REQUEST | CUSTOMIZATION DELIVERED | VALUE ADDS |
|---|---|---|
| Europe -based Can Coatings Manufacturer | • Detailed Europe-based company profiles of competitors (financials, product portfolio) • Customer landscape mapping by end-use sector • Partnership ecosystem analysis | • Identify interconnections and supply chain blind spots • Detect customer migration trends across the industry • Highlight untapped customer clusters for market entry |
| Asia Pacific-based Can Coatings Manufacturer | • Global & regional production capacity benchmarking • Customer base profiling across the application industries | • Strengthen forward integration strategy • Identify high-demand customers for long-term supply contracts • Assess supply-demand gaps for competitive advantage |
RECENT DEVELOPMENTS
- July 2025 : PPG Industries, Inc. announced the global expansion of its BPA-NI (Bisphenol A-Non-Intent) easy-open end coatings for aluminum beverage cans.
- July 2024 : ALTANA AG acquired Silberline, a global manufacturer of effect pigments used in can coatings, further expanding ACTEGA’s product range and technical capabilities.
- May 2024 : The Sherwin-Williams Company expanded its Tournus, France site, supporting the manufacturing of coatings for food and beverage cans to meet increased European demand for sustainable can coatings.
- March 2024 : Kansai Paint Co., Ltd. entered a capital tie-up with Spiber Inc. to jointly develop new coating raw materials using artificial proteins.
- March 2023 : Toyo Ink Group concluded share purchase, acquiring Thai Eurocoat Ltd., the top manufacturer of external coatings for non-printed cans in Thailand, strengthening its position in the Asia Pacific canned food market.
Table of Contents
 Exclusive indicates content/data unique to MarketsandMarkets and not available with any competitors.
Methodology
The study involved four major activities in estimating the market size for can coatings. Exhaustive secondary research was done to collect information on the market, the peer market, and the parent market. The next step was to validate these findings, assumptions, and sizing with industry experts across the value chain through primary research. Both top-down and bottom-up approaches were employed to estimate the complete market size. After that, the market breakdown and data triangulation procedures were used to estimate the market size of the segments and subsegments.
Secondary Research
Secondary sources used in this study included annual reports, press releases, and investor presentations of companies; white papers; certified publications; articles from recognized authors; and gold standard & silver standard websites such as Factiva, ICIS, Bloomberg, and others. The findings of this study were verified through primary research by conducting extensive interviews with key officials such as CEOs, VPs, directors, and other executives.
Primary Research
The can coatings market comprises several stakeholders, such as raw material suppliers, end-product manufacturers, and regulatory organizations in the supply chain. The demand side of this market is characterized by key opinion leaders in various applications for the can coatings market. The supply side is characterized by advancements in technology and diverse application industries. Various primary sources from both the supply and demand sides of the market were interviewed to obtain qualitative and quantitative information.
The breakdown of profiles of the interviews with experts is illustrated in the figure below:

Note: Tier 1, Tier 2, and Tier 3 companies are classified based on their market revenue in 2023/2024, available in the public domain, product portfolios, and geographical presence.
Other designations include consultants and sales, marketing, and procurement managers.
To know about the assumptions considered for the study, download the pdf brochure
| COMPANY NAME | DESIGNATION | |
|---|---|---|
| The Sherwin-Williams | Senior Manager | |
| PPG Industries, Inc. | Innovation Manager | |
| Akzo Nobel N.V. | Vice President | |
| ALTANA AG | Production Supervisor | |
| Kansai Paint Co., Ltd. | Sales Manager | |
Market Size Estimation
Both top-down and bottom-up approaches were used to estimate and validate the total size of the can coatings market. These methods were also used extensively to estimate the size of various subsegments in the market. The research methodology used to estimate the market size included the following:
- The key players in the industry have been identified through extensive secondary research.
- The supply chain of the industry has been determined through primary and secondary research.
- All percentage shares, splits, and breakdowns have been determined using secondary sources and verified through interviews with experts.
- All possible parameters that affect the markets covered in this research study have been accounted for, viewed in extensive detail, verified through primary research, and analyzed to obtain the final quantitative and qualitative data.

Data Triangulation
After arriving at the overall market size using the market size estimation processes as explained above, the market was split into several segments and subsegments. To complete the overall market engineering process and arrive at the exact statistics of each market segment and subsegment, data triangulation, and market breakdown procedures were employed, wherever applicable. The data was triangulated by studying various factors and trends from both the demand and supply sides in the can coatings industry.
Market Definition
According to the American Coatings Association (ACA), can coating means any protective, decorative, or functional coating applied to a can, metal sheet, or can component specifically including applications like coating two-piece or three-piece cans, sheet coating lines, side-seam sprays, and sealing compounds.
Stakeholders
- Manufacturers, Dealers, Suppliers, and Manufacturers of Can Coatings and Their Raw Materials
- Manufacturers in Various End-use Industries
- Traders, Distributors, and Suppliers of Can Coatings
- Regional Manufacturers’ Associations and Can Coatings Associations
- Government and Regional Agencies and Research Organizations
Report Objectives
- To analyze and forecast the can coatings market in terms of value
- To provide detailed information about the key factors (drivers, restraints, opportunities, and challenges) influencing market growth
- To define, segment, and project the size of the global can coatings market based on type and application
- To project the market size for five main regions: North America, Europe, Asia Pacific, the Middle East & Africa, and South America, with their key countries
- To analyze the micromarkets1 concerning individual growth trends, prospects, and their contribution to the overall market
- To analyze opportunities in the market for stakeholders and provide a competitive landscape of the market leaders
- To track and analyze R&D and competitive developments such as expansions, product launches, collaborations, investments, partnerships, agreements, developments, collaborations, and mergers & acquisitions in the can coatings market
Key Questions Addressed by the Report
Who are the major players in the can coatings market?
Major players include The Sherwin-Williams (US), PPG Industries (US), Akzo Nobel N.V. (Netherlands), Kansai Paint Co., Ltd. (Japan), ALTANA AG (Germany), Toyo Ink Group (Japan), Suzhou 3N Packaging Coatings (China), Berger Paints (India), Tiger Coatings (Austria), and Salchi Metalcoat S.r.l. (Italy).
What are the drivers and opportunities for the can coatings market?
Key drivers include the shift from glass and plastic to aluminum, increased demand for clean-label beverages, and growth in flexible packaging. Opportunities lie in eco-friendly raw materials, BPA-NI coatings, and market expansion in emerging economies.
Which strategies are the key players focusing upon in the can coatings market?
Companies are focusing on product launches, mergers & acquisitions, strategic agreements, and capacity expansions to strengthen global presence.
What is the expected growth rate of the can coatings market between 2025 and 2030?
The market is expected to grow at a CAGR of 4.46% during the forecast period.
Which major factors are expected to restrain market growth during the forecast period?
Growth is likely to be hindered by stringent regulations on epoxy resins and bisphenol-A, as well as challenges in developing coatings suitable for multiple applications.
Need a Tailored Report?
Customize this report to your needs
Get 10% FREE Customization
Customize This ReportPersonalize This Research
- Triangulate with your Own Data
- Get Data as per your Format and Definition
- Gain a Deeper Dive on a Specific Application, Geography, Customer or Competitor
- Any level of Personalization
Let Us Help You
- What are the Known and Unknown Adjacencies Impacting the Can Coatings Market
- What will your New Revenue Sources be?
- Who will be your Top Customer; what will make them switch?
- Defend your Market Share or Win Competitors
- Get a Scorecard for Target Partners

Custom Market Research Services
We Will Customise The Research For You, In Case The Report Listed Above Does Not Meet With Your Requirements
Get 10% Free CustomisationTESTIMONIALS

We at Nissan Chemicals Corporation have been clients of MarketsandMarkets for more than a year now. We recently consulted MarketsandMarkets for a study, the team at MarketsandMarkets was extremely professional and organized. The business insights were very detailed and aligned well with our expectations that really helped us formulate the Business Plans and device new strategies for development themes. MarketsandMarkets offers a unique combination of expertise and dedicated engagement model. Their research findings have helped us in designing our Pricing Strategy which will make it easier for us to predict the future sales and profits for the next ten years. We look forward to working with MarketsandMarkets in the future.
VP of Strategy & New Business Development
Leading Specialty Chemical Company
The MarketsandMarkets Engagement Model, composed of both the Knowledge Store and advisory custom research, has greatly helped us in understanding our markets and making strategic decisions. The Knowledge Store is a fast way to allow everyone in our organization to understand more about most any market they are interested in. The ability to then get custom research done and get answers to specific strategic questions and market insight has been spectacular. The Markets and Markets team feel more like colleagues than vendors and their services have helped us change our culture where statements of things like growth opportunities and competitive position are always backed by industry research.

Rich Gibson,
Director, Corporate Strategy
Milliken & Company,
Leading Industrial Manufacturer of specialty chemical, floor covering, performance and protective textile materials, and healthcaremilliken.com
MarketsandMarkets is a trusted resource that helps us to better understand markets that are near-adjacencies-whether its technology, value chain or geography. Their Knowledge Store platform provides a dashboard of markets and their characteristics which is easy to use and saves us time.
Adam Shaw,
Market Development and Strategy Manager
AdvanSix Inc. USA,
An American Leader in Chemicalswww.advansix.com
The Knowledge Store from MarketsandMarkets is a valuable tool which has helped my team acquire greater insight in to the end markets that our business serves. This has enabled us to help our company build stronger strategies throughout our planning process.
TOSHIO KINOSHITA
Senior Chif Consultion Research & Consulting Division
Mitsubishi Chemical Research Corporation,
Leading Manufacturer of Chemical Productswww.mitsubishichem-res.co.jp/en/

We recently engaged with MarketsandMarkets for a study, the team not only clearly understood our business objectives but was also extremely professional in the way they handled the entire project. The study was efficiently conducted in a phase-wise manner, and the engagement model furnished us with high-quality business insights that far exceeded our expectations at each phase. We were especially happy that MarketsandMarkets could provide us with both, an English as well as a Japanese version of the study. A special thanks to the Analyst Team and Client Services Team, whose fluency in Japanese enhanced our comfort level, as we could converse with them in our preferred language.
Independent entrepreneurs
Arrow Precision
We approached MarketsandMarkets for study on Proppants Market, and their work exceeded our expectations. The study conducted was comprehensive and enabled us to view the market through the various dimensions. In addition, the team was extraordinarily responsive throughout the process and resolved our queries on time. I strongly recommend MarketsandMarkets and will certainly consider them for additional market assessments we will need in the future.
Global engineering company, Japan
Deputy Manager,
Strategic Planning OfficeThe high-quality insights shared by the MarketsandMarkets team helped us understand the pharmaceutical plant designers in a specific geography. It also captured the risks that we may likely face in communicating with our potential partners. The study would enable us identify partners, which would impact our future growth.


Growth opportunities and latent adjacency in Can Coatings Market