CBRN Defense Market by Type, End Use (Defense and Civil & Commercial), Equipment (Protective Wearables, Respiratory Systems, Detection & Monitoring Systems, Decontamination Systems, Simulators, Information Management Software) & Region (2021-2026)
[241 Pages Report] CBRN Defense market is projected to grow from USD 17.4 billion in 2021 to USD 22.2 billion by 2026, at a CAGR of 5.0% during the forecast period.
Chemical, Biological, Radiological, Nuclear, and high yield explosives defense solutions are the defense measures used by governments, armed forces, and first responders against CBRN threats by detection, identification, and prevention techniques. The CBRN defense market has evolved considerably owing to rising geopolitical tensions. The supply side of the market has witnessed the introduction of modern technologies such as virtual reality, augmented reality, and the Internet of Things (IoT). This market is expected to have exponential growth owing to the surge in demand for CBRN defense equipment across industries. Increased military spending globally is a major factor driving the market.
To know about the assumptions considered for the study, Request for Free Sample Report
COVID-19 Impact on the CBRN Defense Market
The COVID-19 pandemic has caused significant damage to the economic activities of countries across the world. The manufacturing of CBRN defense systems and solutions has not been impacted much. Disruptions in the supply chain have led to halts in manufacturing processes. The resumption of manufacturing activities depends on the level of COVID-19 exposure, the level at which manufacturing operations are running, and import-export regulations.
CBRN Defense Market Dynamics
Driver: Growing technological innovations
The rising geopolitical unrest is driving the demand for safety measures against possible threats across countries worldwide. Therefore, countries are focusing on technological innovations for defense against CBRN threats. With technological advanced solutions like simulators, better protective fabrics, and UAVs, there is growth in civil & commercial applications of CBRN defense equipment across industries. Research organizations have started working on nanotechnology and AI for better CBRN defense solutions and equipment.
Restraints: Lack of investment in research and development
Limited research and development in the field of chemical and biological threats have led to unpreparedness. For example, the unpreparedness for a biological threat is quite evident from the COVID-19 pandemic. Biowarfare readiness is not in place globally, and there are no standard operating procedures in place to deal with bio attacks in most countries. This can act as a major restraint in the growth of the market.
Opportunities: Rise in use of CBRN safety measures by emergency medical services
Emergency Medical Services (EMS) across the world have taken stringent steps in the area of CBRN defense to make patient safety their top priority. EMS is responsible to manage potential chemical disasters resulting from either industrial accidents or terrorist activities. For example, the Hazardous Substances Management Division, which is the nodal point within the Ministry for the Management of Chemical Emergencies and Hazardous Substances in India, has taken stringent steps in CBRN defense.
Decontamination is of primary importance while treating patients with chemical exposure, provided that the patients do not require immediate life-saving intervention. Every decontamination plan must include contingencies for the contamination sources within the hospital and evacuation drills. Devising a workable hazardous materials plan requires careful thought and often professional input from medical toxicologists, hazmat teams, and in some cases, industrial hygiene and safety officers. The use of a patient decontamination plan without altering it to meet the hospital requirements and without practice can result in undesirable outcomes. All first responders or emergency response teams for hazardous incidents must meet regulatory requirements for both training and response to hazardous materials, as they are likely to be presented someday with a chemically exposed patient who has not been decontaminated.
Challenges: Lack of sufficient funding
Since the CBRN defense industry is currently in its early stages in several regions, it requires considerable funding from the public and private sectors for the development of effective countermeasures against potential threats.
One of the key issues being faced by the CBRN industry is to develop technically advanced and cost-effective prototypes that can be put into mass production without any difficulty. A major impact of insufficient funding is currently being felt in developing advanced protective suits to counter advanced and ever-changing threats while simultaneously ensuring that the suits are light in weight to minimize the physical load for the wearer. A number of companies are trying to find a balance between a generic outfit and a highly technological garment. These innovations require significant funding, although with the global economy only just beginning to recover from imbalances and defense budgets being cut, companies in the CBRN industry are under immense pressure to obtain the required funding.
Favorable regulations and international agreements
Favorable regulations and agreements are driving the CBRN market. The US Department of Homeland Securitys National Strategy for CBRN standards focuses on collaboration with private players and research organizations for better utilization and response for research and development and testing of CBRN defense solutions. It also focuses on standards, training, and standard operating procedures for CBRN defense equipment. NATO’s Comprehensive and Strategic Level Policy also focuses on capability enhancements and delivery systems. EU CBRN action plan focuses on regional and international partnerships for preparing a robust system and increasing preparedness against CBRN threats.
Based on Type, chemical segment is estimated to witness the largest share of the CBRN Defense market from 2021 to 2026.
Based on type, chemical segment of the CBRN Defense market is estimated to held the dominant market share in 2021. The chemical defense segment includes detection, identification, and protective equipment used against chemical agents such as Toxic Industrial Chemicals (TIC), Toxic Industrial Materials (TIM), and Chemical War Agents (CWA). The protective equipment used for CBRN defense includes protective wearables such as hazmat suits, gas masks, gloves, and footwear. Equipment such as portable devices and laboratory test instruments are used for the detection of chemical agents. Due to increase in chemical warfare threats globally, will drive this segment.
For instance, in December 2021, U.S. Defense Threat Reduction Agency’s Joint Science and Technology Office awarded an contract worth USD 15.7 million to Teledyne FLIR to develop augmented reality software that can pinpoint chemical threats and map them for the military.
Based on Equipment, the protective wearables segment of the CBRN Defense market is projected to witness the largest share in 2021.
Based on equipment, protective wearables segment is projected to lead the CBRN Defense market during the forecast period. Protective wearables provide protection against CBRN threats. The protective wearables include protective clothing, protective gas mask and hoods, escape devices, protective shoes, and protective gloves. The main users of CBRN defense equipment include first responders in the police, fire safety department, and hazmat safety officers in the commercial and civil sectors. Military users include CBRN response teams in the armed forces. The level and contamination determine which type of CBRN protective wearable can be used. This segment is leading due to fully integrated Mopp-4 suit for the highest chemical and biological threat protection, wide industrial application, and advancement in technology.
Based on end use, defense segment is estimated to account for the largest share of the CBRN Defense market from 2021 to 2026.
Based on end use, defense segment is estimated to account for the largest share of the CBRN Defense during the forecast period. The defense segment includes military and homeland security. Military users include the army, navy, and air force. The CBRN defense equipment used by the defense segment includes protective wearables, detection equipment, and decontamination systems. Homeland security personnel using CBRN defense equipment comprises first responders in the police, fire safety departments, and hazmat safety officers. The defense segment in Asia Pacific is projected to grow at the highest CAGR during the forecast period.
The Asia Pacific market is projected to contribute the largest share from 2021 to 2026 in the CBRN Defense market
Based on region, Asia Pacific is expected to lead the CBRN Defense market from 2021 to 2026 in terms of market share. An increase in the instances of terror attacks in the Asia Pacific region has led countries of the region to enhance their CBRN defense capabilities. In addition, the increase in defense expenditures of India and China, among others, and the expansion of military commands in emerging economies have accelerated the demand for CBRN Defense in the Asia Pacific region. The demand for CBRN defense solutions can be attributed to the increasing investments by countries for the development and procurement of advanced CBRN defense solutions for their armed forces, border protection, biowarfare programs.
To know about the assumptions considered for the study, download the pdf brochure
Key Market Players
CBRN Defense market is dominated by a few globally established players such as Rheinmetall Defence (Germany), Smiths Group PLC (UK), Teledyne FLIR LLC (US), Bruker Corporation (US), and Chemring Group PLC (UK), among others, are the key manufacturers that secured CBRN Defense contracts in the last few years. Major focus was given to the contracts and new product development due to increase in the demand for CBRN Defense equipments and the growth of emerging markets have encouraged companies to adopt this strategy to enter new markets.
Scope of the Repor
Report Metric |
Details |
Market size available for years |
2019–2026 |
Base year considered |
2020 |
Forecast period |
2021-2026 |
Forecast units |
Value (USD Million) |
Segments covered |
By type, by end use, by equipment, and by region |
Geographies covered |
North America, Europe, Asia Pacific, Middle East and Rest of the World |
Companies covered |
Rheinmetall Defence (Germany), Smiths Group PLC (UK), Teledyne FLIR LLC (US), Bruker Corporation (US), and Chemring Group PLC (UK) are some of the major players of CBRN Defense market. (25 Companies) |
The study categorizes the CBRN Defense market based on type, equipment, end use, and region.
By Type
- Chemical
- Biological
- Radiological
- Nuclear
- Explosive
By Equipment
-
Protective Wearables
- OSHA guidelines on usage of protective wearables
- Protective clothing
- Protective gas mask and hoods
- Escape devices/hoods
- Protective shoes
- Protective gloves
-
Respiratory Systems
- Self contained breathing apparatus (SCBA)
- Powered air purifying respirator (PAPR)
-
Detection & Monitoring Systems
- Thermal imagers
- Sensors
- Stationary and mobile monitoring devices
- Sampling equipment
- Screening test kit
- Infrared spectroscopy
- Beacon
- Stand-off detectors
- Gas detectors
- Biological threat detectors
- Radiological threat detectors
-
Decontamination Systems
- Contamination indicator decontamination assurance systems (CIDAS)
- Spray unit
- Others
- Simulators
- Information Management Software
By End Use
-
Defense
-
Armed Forces
- Air force
- Army
- Navy
- Others
-
Homeland Security
- Police
- Fire safety department
-
Civil & Commercial
- Critical infrastructure
- Medical
- Industrial
-
Armed Forces
By Region
- North America
- Europe
- Asia Pacific
- Middle East
- Rest of the World
Recent Developments
- In December 2021, Cubic Defense Australia won a 14-year contract for providing training through simulations.
- In December 2021, Environics (Finland) received an order for Finnish maritime forces for CBRN monitoring systems to be installed in 21 vessels.
- In November 2021, Environics (Finland) Oy signed a contract with VARD, a Norwegian Shipbuilder, for 3 CRN detection systems to be delivered by 2023.
- In November 2021, Cubic Mission and Performance Solutions was awarded a two-year contract for providing simulation support for weapon training.
- In November 2021, Chemring (UK) Sensors and Electronics was awarded a contract for the development of the Enhanced Biological Detection program at full rate product at a contract value of USD 99 million.
- In November 2021, MSA Safety (US) signed a contract worth USD 4 million with the US Department of Health and Human Services for producing elastomeric air-purifying respirators for the national stockpile. The product will be produced by subsidiary MSA LLC
- In November 2021, Smiths Detection, a subsidiary of Smiths Group (UK) PLC, signed a contract with TSA worth USD 20 million for supplying CTX 9800 Explosive Detection system for baggage screening at airport terminals.
- In November 2021, Smiths Detection won a contract for supplying 110 radiation portal monitors to the US Department of Homeland security. The monitors will be deployed along with the land border crossings.
- In September 2021, Chemring (UK) received a contract modification worth USD 20 million in addition to the USD 22 million contract for the supply of MJU-68/B infrared countermeasures for the F-35 programme.
- In September 2020, Nexter (France) won a contract for supplying 52 CAESAR, self-propelled artillery guns to Czech Republic Defense forces.
Frequently Asked Questions (FAQ):
Which are the major companies in the CBRN Defense market? What are their major strategies to strengthen their market presence?
The CBRN Defense market is dominated by a few globally established players such as Rheinmetall Defence (Germany), Smiths Group PLC (UK), Teledyne FLIR LLC (US), Bruker Corporation (US), and Chemring Group PLC (UK), among others, are the key manufacturers that secured CBRN Defense contracts in the last few years. Contracts was the key strategies adopted by these companies to strengthen their CBRN Defense market presence.
What are the drivers and opportunities for the CBRN Defense market?
The market for CBRN Defense has grown substantially across the globe, and especially in Asia Pacific, where increase in developing new technologies in such as China, India, and South Korea, will offer several opportunities for CBRN Defense industry companies. The growing technological innovations to develop CBRN Defense are also expected to boost the growth of the market around the world.
North America and Europe are key developer of CBRN Defense as most key manufacturers and leading players in this market are based in these regions. Some of these manufacturers are Rheinmetall Defence (Germany), Smiths Group PLC (UK), Teledyne FLIR LLC (US), Bruker Corporation (US), and Chemring Group PLC (UK).
Which region is expected to grow at the highest rate in the next five years?
The market in Asia Pacific is projected to grow at the highest CAGR of from 2021 to 2026, showcasing strong demand from CBRN Defense in the region. An increase in the instances of terror attacks in the Asia Pacific region has led countries of the region to enhance their CBRN Defense capabilities. In addition, the increase in defense expenditures of India and China, among others, and the expansion of military commands in emerging economies have accelerated the demand for CBRN Defense in the Asia Pacific region.
Which are the key technology trends prevailing in the CBRN Defense market?
Virtual reality and augmented reality-based simulation training, Remote sensing for detection and identification of CBRN threats, Wearable technology for detecting CBRN threats, IoT-based CBRN solution, Ion-mobility spectrometry, and other chemical detection technologies. .
To know about the assumptions considered for the study, download the pdf brochure
TABLE OF CONTENTS
1 INTRODUCTION (Page No. - 31)
1.1 OBJECTIVES OF THE STUDY
1.2 MARKET DEFINITION
1.3 STUDY SCOPE
1.3.1 MARKETS COVERED
FIGURE 1 CBRN DEFENSE MARKET SEGMENTATION
1.3.2 REGIONAL SCOPE
1.3.3 YEARS CONSIDERED FOR THE STUDY
1.4 CURRENCY & PRICING
1.5 USD EXCHANGE RATES
1.6 LIMITATIONS
1.7 INCLUSIONS & EXCLUSIONS
1.8 SUMMARY OF CHANGES MADE
FIGURE 2 CBRN DEFENSE MARKET TO GROW AT SIMILAR RATE COMPARED TO PREVIOUS ESTIMATES
1.9 STAKEHOLDERS
2 RESEARCH METHODOLOGY (Page No. - 36)
2.1 RESEARCH DATA
FIGURE 3 RESEARCH FLOW
FIGURE 4 CBRN MARKET: RESEARCH DESIGN
2.1.1 SECONDARY DATA
2.1.1.1 Key data from secondary sources
2.1.2 PRIMARY DATA
2.1.2.1 Key data from primary sources
2.1.2.2 Key insights from primary sources
2.1.2.3 Breakdown of primaries
FIGURE 5 BREAKDOWN OF PRIMARY INTERVIEWS: BY COMPANY TYPE, DESIGNATION, AND REGION
2.2 FACTOR ANALYSIS
2.2.1 INTRODUCTION
2.2.2 DEMAND-SIDE INDICATORS
2.2.2.1 Political dissent and separatists’ movements
2.2.2.2 Adoption of cloud computing technologies in public safety industry
2.2.3 SUPPLY-SIDE INDICATORS
2.3 MARKET SIZE ESTIMATION
2.4 RESEARCH APPROACH & METHODOLOGY
2.4.1 BOTTOM-UP APPROACH
FIGURE 6 MARKET SIZE ESTIMATION METHODOLOGY: BOTTOM-UP APPROACH
2.4.2 TOP-DOWN APPROACH
FIGURE 7 MARKET SIZE ESTIMATION METHODOLOGY: TOP-DOWN APPROACH
2.5 MARKET BREAKDOWN & DATA TRIANGULATION
FIGURE 8 DATA TRIANGULATION
2.6 RESEARCH ASSUMPTIONS
2.7 RISK ANALYSIS
3 EXECUTIVE SUMMARY (Page No. - 46)
FIGURE 9 CHEMICAL SEGMENT ACCOUNTED FOR LARGEST SHARE OF MARKET IN 2021
FIGURE 10 PROTECTIVE WEARABLES SEGMENT ACOOUNTED FOR LARGEST SHARE OF MARKET IN 2021
FIGURE 11 DEFENSE SEGMENT TO LEAD MARKET FOR CBRN DEFENSE DURING FORECAST PERIOD
FIGURE 12 ASIA PACIFIC ACCOUNTED FOR LARGEST SHARE OF CBRN DEFENSE MARKET IN 2021
4 PREMIUM INSIGHTS (Page No. - 50)
4.1 ATTRACTIVE GROWTH OPPORTUNITIES IN CBRN DEFENSE MARKET
FIGURE 13 RISE IN USAGE OF PORTABLE SOLUTIONS ACROSS INDUSTRIES DRIVES MARKET GROWTH
4.2 CBRN DEFENSE MARKET, BY TYPE
FIGURE 14 CHEMICAL SEGMENT EXPECTED TO LEAD MARKET FROM 2021-2026
4.3 CBRN DEFENSE MARKET, BY EQUIPMENT
FIGURE 15 PROTECTIVE WEARABLES SEGMENT PROJECTED TO LEAD MARKET DURING FORECAST PERIOD
4.4 CBRN DEFENSE MARKET, BY COUNTRY
FIGURE 16 CBRN DEFENSE MARKET IN INDIA PROJECTED TO GROW AT HIGHEST CAGR DURING FORECAST PERIOD
5 MARKET OVERVIEW (Page No. - 52)
5.1 INTRODUCTION
5.2 MARKET DYNAMICS
FIGURE 17 CBRN DEFENSE MARKET: DRIVERS, RESTRAINTS, OPPORTUNITIES, AND CHALLENGES
5.2.1 DRIVERS
5.2.1.1 Increased defense spending globally
FIGURE 18 GLOBAL MILITARY SPENDING: 2001 TO 2020
5.2.1.2 Growing technological innovations
5.2.1.3 Favorable regulations and international agreements
5.2.1.4 Ease of availability of CBRN weapons
5.2.2 RESTRAINTS
5.2.2.1 Lack of investment in research and development
5.2.2.2 Saturated market in developed countries
5.2.3 OPPORTUNITIES
5.2.3.1 Rise in use of CBRN safety measures by emergency medical services
5.2.3.2 Emerging markets in Southeast Asia
5.2.3.3 Lack of adequate training
5.2.4 CHALLENGES
5.2.4.1 Recovery from pandemic
5.2.4.2 Lack of sufficient funding
5.3 IMPACT OF COVID-19 ON CBRN DEFENSE MARKET
FIGURE 19 IMPACT OF COVID-19 ON CBRN DEFENSE MARKET
5.3.1 DEMAND-SIDE IMPACT
5.3.1.1 Key developments from January 2018 to December 2021
TABLE 1 KEY DEVELOPMENTS IN CBRN DEFENSE MARKET, 2018-2021
5.3.2 SUPPLY-SIDE IMPACT
5.3.2.1 Key developments from January 2018 to December 2021
TABLE 2 KEY DEVELOPMENTS IN CBRN DEFENSE MARKET, 2018-2021
5.4 RANGES AND SCENARIOS
FIGURE 20 IMPACT OF COVID-19 ON CBRN DEFENSE MARKET: 3 GLOBAL SCENARIOS
5.5 VALUE CHAIN ANALYSIS OF CBRN DEFENSE MARKET
FIGURE 21 VALUE CHAIN ANALYSIS
5.6 TRENDS/DISRUPTION IMPACTING CUSTOMER BUSINESS
5.6.1 REVENUE SHIFT AND NEW REVENUE POCKETS FOR CBRN DEFENSE MANUFACTURERS
FIGURE 22 REVENUE SHIFT FOR CBRN DEFENSE MARKET PLAYERS
5.7 CBRN DEFENSE MARKET ECOSYSTEM
5.7.1 PROMINENT COMPANIES
5.7.2 PRIVATE AND SMALL ENTERPRISES
5.7.3 MARKET ECOSYSTEM
FIGURE 23 MARKET ECOSYSTEM MAP: CBRN DEFENSE MARKET
TABLE 3 CBRN DEFENSE MARKET ECOSYSTEM
5.8 AVERAGE SELLING PRICE OF CBRN DEFENSE SOLUTIONS
TABLE 4 AVERAGE SELLING PRICE TRENDS OF CBRN DEFENSE SOLUTIONS, 2020)
5.9 PORTER’S FIVE FORCES ANALYSIS
TABLE 5 CBRN DEFENSE: PORTER’S FIVE FORCE ANALYSIS
5.9.1 THREAT OF NEW ENTRANTS
5.9.2 THREAT OF SUBSTITUTES
5.9.3 BARGAINING POWER OF SUPPLIERS
5.9.4 BARGAINING POWER OF BUYERS
5.9.5 INTENSITY OF COMPETITIVE RIVALRY
5.10 TRADE DATA STATISTICS
5.10.1 IMPORT DATA STATISTICS
TABLE 6 IMPORT VALUE OF BREATHING APPLIANCES AND GAS MASKS, EXCLUDING PROTECTIVE MASKS HAVING NEITHER MECHANICAL PARTS NOR REPLACEABLE FILTERS (PRODUCT HARMONIZED SYSTEM CODE: 902000) (USD THOUSAND)
TABLE 7 IMPORT VALUE OF GAS OR SMOKE ANALYSIS APPARATUS (PRODUCT HARMONIZED SYSTEM CODE: 902710) (USD THOUSAND)
5.10.2 EXPORT DATA STATISTICS
TABLE 8 EXPORT VALUE OF BREATHING APPLIANCES AND GAS MASKS, EXCLUDING PROTECTIVE MASKS HAVING NEITHER MECHANICAL PARTS NOR REPLACEABLE FILTERS (PRODUCT HARMONIZED SYSTEM CODE: 902000) (USD THOUSAND)
TABLE 9 EXPORT VALUE OF GAS OR SMOKE ANALYSIS APPARATUS (PRODUCT HARMONIZED SYSTEM CODE: 902710) (USD THOUSAND)
5.11 REGULATORY LANDSCAPE
5.11.1 NORTH AMERICA
5.11.2 EUROPE
6 INDUSTRY TRENDS (Page No. - 71)
6.1 INTRODUCTION
6.2 TECHNOLOGY TRENDS
6.2.1 VIRTUAL REALITY AND AUGMENTED REALITY-BASED SIMULATION TRAINING
6.2.2 REMOTE SENSING FOR DETECTION AND IDENTIFICATION OF CBRN THREATS
6.2.3 WEARABLE TECHNOLOGY FOR DETECTING CBRN THREATS
6.2.4 IOT-BASED CBRN SOLUTION
6.2.5 ION-MOBILITY SPECTROMETRY
6.2.6 OTHER CHEMICAL DETECTION TECHNOLOGIES
6.3 TECHNOLOGY ANALYSIS
6.4 USE CASE ANALYSIS
6.4.1 USE CASE: EU-SENSE SYSTEM FOR CBRN THREAT DETECTION
6.5 IMPACT OF MEGATRENDS
6.5.1 NANOTECHNOLOGY FOR CBRN DEFENSE
6.5.2 ARTIFICIAL INTELLIGENCE IN CBRN DETECTION AND IDENTIFICATION
6.5.3 UNMANNED AIR VEHICLES IN CBRN DEFENSE
6.6 INNOVATIONS AND PATENT REGISTRATIONS
7 CBRN DEFENSE MARKET, BY TYPE (Page No. - 76)
7.1 INTRODUCTION
FIGURE 24 CHEMICAL SEGMENT TO LEAD MARKET DURING FORECAST PERIOD
TABLE 10 CBRN DEFENSE MARKET, BY TYPE, 2018–2020 (USD MILLION)
TABLE 11 CBRN DEFENSE MARKET, BY TYPE, 2021–2026 (USD MILLION)
7.2 CHEMICAL
TABLE 12 CHEMICAL DEFENSE MARKET, BY REGION, 2018–2020 (USD MILLION)
TABLE 13 CHEMICAL DEFENSE MARKET, BY REGION, 2021–2026 (USD MILLION)
7.3 BIOLOGICAL
TABLE 14 BIOLOGICAL DEFENSE MARKET, BY REGION, 2018–2020 (USD MILLION)
TABLE 15 BIOLOGICAL DEFENSE MARKET, BY REGION, 2021–2026 (USD MILLION)
7.4 RADIOLOGICAL
TABLE 16 RADIOLOGICAL DEFENSE MARKET, BY REGION, 2018–2020 (USD MILLION)
TABLE 17 RADIOLOGICAL DEFENSE MARKET, BY REGION, 2021–2026 (USD MILLION)
7.5 NUCLEAR
TABLE 18 NUCLEAR DEFENSE MARKET, BY REGION, 2018–2020 (USD MILLION)
TABLE 19 NUCLEAR DEFENSE MARKET, BY REGION, 2021–2026 (USD MILLION)
7.6 EXPLOSIVE
TABLE 20 EXPLOSIVE DEFENSE MARKET, BY REGION, 2018–2020 (USD MILLION)
TABLE 21 EXPLOSIVE DEFENSE MARKET, BY REGION, 2021–2026 (USD MILLION)
8 CBRN DEFENSE MARKET, BY EQUIPMENT (Page No. - 83)
8.1 INTRODUCTION
FIGURE 25 THE PROTECTIVE WEARABLES SEGMENT TO COMMAND THE LARGEST MARKET SIZE DURING THE FORECAST PERIOD
TABLE 22 CBRN DEFENSE MARKET, BY EQUIPMENT, 2018–2020 (USD MILLION)
TABLE 23 CBRN DEFENSE MARKET, BY EQUIPMENT, 2021–2026 (USD MILLION)
8.2 PROTECTIVE WEARABLES
TABLE 24 PROTECTIVE WEARABLES MARKET, BY REGION, 2018–2020 (USD MILLION)
TABLE 25 PROTECTIVE WEARABLES MARKET, BY REGION, 2021–2026 (USD MILLION)
8.2.1 OSHA GUIDELINES ON USAGE OF PROTECTIVE WEARABLES
8.2.2 PROTECTIVE CLOTHING
8.2.2.1 Biological warfare threats drive the segment
8.2.3 PROTECTIVE GAS MASK AND HOODS
8.2.3.1 Wide industrial application drive segment
8.2.4 ESCAPE DEVICES/HOODS
8.2.4.1 Technological advancements boost this segment
8.2.5 PROTECTIVE SHOES
8.2.5.1 Wide civil and commercial applications drive demand for protective shoes
8.2.6 PROTECTIVE GLOVES
8.2.6.1 Chemical warfare threats drive this segment
8.3 RESPIRATORY SYSTEMS
TABLE 26 RESPIRATORY SYSTEMS MARKET, BY REGION, 2018–2020 (USD MILLION)
TABLE 27 RESPIRATORY SYSTEMS MARKET, BY REGION, 2021–2026 (USD MILLION)
8.3.1 SELF-CONTAINED BREATHING APPARATUS (SCBA)
8.3.1.1 Increasing industrial pollution and contamination to drive this segment
8.3.2 POWERED AIR-PURIFYING RESPIRATOR (PAPR)
8.3.2.1 Increasing healthcare usage to fuel growth of this segment
8.4 DETECTION AND MONITORING SYSTEMS
TABLE 28 DETECTION & MONITORING MARKET, BY REGION, 2018–2020 (USD MILLION)
TABLE 29 DETECTION & MONITORING MARKET, BY REGION, 2021–2026 (USD MILLION)
8.4.1 THERMAL IMAGERS
8.4.1.1 Increasing demand for thermal imagers for security and surveillance will drive segment
8.4.2 SENSORS
8.4.2.1 Changing geopolitical scenarios fuel segment growth
8.4.3 STATIONARY AND MOBILE MONITORING DEVICES
8.4.3.1 Increasing adoption of CBRN reconnaissance vehicles and laboratories drive segment
8.4.4 SAMPLING EQUIPMENT
8.4.4.1 Increasing research and development drive segment
8.4.5 SCREENING TEST KIT
8.4.5.1 Increased testing and detection of threats drive segment
8.4.6 INFRARED SPECTROSCOPY
8.4.6.1 Reduced risks associated with infrared spectroscopy drive its demand
8.4.7 BEACON
8.4.7.1 Increased adoption by first responders and armed forces drive segment
8.4.8 STAND-OFF DETECTORS
8.4.8.1 Rising military applications fuel segment growth
8.4.9 GAS DETECTORS
8.4.9.1 Industrial applications drive demand for gas detectors
8.4.10 BIOLOGICAL THREAT DETECTORS
8.4.10.1 Precautionary measures against biowarfare attacks drive segment growth
8.4.11 RADIOLOGICAL THREAT DETECTORS
8.4.11.1 Wide application of advanced radiological threat detection systems drive segment
8.5 DECONTAMINATION SYSTEMS
TABLE 30 DECONTAMINATION SYSTEMS MARKET, BY REGION, 2018–2020 (USD MILLION)
TABLE 31 DECONTAMINATION SYSTEMS MARKET, BY REGION, 2021–2026 (USD MILLION)
8.5.1 CONTAMINATION INDICATOR DECONTAMINATION ASSURANCE SYSTEMS
8.5.1.1 Military applications to drive segment
8.5.2 SPRAY UNITS
8.5.2.1 Increasing demand for portable decontamination systems drive segment growth
8.5.3 OTHERS
8.6 SIMULATORS
8.6.1 INCREASING DEMAND FOR VIRTUAL TRAINING AGAINST CBRN THREATS WILL DRIVE THE SEGMENT
TABLE 32 SIMULATORS MARKET, BY REGION, 2018–2020 (USD MILLION)
TABLE 33 SIMULATORS MARKET, BY REGION, 2021–2026 (USD MILLION)
8.7 INFORMATION MANAGEMENT SOFTWARE
8.7.1 INCREASED MONITORING, CONTROL, AND ANALYSIS OF CBRN THREATS WILL DRIVE THIS SEGMENT
TABLE 34 INFORMATION MANAGEMENT SOFTWARE MARKET, BY REGION, 2018–2020 (USD MILLION)
TABLE 35 INFORMATION MANAGEMENT SOFTWARE MARKET, BY REGION, 2021–2026 (USD MILLION)
9 CBRN DEFENSE MARKET, BY END USER (Page No. - 95)
9.1 INTRODUCTION
FIGURE 26 DEFENSE SEGMENT TO LEAD LARGEST MARKET DURING FORECAST PERIOD
TABLE 36 CBRN DEFENSE MARKET, BY END USER, 2018–2020 (USD MILLION)
TABLE 37 CBRN DEFENSE MARKET, BY END USER, 2021–2026 (USD MILLION)
9.2 DEFENSE
TABLE 38 DEFENSE: CBRN DEFENSE MARKET, BY REGION, 2018–2020 (USD MILLION)
TABLE 39 DEFENSE: CBRN DEFENSE MARKET, BY REGION, 2021–2026 (USD MILLION)
9.2.1 ARMED FORCES
9.2.1.1 Reconnaissance and surveillance of CBRN warfare threats will drive segment
9.2.1.2 Air force
9.2.1.3 Army
9.2.1.4 Navy
9.2.1.5 Others
9.2.2 HOMELAND SECURITY
9.2.2.1 Increased use for detection of CBRNE contamination drive segment
9.2.2.2 Police
9.2.2.3 Fire safety department
9.3 CIVIL & COMMERCIAL
TABLE 40 CIVIL & COMMERCIAL: CBRN DEFENSE MARKET, BY REGION, 2018–2020 (USD MILLION)
TABLE 41 CIVIL & COMMERCIAL: CBRN DEFENSE MARKET, BY REGION, 2021–2026 (USD MILLION)
9.3.1 CRITICAL INFRASTRUCTURE
9.3.1.1 Infrastructural protection from CBRNE attacks boost this segment
9.3.2 MEDICAL
9.3.2.1 Growing investments for new equipment for protection from CBRN threats will drive medical segment
9.3.3 INDUSTRIAL
9.3.3.1 Increasing usage of protective wearables will drive this segment
10 REGIONAL ANALYSIS (Page No. - 100)
10.1 INTRODUCTION
FIGURE 27 CBRN DEFENSE MARKET IN ASIA PACIFIC PROJECTED TO GROW AT HIGHEST RATE FROM 2021 TO 2026
TABLE 42 CBRN DEFENSE MARKET, BY TYPE, 2018–2020 (USD MILLION)
TABLE 43 CBRN DEFENSE MARKET, BY TYPE, 2021–2026 (USD MILLION)
TABLE 44 CBRN DEFENSE MARKET, BY EQUIPMENT, 2018–2020 (USD MILLION)
TABLE 45 CBRN DEFENSE MARKET, BY EQUIPMENT, 2021–2026 (USD MILLION)
TABLE 46 CBRN DEFENSE MARKET, BY END USER, 2018–2020 (USD MILLION)
TABLE 47 CBRN DEFENSE MARKET, BY END USER, 2021–2026 (USD MILLION)
TABLE 48 CBRN DEFENSE MARKET, BY REGION, 2018–2020 (USD MILLION)
TABLE 49 CBRN DEFENSE MARKET, BY REGION, 2021–2026 (USD MILLION)
10.2 NORTH AMERICA
10.2.1 COVID-19 IMPACT ON NORTH AMERICA
10.2.2 PESTLE ANALYSIS: NORTH AMERICA
FIGURE 28 NORTH AMERICA CBRN DEFENSE MARKET SNAPSHOT
TABLE 50 NORTH AMERICA: CBRN DEFENSE MARKET, BY TYPE, 2018–2020 (USD MILLION)
TABLE 51 NORTH AMERICA: CBRN DEFENSE MARKET, BY TYPE, 2021–2026 (USD MILLION)
TABLE 52 NORTH AMERICA: CBRN DEFENSE MARKET, BY EQUIPMENT, 2018–2020 (USD MILLION)
TABLE 53 NORTH AMERICA: CBRN DEFENSE MARKET, BY EQUIPMENT, 2021–2026 (USD MILLION)
TABLE 54 NORTH AMERICA: CBRN DEFENSE MARKET, BY END USER, 2018–2020 (USD MILLION)
TABLE 55 NORTH AMERICA: CBRN DEFENSE MARKET, BY END USER, 2021–2026 (USD MILLION)
TABLE 56 NORTH AMERICA: CBRN DEFENSE MARKET, BY COUNTRY, 2018–2020 (USD MILLION)
TABLE 57 NORTH AMERICA: CBRN DEFENSE MARKET, BY COUNTRY, 2021–2026 (USD MILLION)
10.2.3 US
10.2.3.1 Adoption of safety measures to protect armed forces and high military budget to drive market
TABLE 58 US: CBRN DEFENSE MARKET, BY TYPE, 2018–2020 (USD MILLION)
TABLE 59 US: CBRN DEFENSE MARKET, BY TYPE, 2021–2026 (USD MILLION)
TABLE 60 US: CBRN DEFENSE MARKET, BY END USER, 2018–2020 (USD MILLION)
TABLE 61 US: CBRN DEFENSE MARKET, BY END USER, 2021–2026 (USD MILLION)
10.2.4 CANADA
10.2.4.1 Increasing R&D expenditure in development projects to drive market
TABLE 62 CANADA: CBRN DEFENSE MARKET, BY TYPE, 2018–2020 (USD MILLION)
TABLE 63 CANADA: CBRN DEFENSE MARKET, BY TYPE, 2021–2026 (USD MILLION)
TABLE 64 CANADA: CBRN DEFENSE MARKET, BY END USER, 2018–2020 (USD MILLION)
TABLE 65 CANADA: CBRN DEFENSE MARKET, BY END USER, 2021–2026 (USD MILLION)
10.3 EUROPE
10.3.1 COVID-19 IMPACT ON EUROPE
10.3.2 PESTLE ANALYSIS: EUROPE
FIGURE 29 EUROPE CBRN DEFENSE MARKET SNAPSHOT
TABLE 66 EUROPE: CRBN DEFENSE MARKET, BY TYPE, 2018–2020 (USD MILLION)
TABLE 67 EUROPE: CRBN DEFENSE MARKET, BY TYPE, 2021–2026 (USD MILLION)
TABLE 68 EUROPE: CRBN DEFENSE MARKET, BY EQUIPMENT, 2018–2020 (USD MILLION)
TABLE 69 EUROPE: CRBN DEFENSE MARKET, BY EQUIPMENT, 2021–2026 (USD MILLION)
TABLE 70 EUROPE: CRBN DEFENSE MARKET, BY END USER, 2018–2020 (USD MILLION)
TABLE 71 EUROPE: CRBN DEFENSE MARKET, BY END USER, 2021–2026 (USD MILLION)
TABLE 72 EUROPE: CRBN DEFENSE MARKET, BY COUNTRY, 2018–2020 (USD MILLION)
TABLE 73 EUROPE: CRBN DEFENSE MARKET, BY COUNTRY, 2021–2026 (USD MILLION)
10.3.3 UK
10.3.3.1 Spending on CBRN defense training and mitigation drive market
TABLE 74 UK: CRBN DEFENSE MARKET, BY TYPE, 2018–2020 (USD MILLION)
TABLE 75 UK: CRBN DEFENSE MARKET, BY TYPE, 2021–2026 (USD MILLION)
TABLE 76 UK: CRBN DEFENSE MARKET, BY END USER, 2018–2020 (USD MILLION)
TABLE 77 UK: CRBN DEFENSE MARKET, BY END USER, 2021–2026 (USD MILLION)
10.3.4 FRANCE
10.3.4.1 Increased military spending fuel growth of market
TABLE 78 FRANCE: CRBN DEFENSE MARKET, BY TYPE, 2018–2020 (USD MILLION)
TABLE 79 FRANCE: CRBN DEFENSE MARKET, BY TYPE, 2021–2026 (USD MILLION)
TABLE 80 FRANCE: CRBN DEFENSE MARKET, BY END USER, 2018–2020 (USD MILLION)
TABLE 81 FRANCE: CRBN DEFENSE MARKET, BY END USER, 2021–2026 (USD MILLION)
10.3.5 GERMANY
10.3.5.1 Presence of major military bodies and CBRN defense solution providers will drive market
TABLE 82 GERMANY: CRBN DEFENSE MARKET, BY TYPE, 2018–2020 (USD MILLION)
TABLE 83 GERMANY: CRBN DEFENSE MARKET, BY TYPE, 2021–2026 (USD MILLION)
TABLE 84 GERMANY: CRBN DEFENSE MARKET, BY END USER, 2018–2020 (USD MILLION)
TABLE 85 GERMANY: CRBN DEFENSE MARKET, BY END USER, 2021–2026 (USD MILLION)
10.3.6 RUSSIA
10.3.6.1 Increasing military expenditure will boost CBRN defense market
TABLE 86 RUSSIA: CRBN DEFENSE MARKET, BY TYPE, 2018–2020 (USD MILLION)
TABLE 87 RUSSIA: CRBN DEFENSE MARKET, BY TYPE, 2021–2026 (USD MILLION)
TABLE 88 RUSSIA: CRBN DEFENSE MARKET, BY END USER, 2018–2020 (USD MILLION)
TABLE 89 RUSSIA: CRBN DEFENSE MARKET, BY END USER, 2021–2026 (USD MILLION)
10.3.7 ITALY
10.3.7.1 Increased CBRN detection and training will drive market
TABLE 90 ITALY: CRBN DEFENSE MARKET, BY TYPE, 2018–2020 (USD MILLION)
TABLE 91 ITALY: CRBN DEFENSE MARKET, BY TYPE, 2021–2026 (USD MILLION)
TABLE 92 ITALY: CRBN DEFENSE MARKET, BY END USER, 2018–2020 (USD MILLION)
TABLE 93 ITALY: CRBN DEFENSE MARKET, BY END USER, 2021–2026 (USD MILLION)
10.3.8 SPAIN
10.3.8.1 Procurement of CBRN defense solutions drive market
TABLE 94 SPAIN: CRBN DEFENSE MARKET, BY TYPE, 2018–2020 (USD MILLION)
TABLE 95 SPAIN: CRBN DEFENSE MARKET, BY TYPE, 2021–2026 (USD MILLION)
TABLE 96 SPAIN: CRBN DEFENSE MARKET, BY END USER, 2018–2020 (USD MILLION)
TABLE 97 SPAIN: CRBN DEFENSE MARKET, BY END USER, 2021–2026 (USD MILLION)
10.3.9 REST OF EUROPE
10.3.9.1 Rising border conflicts in the region fuel growth of market
TABLE 98 REST OF EUROPE: CRBN DEFENSE MARKET, BY TYPE, 2018–2020 (USD MILLION)
TABLE 99 REST OF EUROPE: CRBN DEFENSE MARKET, BY TYPE, 2021–2026 (USD MILLION)
TABLE 100 REST OF EUROPE: CRBN DEFENSE MARKET, BY END USER, 2018–2020 (USD MILLION)
TABLE 101 REST OF EUROPE: CRBN DEFENSE MARKET, BY END USER, 2021–2026 (USD MILLION)
10.4 ASIA PACIFIC
10.4.1 COVID-19 IMPACT ON ASIA PACIFIC
10.4.2 PESTLE ANALYSIS: ASIA PACIFIC
FIGURE 30 ASIA PACIFIC CBRN DEFENSE MARKET SNAPSHOT
TABLE 102 ASIA PACIFIC: CBRN DEFENSE MARKET, BY TYPE, 2018–2020 (USD MILLION)
TABLE 103 ASIA PACIFIC: CBRN DEFENSE MARKET, BY TYPE, 2021–2026 (USD MILLION)
TABLE 104 ASIA PACIFIC: CBRN DEFENSE MARKET, BY EQUIPMENT, 2018–2020 (USD MILLION)
TABLE 105 ASIA PACIFIC: CBRN DEFENSE MARKET, BY EQUIPMENT, 2021–2026 (USD MILLION)
TABLE 106 ASIA PACIFIC: CBRN DEFENSE MARKET, BY END USER, 2018–2020 (USD MILLION)
TABLE 107 ASIA PACIFIC: CBRN DEFENSE MARKET, BY END USER, 2021–2026 (USD MILLION)
TABLE 108 ASIA PACIFIC: CBRN DEFENSE MARKET, BY COUNTRY, 2018–2020 (USD MILLION)
TABLE 109 ASIA PACIFIC: CBRN DEFENSE MARKET, BY COUNTRY, 2021–2026 (USD MILLION)
10.4.3 CHINA
10.4.3.1 Increased use of CBRN defense drills against possible warfare will drive market
TABLE 110 CHINA: CBRN DEFENSE MARKET, BY TYPE, 2018–2020 (USD MILLION)
TABLE 111 CHINA: CBRN DEFENSE MARKET, BY TYPE, 2021–2026 (USD MILLION)
TABLE 112 CHINA: CBRN DEFENSE MARKET, BY END USER, 2018–2020 (USD MILLION)
TABLE 113 CHINA: CBRN DEFENSE MARKET, BY END USER, 2021–2026 (USD MILLION)
10.4.4 INDIA
10.4.4.1 In-house development of CBRN defense solutions to drive market
TABLE 114 INDIA: CBRN DEFENSE MARKET, BY TYPE, 2018–2020 (USD MILLION)
TABLE 115 INDIA: CBRN DEFENSE MARKET, BY TYPE, 2021–2026 (USD MILLION)
TABLE 116 INDIA: CBRN DEFENSE MARKET, BY END USER, 2018–2020 (USD MILLION)
TABLE 117 INDIA: CBRN DEFENSE MARKET, BY END USER, 2021–2026 (USD MILLION)
10.4.5 JAPAN
10.4.5.1 Growth of nuclear and chemical industries drive market
TABLE 118 JAPAN: CBRN DEFENSE MARKET, BY TYPE, 2018–2020 (USD MILLION)
TABLE 119 JAPAN: CBRN DEFENSE MARKET, BY TYPE, 2021–2026 (USD MILLION)
TABLE 120 JAPAN: CBRN DEFENSE MARKET, BY END USER, 2018–2020 (USD MILLION)
TABLE 121 JAPAN: CBRN DEFENSE MARKET, BY END USER, 2021–2026 (USD MILLION)
10.4.6 SOUTH KOREA
10.4.6.1 Increased spending on CBRN defense drive market
TABLE 122 SOUTH KOREA: CBRN DEFENSE MARKET, BY TYPE, 2018–2020 (USD MILLION)
TABLE 123 SOUTH KOREA: CBRN DEFENSE MARKET, BY TYPE, 2021–2026 (USD MILLION)
TABLE 124 SOUTH KOREA: CBRN DEFENSE MARKET, BY END USER, 2018–2020 (USD MILLION)
TABLE 125 SOUTH KOREA: CBRN DEFENSE MARKET, BY END USER, 2021–2026 (USD MILLION)
10.4.7 AUSTRALIA
10.4.7.1 Growing R&D activities improve market position
TABLE 126 AUSTRALIA: CBRN DEFENSE MARKET, BY TYPE, 2018–2020 (USD MILLION)
TABLE 127 AUSTRALIA: CBRN DEFENSE MARKET, BY TYPE, 2021–2026 (USD MILLION)
TABLE 128 AUSTRALIA: CBRN DEFENSE MARKET, BY END USER, 2018–2020 (USD MILLION)
TABLE 129 AUSTRALIA: CBRN DEFENSE MARKET, BY END USER, 2021–2026 (USD MILLION)
10.4.8 REST OF ASIA PACIFIC
TABLE 130 REST OF ASIA PACIFIC: CBRN DEFENSE MARKET, BY TYPE, 2018–2020 (USD MILLION)
TABLE 131 REST OF ASIA PACIFIC: CBRN DEFENSE MARKET, BY TYPE, 2021–2026 (USD MILLION)
TABLE 132 REST OF ASIA PACIFIC: CBRN DEFENSE MARKET, BY END USER, 2018–2020 (USD MILLION)
TABLE 133 REST OF ASIA PACIFIC: CBRN DEFENSE MARKET, BY END USER, 2021–2026 (USD MILLION)
10.5 MIDDLE EAST
10.5.1 COVID-19 IMPACT ON MIDDLE EAST
10.5.2 PESTLE ANALYSIS: MIDDLE EAST
FIGURE 31 MIDDLE EAST CBRN DEFENSE MARKET SNAPSHOT
TABLE 134 MIDDLE EAST: CBRN DEFENSE MARKET, BY TYPE, 2018–2020 (USD MILLION)
TABLE 135 MIDDLE EAST: CBRN DEFENSE MARKET, BY TYPE, 2021–2026 (USD MILLION)
TABLE 136 MIDDLE EAST: CBRN DEFENSE MARKET, BY EQUIPMENT, 2018–2020 (USD MILLION)
TABLE 137 MIDDLE EAST: CBRN DEFENSE MARKET, BY EQUIPMENT, 2021–2026 (USD MILLION)
TABLE 138 MIDDLE EAST: CBRN DEFENSE MARKET, BY END USER, 2018–2020 (USD MILLION)
TABLE 139 MIDDLE EAST: CBRN DEFENSE MARKET, BY END USER, 2021–2026 (USD MILLION)
TABLE 140 MIDDLE EAST: CBRN DEFENSE MARKET, BY COUNTRY, 2018–2020 (USD MILLION)
TABLE 141 MIDDLE EAST: CBRN DEFENSE MARKET, BY COUNTRY, 2021–2026 (USD MILLION)
10.5.3 SAUDI ARABIA
10.5.3.1 Growing petrochemicals and nuclear energy industries drive CBRN market
TABLE 142 SAUDI ARABIA: CBRN DEFENSE MARKET, BY TYPE, 2018–2020 (USD MILLION)
TABLE 143 SAUDI ARABIA: CBRN DEFENSE MARKET, BY TYPE, 2021–2026 (USD MILLION)
TABLE 144 SAUDI ARABIA: CBRN DEFENSE MARKET, BY END USER, 2018–2020 (USD MILLION)
TABLE 145 SAUDI ARABIA: CBRN DEFENSE MARKET, BY END USER, 2021–2026 (USD MILLION)
10.5.4 ISRAEL
10.5.4.1 Technological advancements to tackle regional disputes will drive market
TABLE 146 ISRAEL: CBRN DEFENSE MARKET, BY TYPE, 2018–2020 (USD MILLION)
TABLE 147 ISRAEL: CBRN DEFENSE MARKET, BY TYPE, 2021–2026 (USD MILLION)
TABLE 148 ISRAEL: CBRN DEFENSE MARKET, BY END USER, 2018–2020 (USD MILLION)
TABLE 149 ISRAEL: CBRN DEFENSE MARKET, BY END USER, 2021–2026 (USD MILLION)
10.5.5 UAE
10.5.5.1 Increased CBRN training programs fuel growth of market
TABLE 150 UAE: CBRN DEFENSE MARKET, BY TYPE, 2018–2020 (USD MILLION)
TABLE 151 UAE: CBRN DEFENSE MARKET, BY TYPE, 2021–2026 (USD MILLION)
TABLE 152 UAE: CBRN DEFENSE MARKET, BY END USER, 2018–2020 (USD MILLION)
TABLE 153 UAE: CBRN DEFENSE MARKET, BY END USER, 2021–2026 (USD MILLION)
10.5.6 TURKEY
10.5.6.1 Growth in domestic production of indigenous protective wearables and respiratory systems drive market
TABLE 154 TURKEY: CBRN DEFENSE MARKET, BY TYPE, 2018–2020 (USD MILLION)
TABLE 155 TURKEY: CBRN DEFENSE MARKET, BY TYPE, 2021–2026 (USD MILLION)
TABLE 156 TURKEY: CBRN DEFENSE MARKET, BY END USER, 2018–2020 (USD MILLION)
TABLE 157 TURKEY: CBRN DEFENSE MARKET, BY END USER, 2021–2026 (USD MILLION)
10.5.7 REST OF MIDDLE EAST
TABLE 158 REST OF MIDDLE EAST: CBRN DEFENSE MARKET, BY TYPE, 2018–2020 (USD MILLION)
TABLE 159 REST OF MIDDLE EAST: CBRN DEFENSE MARKET, BY TYPE, 2021–2026 (USD MILLION)
TABLE 160 REST OF MIDDLE EAST: CBRN DEFENSE MARKET, BY END USER, 2018–2020 (USD MILLION)
TABLE 161 REST OF MIDDLE EAST: CBRN DEFENSE MARKET, BY END USER, 2021–2026 (USD MILLION)
10.6 REST OF THE WORLD
10.6.1 COVID-19 IMPACT ON REST OF THE WORLD
10.6.2 PESTLE ANALYSIS: REST OF THE WORLD
TABLE 162 REST OF THE WORLD: CBRN DEFENSE MARKET, BY TYPE, 2018–2020 (USD MILLION)
TABLE 163 REST OF THE WORLD: CBRN DEFENSE MARKET, BY TYPE, 2021–2026 (USD MILLION)
TABLE 164 REST OF THE WORLD: CBRN DEFENSE MARKET, BY EQUIPMENT, 2018–2020 (USD MILLION)
TABLE 165 REST OF THE WORLD: CBRN DEFENSE MARKET, BY EQUIPMENT, 2021–2026 (USD MILLION)
TABLE 166 REST OF THE WORLD: CBRN DEFENSE MARKET, BY END USER, 2018–2020 (USD MILLION)
TABLE 167 REST OF THE WORLD: CBRN DEFENSE MARKET, BY END USER, 2021–2026 (USD MILLION)
TABLE 168 REST OF THE WORLD: CBRN DEFENSE MARKET, BY COUNTRY, 2018–2020 (USD MILLION)
TABLE 169 REST OF THE WORLD: CBRN DEFENSE MARKET, BY COUNTRY, 2021–2026 (USD MILLION)
10.6.3 BRAZIL
10.6.3.1 Procurement of advanced CBRN equipment drive market
TABLE 170 BRAZIL: CBRN DEFENSE MARKET, BY TYPE, 2018–2020 (USD MILLION)
TABLE 171 BRAZIL: CBRN DEFENSE MARKET, BY TYPE, 2021–2026 (USD MILLION)
TABLE 172 BRAZIL: CBRN DEFENSE MARKET, BY END USER, 2018–2020 (USD MILLION)
TABLE 173 BRAZIL: CBRN DEFENSE MARKET, BY END USER, 2021–2026 (USD MILLION)
10.6.4 SOUTH AFRICA
10.6.4.1 Focus on securing borders and improving military capabilities drive market
TABLE 174 SOUTH AFRICA: CBRN DEFENSE MARKET, BY TYPE, 2018–2020 (USD MILLION)
TABLE 175 SOUTH AFRICA: CBRN DEFENSE MARKET, BY TYPE, 2021–2026 (USD MILLION)
TABLE 176 SOUTH AFRICA: CBRN DEFENSE MARKET, BY END USER, 2018–2020 (USD MILLION)
TABLE 177 SOUTH AFRICA: CBRN DEFENSE MARKET, BY END USER, 2021–2026 (USD MILLION)
11 COMPETITIVE LANDSCAPE (Page No. - 156)
11.1 INTRODUCTION
11.2 COMPETITIVE OVERVIEW
TABLE 178 KEY DEVELOPMENTS BY LEADING PLAYERS IN CRBN DEFENSE MARKET BETWEEN 2018 AND 2021
FIGURE 32 MARKET EVALUATION FRAMEWORK: CONTRACTS ARE A KEY STRATEGY ADOPTED BY MARKET PLAYERS
11.3 MARKET RANKING ANALYSIS OF KEY PLAYERS, 2020
FIGURE 33 RANKING ANALYSIS OF TOP 5 PLAYERS: CRBN DEFENSE MARKET, 2020
11.4 MARKET SHARE OF KEY PLAYERS, 2020
FIGURE 34 MARKET SHARE OF KEY PLAYERS: CRBN DEFENSE MARKET, 2020
11.5 REVENUE ANALYSIS OF TOP 5 MARKET PLAYERS, 2020
FIGURE 35 REVENUE ANALYSIS OF TOP 5 PLAYERS: CRBN DEFENSE MARKET, 2020
11.6 COMPANY PRODUCT FOOTPRINT ANALYSIS
TABLE 179 COMPANY PRODUCT FOOTPRINT
TABLE 180 COMPANY SOLUTION TYPE FOOTPRINT
TABLE 181 COMPANY REGION FOOTPRINT
11.7 COMPANY EVALUATION QUADRANT
11.7.1 STAR
11.7.2 EMERGING LEADER
11.7.3 PERVASIVE
11.7.4 PARTICIPANT
FIGURE 36 MARKET COMPETITIVE LEADERSHIP MAPPING, 2020
11.8 STARTUP/SME EVALUATION QUADRANT
11.8.1 PROGRESSIVE COMPANY
11.8.2 RESPONSIVE COMPANY
11.8.3 STARTING BLOCK
11.8.4 DYNAMIC COMPANY
FIGURE 37 CRBN DEFENSE MARKET (STARTUP) COMPETITIVE LEADERSHIP MAPPING, 2020
TABLE 182 CBRN DEFENSE MARKET: DETAILED LIST OF KEY STARTUP/SMES
TABLE 183 CBRN DEFENSE MARKET: COMPETITIVE BENCHMARKING OF KEY STARTUP/SMES
TABLE 184 CBRN DEFENSE MARKET: DETAILED LIST OF KEY STARTUP/SMES
11.9 COMPETITIVE SCENARIO
11.9.1 MARKET EVALUATION FRAMEWORK
11.9.2 NEW PRODUCT LAUNCHES AND DEVELOPMENTS
TABLE 185 NEW PRODUCT LAUNCHES AND DEVELOPMENTS, 2018-2021
11.9.3 DEALS
TABLE 186 DEALS, 2018-2021
11.9.4 ACQUISITIONS/PARTNERSHIPS/AGREEMENTS/EXPANSIONS/ DIVESTMENTS
TABLE 187 ACQUISITIONS/PARTNERSHIPS/AGREEMENTS/ EXPANSIONS/DIVESTMENTS, 2018-2021
12 COMPANY PROFILES (Page No. - 177)
(Business Overview, Products Offered, Recent Developments, MnM View Right to win, Strategic choices made, Weaknesses and competitive threats) *
12.1 INTRODUCTION
12.2 KEY PLAYERS
12.2.1 TELEDYNE FLIR LLC
TABLE 188 TELEDYNE FLIR LLC: BUSINESS OVERVIEW
FIGURE 38 TELEDYNE FLIR LLC: COMPANY SNAPSHOT
TABLE 189 TELEDYNE FLIR LLC: DEALS
12.2.2 CHEMRING GROUP PLC
TABLE 190 CHEMRING GROUP PLC: BUSINESS OVERVIEW
FIGURE 39 CHEMRING GROUP PLC: COMPANY SNAPSHOT
TABLE 191 CHEMRING GROUP PLC: DEALS
12.2.3 BRUKER CORPORATION
TABLE 192 BRUKER CORPORATION: BUSINESS OVERVIEW
FIGURE 40 BRUKER CORPORATION: COMPANY SNAPSHOT
TABLE 193 BRUKER CORPORATION: DEALS
12.2.4 THALES GROUP
TABLE 194 THALES GROUP: BUSINESS OVERVIEW
FIGURE 41 THALES GROUP: COMPANY SNAPSHOT
TABLE 195 THALES GROUP: DEALS
12.2.5 MSA SAFETY, INC.
TABLE 196 MSA SAFETY, INC.: BUSINESS OVERVIEW
FIGURE 42 MSA SAFETY, INC: COMPANY SNAPSHOT
TABLE 197 MSA SAFETY, INC: DEALS
12.2.6 SMITHS GROUP PLC
TABLE 198 SMITHS GROUP PLC: BUSINESS OVERVIEW
FIGURE 43 SMITHS GROUP PLC: COMPANY SNAPSHOT
TABLE 199 SMITHS GROUP PLC: DEALS
12.2.7 AVON PROTECTION PLC
TABLE 200 AVON PROTECTION PLC.: BUSINESS OVERVIEW
FIGURE 44 AVON PROTECTION PLC.: COMPANY SNAPSHOT
TABLE 201 AVON PROTECTION PLC: DEALS
12.2.8 AIRBOSS DEFENSE GROUP INC.
TABLE 202 AIRBOSS DEFENSE GROUP, INC.: BUSINESS OVERVIEW
FIGURE 45 AIRBOSS DEFENSE GROUP, INC.: COMPANY SNAPSHOT
TABLE 203 AIRBOSS DEFENSE GROUP, INC.: DEALS
12.2.9 CUBIC CORPORATION
TABLE 204 CUBIC CORPORATION: BUSINESS OVERVIEW
FIGURE 46 CUBIC CORPORATION: COMPANY SNAPSHOT
TABLE 205 CUBIC CORPORATION: DEALS
12.2.10 RHEINMETALL DEFENCE
TABLE 206 RHEINMETALL DEFENCE: BUSINESS OVERVIEW
FIGURE 47 RHEINMETALL DEFENCE: COMPANY SNAPSHOT
TABLE 207 RHEINMETALL DEFENCE: DEALS
12.2.11 ENVIRONICS OY
TABLE 208 ENVIRONICS OY: BUSINESS OVERVIEW
TABLE 209 ENVIRONICS OY: DEALS
12.2.12 ARGON ELECTRONICS (UK) LTD.
TABLE 210 ARGON ELECTRONICS (UK) LTD.: BUSINESS OVERVIEW
TABLE 211 ARGON ELECTRONICS (UK) LTD.: PRODUCT LAUNCH
TABLE 212 ARGON ELECTRONICS (UK) LTD.: DEALS
12.2.13 BLÜCHER GMBH
TABLE 213 BLUCHER GMBH: BUSINESS OVERVIEW
12.2.14 CRISTANINI SPA
TABLE 214 CRISTANINI SPA: BUSINESS OVERVIEW
12.2.15 KÄRCHER FUTURETECH GMBH
TABLE 215 KÄRCHER FUTURETECH GMBH: BUSINESS OVERVIEW
TABLE 216 KÄRCHER FUTURETECH GMBH: DEALS
12.3 OTHER PLAYERS
12.3.1 LEIDOS
TABLE 217 LEIDOS: BUSINESS OVERVIEW
FIGURE 48 LEIDOS: COMPANY SNAPSHOT
12.3.2 INDRA
TABLE 218 INDRA: BUSINESS OVERVIEW
FIGURE 49 INDRA: COMPANY SNAPSHOT
TABLE 219 INDRA: DEALS
12.3.3 RAPISCAN SYSTEMS
TABLE 220 RAPISCAN SYSTEMS: BUSINESS OVERVIEW
TABLE 221 RAPISCAN SYSTEMS: DEALS
12.3.4 QINETIQ
TABLE 222 QINETIQ.: BUSINESS OVERVIEW
FIGURE 50 QINETIQ: COMPANY SNAPSHOT
TABLE 223 QINETIQ: DEALS
12.3.5 SAAB AB
TABLE 224 SAAB AB: BUSINESS OVERVIEW
FIGURE 51 SAAB AB: COMPANY SNAPSHOT
12.3.6 BIOQUELL, AN ECOLAB SOLUTION
TABLE 225 BIOQUELL, AN ECOLAB SOLUTION: BUSINESS OVERVIEW
TABLE 226 BIOQUELL, AN ECOLAB SOLUTION: DEALS
12.3.7 ARKTIS RADIATION DETECTORS LTD
TABLE 227 ARKTIS RADIATION DETECTORS LTD: BUSINESS OVERVIEW
TABLE 228 ARKTIS RADIATION DETECTORS LTD: PRODUCT LAUNCHES
12.3.8 NEXTER GROUP KNDS
TABLE 229 NEXTER GROUP KNDS: BUSINESS OVERVIEW
TABLE 230 NEXTER GROUP KNDS: DEALS
12.3.9 HDT GLOBAL
TABLE 231 HDT GLOBAL: BUSINESS OVERVIEW
TABLE 232 HDT GLOBAL: DEALS
12.3.10 BATTELLE MEMORIAL INSTITUTE
TABLE 233 BATTELLE MEMORIAL INSTITUTE: BUSINESS OVERVIEW
TABLE 234 BATTELLE MEMORIAL INSTITUTE: DEALS
*Details on Business Overview, Products Offered, Recent Developments, MnM View, Right to win, Strategic choices made, Weaknesses and competitive threats might not be captured in case of unlisted companies.
13 APPENDIX (Page No. - 236)
13.1 DISCUSSION GUIDE
13.2 KNOWLEDGE STORE: MARKETSANDMARKETS’ SUBSCRIPTION PORTAL
13.3 AVAILABLE CUSTOMIZATIONS
13.4 RELATED REPORTS
13.5 AUTHOR DETAILS
This research study involved the usage of both secondary and primary sources. Secondary sources included directories and databases, such as D&B Hoovers, Bloomberg Businessweek, and Factiva, to identify and collect information relevant to the CBRN defense market. Primary sources included industry experts from the CBRN defense market as well as preferred suppliers, manufacturers, solution providers, technology developers, alliances, and organizations related to all the segments of this industry’s value chain. All primary sources were interviewed to obtain and verify critical qualitative and quantitative information as well as to assess the market prospects.
Secondary Research
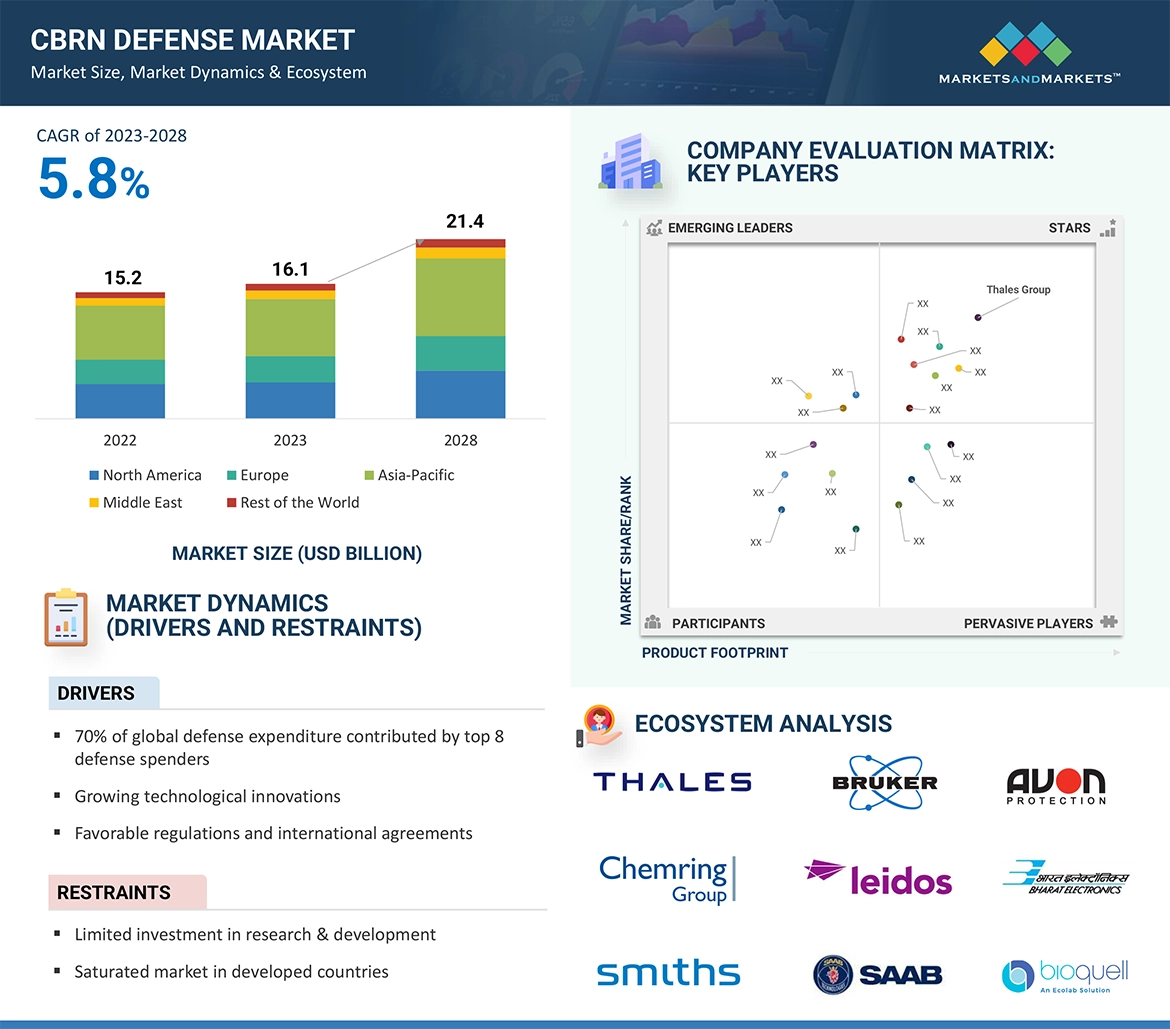
The market share of companies operating in the CBRN defense market was arrived at by using secondary data made available through paid and unpaid sources and by analyzing the product portfolios of the major companies and rating them based on their performance and product or service quality. These data points were further validated through primary sources.
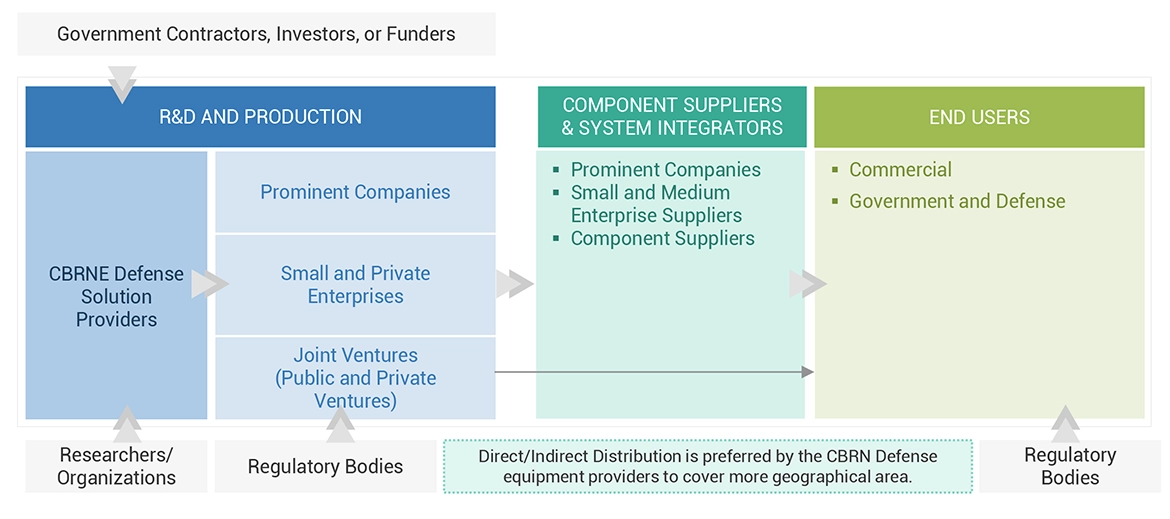
Secondary research was mainly used to obtain key information about the industry’s supply chain, the total pool of key players, market classification & segmentation according to industry trends to the bottom-most level, geographic markets, and key developments from the market- and technology-oriented perspectives.
Primary Research
Extensive primary research was conducted after obtaining information about the current scenario of the CBRN defense market through secondary research. Several primary interviews were conducted with market experts from both demand and supply sides across major countries of North America, Europe, Asia Pacific, the Middle East, and the Rest of the World (RoW). This primary data was collected through questionnaires, emails, and telephonic interviews.
To know about the assumptions considered for the study, download the pdf brochure
Market Size Estimation
Both the top-down and bottom-up approaches were used to estimate and validate the size of the CBRN defense market.
The research methodology used to estimate the market size also included identifying the key players in the industry through secondary research and determining their market shares through primary and secondary research. This included a study of the annual and financial reports of the top market players and extensive interviews of the market leaders, including Chief Executive Officers (CEOs), directors, and marketing executives.
All percentage shares, splits, and breakdowns were determined using secondary sources and were verified through primary sources. All the possible parameters that affect the markets covered in this research study have been accounted for, viewed in extensive detail, verified through primary research, and analyzed to obtain the final quantitative and qualitative data. This data was consolidated, added with detailed inputs and analysis by MarketsandMarkets, and presented in this report.
CBRN Defense Market Size: Top-Down Approach
To know about the assumptions considered for the study, Request for Free Sample Report
Data Triangulation
After arriving at the overall market size from the market size estimation process explained above, the total market was split into several segments and sub-segments. The data triangulation and market breakdown procedures explained below were implemented, wherever applicable, to complete the overall market engineering process and to arrive at exact statistics for varied market segments and sub-segments. The data was triangulated by studying various factors and trends from both the demand as well as supply sides. In addition to this, the market size was validated using both the top-down and bottom-up approaches.
Report Objectives
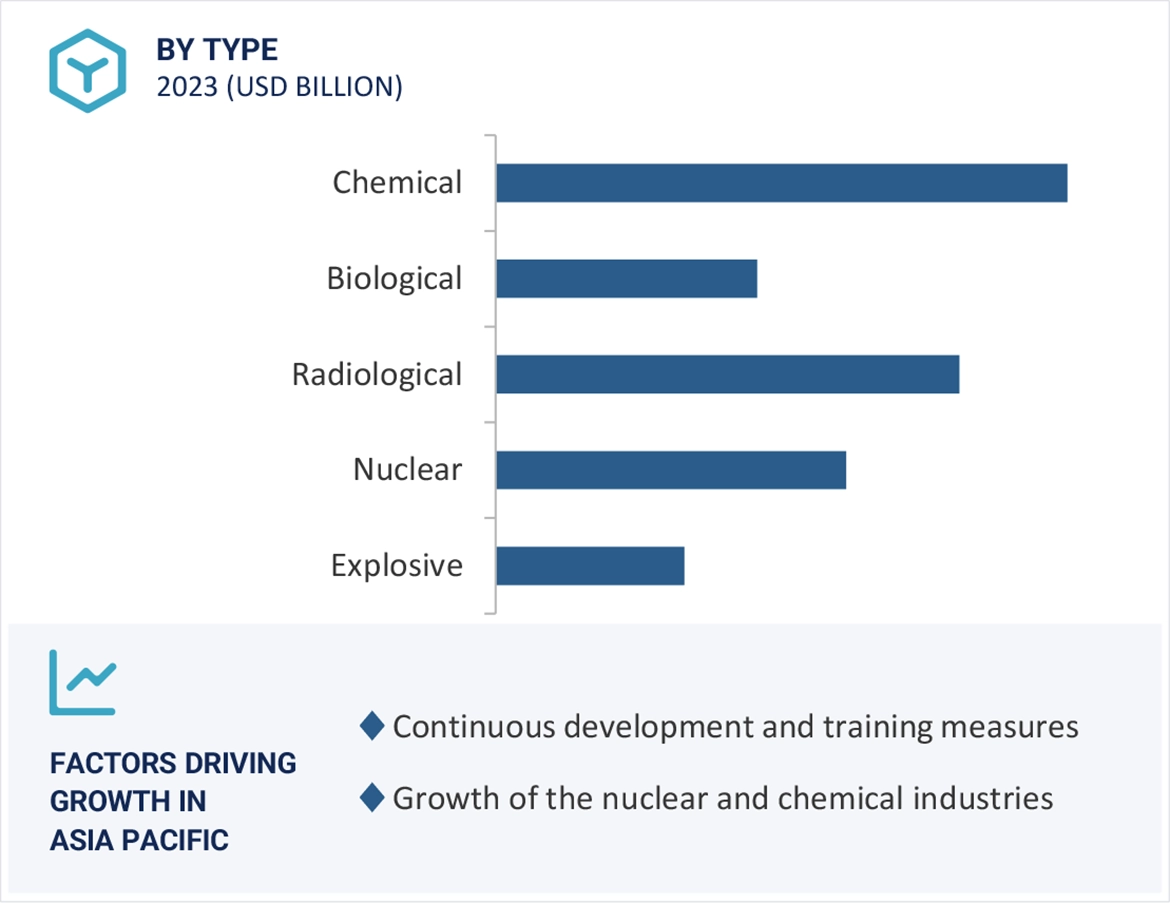
- To define, describe, segment, and forecast the size of the Chemical, Biological, Radiological, Nuclear (CBRN) defense market based on type, equipment, end user, and region.
- To forecast the size of various segments of the CBRN defense system market with respect to five major regions: North America, Europe, Asia Pacific, the Middle East, and the Rest of the World (RoW), along with the major countries in each of these regions
- To identify and analyze the key drivers, restraints, opportunities, and challenges influencing the growth of the CBRN defense system market
- To identify opportunities for stakeholders in the market by studying key market and technology trends
- To analyze competitive developments such as contracts, agreements, acquisitions & partnerships, divestment new product launches & developments, and R&D activities in the market
- To estimate the procurement of CBRN defense systems by different countries to track technological advancements in CBRN defense systems
- To provide a comprehensive competitive landscape of the market along with an overview of the different strategies adopted by key players to strengthen their position in the market
Available Customizations
MarketsandMarkets offers the following customizations for this market report:
Additional country-level analysis of the CBRN Defense Market
Profiling of additional market players (up to 5)
Product Analysis
- Product matrix, which provides a detailed comparison of the product portfolio of each company in the CBRN Defense Market
Growth opportunities and latent adjacency in CBRN Defense Market