The objective of the study is to analyze the key market dynamics, such as drivers, opportunities, challenges, restraints, and key player strategies. To track company developments such as acquisitions, product launches, expansions, collaborations, agreements, and partnerships of the leading players, the competitive landscape of the clinical trial imaging market to analyze market players on various parameters within the broad categories of business and product strategy. Top-down and bottom-up approaches were used to estimate the market size. To estimate the market size of segments and subsegments, market breakdown and data triangulation were used.
The four steps involved in estimating the market size are:
Secondary Research
The secondary research data collection process involves the usage of secondary sources, directories, databases (such as Bloomberg Businessweek, Factiva, and D&B), annual reports, investor presentations, and SEC filings of companies. Secondary research was used to identify and collect information useful for the extensive, technical, market-oriented, and commercial study of the clinical trial imaging market. A database of the key industry leaders was also prepared using secondary research.
Primary Research
The primary research data was conducted after acquiring knowledge about the clinical trial imaging market scenario through secondary research. A significant number of primary interviews were conducted with stakeholders from both the demand side (such as hospitals & ICUs, diagnostic laboratories, research institutes, research laboratories and point-of-care settings) and supply side (such as included various industry experts, such as Directors, Chief X Officers (CXOs), Vice Presidents (VPs) from business development, marketing and product development teams, product manufacturers, wholesalers, channel partners, and distributors) across major countries of North America, Europe, Asia Pacific, the Middle East & Africa, and Latin America. Approximately 40% of the primary interviews were conducted with stakeholders from the demand side, while those from the supply side accounted for the remaining 60%. Primary data for this report was collected through questionnaires, emails, and telephonic interviews.
A breakdown of the primary respondents is provided below:
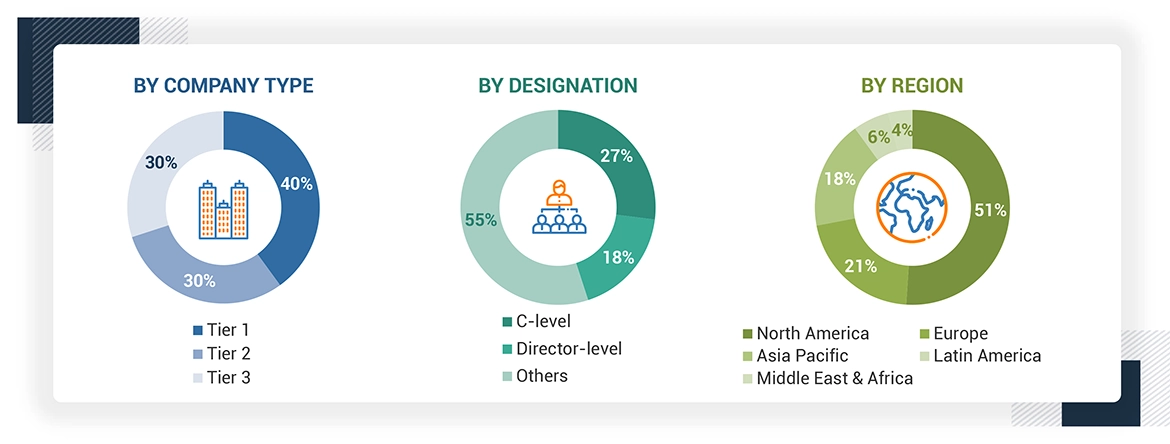
Note 1: *Others include sales managers, marketing managers, and product managers.
Note 2: Tiers are defined based on a company’s total revenue as of 2022: Tier 1=> USD 1 billion, Tier 2 = USD 500 million to USD 1 billion, and Tier 3=< USD 500 million.
To know about the assumptions considered for the study, download the pdf brochure
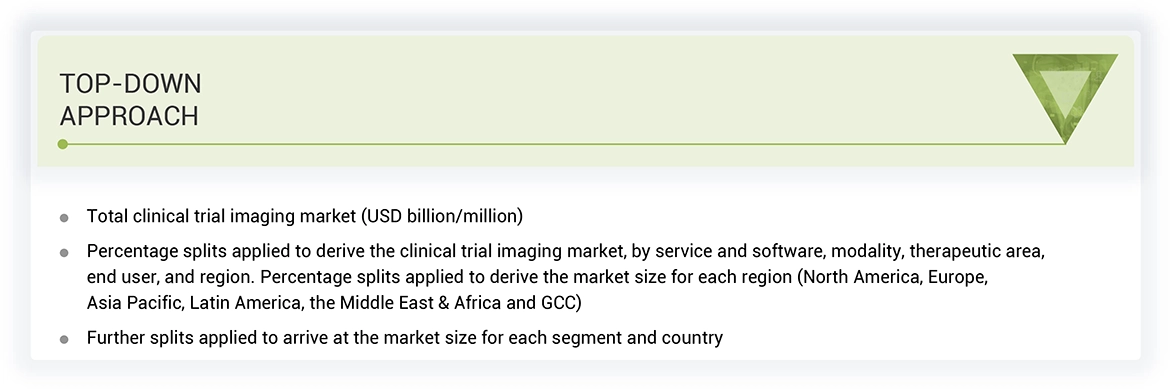
Market Size Estimation
All major product manufacturers offering various clinical trial imaging products were identified at the global/regional level. Revenue mapping was done for the major players and was extrapolated to arrive at the global market value of each type of segment. The market value clinical trial imaging market was also split into various segments and subsegments at the region and country level based on:
-
Product mapping of various manufacturers for each type of clinical trial imaging market at the regional and country-level
-
Relative adoption pattern of each clinical trial imaging market among key application segments at the regional and/or country-level
-
Detailed primary research to gather qualitative and quantitative information related to segments and subsegments at the regional and/or country-level.
-
Detailed secondary research to gauge the prevailing market trends at the regional and/or country-level
Data Triangulation
After arriving at the overall market size—using the market size estimation processes—the market was split into several segments and subsegments. To complete the overall market engineering process and arrive at the exact statistics of each market segment and subsegment, the data triangulation, and market breakdown procedures were employed, wherever applicable. The data was triangulated by studying various factors and trends from both the demand and supply sides in the clinical trial imaging industry.
Market Definition
Clinical trial Imaging is used to create images during clinical trials while conducting research. Such imaging testing is mainly done using X-rays, computed tomography (CT), magnetic resonance imaging (MRI), ultrasound, and positron emission tomography (PET). In clinical trials, imaging is used primarily to evaluate efficacy, endpoints, and more frequently, for safety evaluations and eligibility criteria.
Stakeholders
-
Medical Device Industries
-
Academic and Government Research Institutes
-
Diagnostic Centers
-
Market Research & Consulting Firms
-
Clinical Trial Imaging Manufacturers, Vendors, and Distributors
-
Pharmaceutical and Biotechnology Companies and Contract Research Organizations (CROs)
Report Objectives
-
To define, describe, segment, and forecast the clinical trial imaging market by service & software, modality, therapeutic area, end user, and region
-
To provide detailed information regarding the major factors influencing the market growth (drivers, restraints, opportunities, and challenges)
-
To analyze micromarkets1 with respect to individual growth trends, prospects, and contributions to the overall market
-
To analyze market opportunities for stakeholders and provide details of the competitive landscape for key players
-
To forecast the size of the market segments with respect to five regions, namely, North America, Europe, the Asia Pacific, Latin America, and the Middle East & Africa
-
To profile the key players and comprehensively analyze their product portfolios, market positions, and core competencies
-
To track and analyze company developments such as acquisitions, agreements, partnerships, contracts, approvals, product launches, and mergers in the clinical trial imaging market
-
To benchmark players within the market using the proprietary “Company Evaluation Matrix” framework, which analyzes market players on various parameters within the broad categories of business and product strategy


 HIGHEST CAGR MARKET IN 2023
 US FASTEST GROWING MARKET IN THE REGION


User
Mar, 2021
Decode Al development designed nano human anology of all engineering military weaponry development.