Cloud Migration Services Market

Cloud Migration Services Market by Offering (Service Type (Assessment & Planning, Managed Cloud), Deployment Mode), Application (SCM, BI & Analytics), Migration Type (Infrastructure, Data Migration), Vertical and Region - Global Forecast to 2028

Report Code: TC 4610 Feb, 2024, by marketsandmarkets.com

The cloud migration services market is estimated to be worth USD 10.2 billion in 2023. It is projected to reach USD 29.2 billion by 2028 at a CAGR of 23.3% during the forecast period. Due to various business drivers, the cloud migration services market is expected to grow significantly during the forecast period. The market is experiencing significant growth due to the increasing demand for better agility and automation, the requirement for swifter and seamless deployment, and seamless integration and compatibility of enterprise applications with the evolving landscape of cloud technology.

Cloud Migration Services Market

To know about the assumptions considered for the study, Request for Free Sample Report

Cloud Migration Services Market Opportunities

To know about the assumptions considered for the study, download the pdf brochure

Market Dynamics

Driver: Seamless integration and compatibility of enterprise applications with the evolving landscape of cloud technology

The seamless integration and compatibility of enterprise applications with the evolving landscape of cloud technology serve as a significant driver for adopting cloud migration services. As businesses increasingly recognize the advantages of cloud solutions, ensuring that existing applications align seamlessly with cloud environments becomes imperative. This compatibility allows enterprises to leverage the full potential of the cloud, optimizing performance, scalability, and efficiency. The compatibility of enterprise applications with the advancing landscape of cloud technology plays a pivotal role in driving the demand for cloud migration services. As businesses increasingly recognize the benefits of cloud solutions, the ability to seamlessly integrate existing enterprise applications with evolving cloud technologies becomes a critical factor. This compatibility ensures that applications can operate efficiently in cloud environments, leveraging the full spectrum of advantages offered by the cloud. Furthermore, businesses often rely on a diverse range of applications, from legacy systems to modern software suites. The challenge arises when organizations seek to migrate these applications to the cloud. The process requires careful consideration of each application's architecture, dependencies, and functionalities to ensure a smooth transition. Cloud migration services specialize in addressing these challenges by offering tailored solutions that facilitate the integration of enterprise applications with cloud environments. They provide expertise in understanding the specific requirements of each application, optimizing configurations, and ensuring that the migrated applications function seamlessly in the cloud. Moreover, compatibility with rising cloud technology is instrumental in achieving key objectives of cloud migration, such as scalability, flexibility, and enhanced performance. It allows businesses to harness the advantages of cloud-native features, enabling them to adapt to changing demands and stay competitive in a dynamic market. In conclusion, the compatibility of enterprise applications with evolving cloud technology is a driving force for the cloud migration services market, emphasizing the importance of a streamlined integration process to unlock the full potential of cloud-based solutions for businesses.

Restraints: Complexity associated with migrating legacy systems and applications to the cloud

The complexity linked to migrating legacy systems and applications to the cloud is a significant challenge within the cloud migration services market. Legacy systems, characterized by older technologies, architectures, and dependencies, pose unique hurdles when organizations aim to transition to cloud environments. Cloud migration services play a crucial role in addressing these challenges by offering specialized expertise to understand and optimize legacy architectures. This involves careful data migration, integration with modern technologies, compliance adherence, and minimizing downtime. The proficiency of cloud migration services extends to managing skill set requirements, ensuring data security, and optimizing costs, making them essential partners for organizations seeking a seamless transition from legacy systems to the advantages of cloud environments.

Opportunity: Rising adoption rate of cloud migration services across the healthcare vertical

The healthcare sector is witnessing a substantial uptake of cloud migration services, underscored by a notable surge in adoption rates. Healthcare data is highly sensitive and confidential. Much data is generated and processed daily in the healthcare vertical. However, most healthcare organizations still store their data on their premises. This data is more vulnerable to losses and creates huge security risks. For instance, a survey among healthcare providers revealed that nearly 80% are actively considering or implementing cloud migration strategies to enhance data accessibility, streamline operations, and bolster overall IT infrastructure resilience. This robust adoption indicates the industry's recognition of the strategic advantages cloud technologies offer in optimizing healthcare delivery and data management. According to the HIMSS 2022 Digital Health Trends Survey, 63% of healthcare organizations have deployed at least one application to the cloud, and 45% plan to migrate additional applications in the next two years. Cloud migration paves the way for robust telehealth platforms, expanding access to care for geographically dispersed patients and underserved communities. The need for cost control, technology innovations, increased security, and compliance requirements are expected to drive the high adoption of cloud migration services in the healthcare vertical.

Challenge: Concerns associated with Cloud interoperability

Cloud migration service providers are facing the challenge of cloud interoperability. Cloud interoperability refers to the ability to move applications from one environment to another. While migrating workloads from one cloud environment to another, or while migrating on-premises workloads to a different cloud environment, cloud migration service providers face the challenge of offering the same management tools, server images, databases, operating systems, and other variety of software on different cloud platforms and environments. Cloud providers also find it difficult to write codes that can work in multiple cloud environments and cloud frameworks.

Cloud Migration Services Market Ecosystem

Top Companies in Cloud Migration Services Market

By service type, the data migration and management segment registered the highest CAGR during the forecast period.

Data Migration and Management Services play a crucial role in the Cloud Migration Services market by addressing the complexities of transferring, organizing, and optimizing data during the transition to cloud environments. These services ensure the smooth and secure data transfer from on-premises infrastructure to the cloud. They employ methodologies and tools to minimize downtime and disruptions, facilitating a seamless migration process.

By vertical, media & entertainment register the highest CAGR during the forecast period.

Cloud migration services are increasingly gaining prominence across the Media and Entertainment vertical, transforming the way companies in this sector manage and deliver content. Cloud migration services enable media and entertainment firms to scale their content delivery infrastructure dynamically. Cloud migration services enable media companies to adapt to industry trends, such as the shift to on-demand content consumption, virtual production techniques, and the integration of augmented reality (AR) and virtual reality (VR) experiences.

By application, Business Intelligence & Analytics segment to register highest CAGR during the forecast period.

Cloud migration services enable BI and Analytics applications to leverage scalable cloud resources, ensuring optimal performance even with growing datasets. This scalability allows organizations to handle increasing data volumes efficiently. Cloud migration services facilitate the integration and centralization of diverse data sources. BI and Analytics applications can seamlessly connect to various data repositories in the cloud, enabling a comprehensive view of the organization's data for analytics purposes.

By region,  North America to witness the largest market size during the forecast period.

North America is experiencing significant technological growth in the cloud migration services market. Organizations in North America are actively pursuing digital transformation strategies, and cloud migration is a fundamental component of these initiatives. Businesses aim to modernize their IT infrastructure to stay competitive and agile. Cloud service providers in North America continually enhance their security measures, offering robust solutions to address data protection and privacy concerns. Advanced security features are crucial for businesses considering cloud migration.

North American Cloud Migration Services Market Size, and Share

Key Market Players

The cloud migration services providers have implemented various organic and inorganic growth strategies, such as product upgrades, new product launches, partnerships and agreements, business expansions, and mergers and acquisitions to strengthen their offerings in the market. Some major players in the cloud migration services market include IBM (US), AWS (US), Google (US), Microsoft (US), Oracle (US), SAP (Germany), VMWare (US), Cisco (US), NTT Data (Japan), Accenture (Ireland), Infosys (India), DXC (US), HPE (US), Veritis (US), RiverMeadow (US), Rackspace (US), Informatica (US), WSM (US), and so on.

Get online access to the report on the World's First Market Intelligence Cloud

  • Easy to Download Historical Data & Forecast Numbers
  • Company Analysis Dashboard for high growth potential opportunities
  • Research Analyst Access for customization & queries
  • Competitor Analysis with Interactive dashboard
  • Latest News, Updates & Trend analysis
Request Sample

Scope of the Report

Report Metrics

Details

Market size available for years

2018–2028

Base year considered

2022

Forecast period

2023–2028

Forecast units

USD (Billion)

Segments Covered

Service Type, Deployment Mode, Migration Type  Application, Vertical, and Region

Geographies covered

North America, Asia Pacific, Europe, Middle East & Africa, and Latin America

Companies covered

IBM (US), AWS (US), Google (US), Microsoft (US), Oracle (US), SAP (Germany), VMWare (US), Cisco (US), NTT Data (Japan), Accenture (Ireland), Infosys (India), DXC (US), HPE (US), Veritis (US), RiverMeadow (US), Rackspace (US), Informatica (US), WSM (US), and so on.

This research report categorizes the cloud migration services market based on offering, migration type, application, vertical, and region.

By Offering:
  • Service Type
    • Assessment and Planning Services
      • Readiness Assessment
      • Dependency Mapping
      • Migration Roadmap
    • Migration and Deployment Services
      • Lift-and-Shift Migration
      • DevOps Integration
    • Integration and Customization Services
      • Application Integration
      • Customization and Configuration
      • System Interoperability
    • Data Data Migration and Management
      • Data Mapping and Cleansing
      • Large-Scale Data Migration
      • Data Lifecycle Management
    • Security and Compliance Services
      • Security Assessment and Remediation
      • Compliance Adherence
      • Identity and Access Management (IAM)
    • Training and Support Services
      • User Training and Adoption
      • Ongoing Support
      • Knowledge Transfer
    • Managed Cloud Services
      • Cloud Infrastructure Management
      • Security Management
      • Performance Optimization
    • Other Service Type
  • Deployment Mode
    • Public Cloud
    • Private Cloud
    • Hybrid Cloud
By Migration Type:
  • Infrastructure Migration
  • Platform Migration
  • Data Migration
  • Application Migration
  • Other Migration Types
By Application:
  • Supply Chain Management (SCM)
  • Project Management
  • Content Management
  • Data Warehouse Management
  • Business Intelligence (BI) & Analytics
  • Other Applications
By Vertical:
  • BFSI
  • Healthcare & Life Sciences
  • Telecom
  • Retail & Consumer Goods
  • Government & Public Sector
  • Media & Entertainment
  • Automoitive & Transportation
  • Manufacturing
  • Other Verticals
By Region:
  • North America
    • US
    • Canada
  • Europe
    • UK
    • Germany
    • France
    • Italy
    • Spain
    • Rest of Europe
  • Asia Pacific
    • China
    • India
    • Japan
    • Australia and New Zealand (ANZ)
    • South Korea
    • ASEAN Countries
    • Rest of Asia Pacific
  • Middle East & Africa
    • GCC
    • South Africa
    • Egypt
    • Turkey
    • Rest of the Middle East & Africa
  • Latin America
    • Brazil
    • Mexico
    • Argentina
    • Rest of Latin America

Recent Developments:

  • In November 2023, Infosys entered into a three-year strategic collaboration agreement with AWS to accelerate cloud transformation for financial institutions across Europe, the middle east, and Africa (EMEA). this collaboration, under Infosys cobalt, combines AWS's cloud-native innovation with info sys's domain knowledge, delivering specialized cloud migration and modernization services. the aim is to provide transformative cloud solutions, leveraging generative AI and data analytics, industry-specific use cases, and shared toolsets for accelerated adoption and compliance.
  • In September 2023, Oracle and Microsoft announced Oracle Database at Azure, which gives customers direct access to Oracle database services running on Oracle Cloud Infrastructure (OCI) and deployed in Microsoft Azure datacenters.
  • In September 2023, Red Hat, and Oracle announced the expansion of their alliance to offer customers a greater choice in deploying applications on Oracle Cloud Infrastructure (OCI). As part of the expanded collaboration, Red Hat OpenShift, the industry’s leading hybrid cloud application platform powered by Kubernetes for architecting, building, and deploying cloud-native applications, will be supported and certified to run on OCI.
  • In August 2023, Cisco and Nutanix partnership streamlined cloud migration with a pre-integrated solution, leveraging SaaS-managed infrastructure through Cisco's Intersight. This collaboration supports flexible deployment options, ensuring compatibility with diverse server environments and cloud choices. Nutanix Cloud Platform capabilities provide a consistent operating model, simplified application management, and scalability for migrated workloads. The partnership's benefits include faster migration, reduced costs, improved management, enhanced security, and increased scalability and agility.

Frequently Asked Questions (FAQ):

To speak to our analyst for a discussion on the above findings, click Speak to Analyst

TABLE OF CONTENTS
 
1 INTRODUCTION (Page No. - 27)
    1.1 STUDY OBJECTIVES 
    1.2 MARKET DEFINITION 
           1.2.1 INCLUSIONS AND EXCLUSIONS OF STUDY
    1.3 MARKET SCOPE 
           1.3.1 MARKET SEGMENTATION
           1.3.2 REGIONS COVERED
           1.3.3 YEARS CONSIDERED
    1.4 CURRENCY 
    1.5 STAKEHOLDERS 
    1.6 SUMMARY OF CHANGES 
           1.6.1 IMPACT OF RECESSION
 
2 RESEARCH METHODOLOGY (Page No. - 33)
    2.1 RESEARCH DATA 
           FIGURE 1 CLOUD MIGRATION SERVICES MARKET: RESEARCH DESIGN
           2.1.1 SECONDARY DATA
           2.1.2 PRIMARY DATA
                    TABLE 1 PRIMARY INTERVIEWS
                    2.1.2.1 Breakup of primary profiles
                    2.1.2.2 Key industry insights
    2.2 MARKET BREAKDOWN AND DATA TRIANGULATION 
           FIGURE 2 DATA TRIANGULATION
    2.3 MARKET SIZE ESTIMATION 
           FIGURE 3 CLOUD MIGRATION SERVICES MARKET: TOP-DOWN AND BOTTOM-UP APPROACHES
           2.3.1 TOP-DOWN APPROACH
           2.3.2 BOTTOM-UP APPROACH
                    FIGURE 4 MARKET SIZE ESTIMATION METHODOLOGY - APPROACH 1 (SUPPLY-SIDE): REVENUE FROM SOLUTIONS/SERVICES OF CLOUD MIGRATION SERVICES MARKET
                    FIGURE 5 MARKET SIZE ESTIMATION METHODOLOGY - APPROACH 2, BOTTOM-UP (SUPPLY-SIDE): COLLECTIVE REVENUE FROM ALL SOLUTIONS/SERVICES OF MARKET
                    FIGURE 6 MARKET SIZE ESTIMATION METHODOLOGY - APPROACH 3, BOTTOM-UP (SUPPLY-SIDE): COLLECTIVE REVENUE FROM ALL SERVICES OF MARKET
                    FIGURE 7 MARKET SIZE ESTIMATION METHODOLOGY - APPROACH 4, BOTTOM-UP (DEMAND-SIDE): SHARE OF CLOUD MIGRATION SERVICES THROUGH OVERALL CLOUD MIGRATION SERVICES SPENDING
    2.4 MARKET FORECAST 
           TABLE 2 FACTOR ANALYSIS
    2.5 RESEARCH ASSUMPTIONS 
    2.6 STUDY LIMITATIONS 
    2.7 IMPLICATIONS OF RECESSION ON MARKET 
           TABLE 3 IMPACT OF RECESSION ON MARKET
 
3 EXECUTIVE SUMMARY (Page No. - 46)
    TABLE 4 CLOUD MIGRATION SERVICES MARKET SIZE AND GROWTH RATE, 2018–2022 (USD MILLION, Y-O-Y %) 
    TABLE 5 MARKET SIZE AND GROWTH RATE, 2023–2028 (USD MILLION, Y-O-Y %) 
    FIGURE 8 ASSESSMENT & PLANNING SERVICES SEGMENT ACCOUNTED FOR LARGEST MARKET SHARE IN 2023 
    FIGURE 9 PUBLIC CLOUD SEGMENT DOMINATED MARKET IN 2023 
    FIGURE 10 SUPPLY CHAIN MANAGEMENT APPLICATIONS DOMINATED MARKET IN 2023 
    FIGURE 11 DATA MIGRATION SEGMENT ACCOUNTED FOR LARGEST MARKET SHARE IN 2023 
    FIGURE 12 MEDIA & ENTERTAINMENT SEGMENT TO REGISTER HIGHEST GROWTH DURING FORECAST PERIOD 
    FIGURE 13 ASIA PACIFIC TO REGISTER HIGHEST CAGR DURING FORECAST PERIOD 
 
4 PREMIUM INSIGHTS (Page No. - 51)
    4.1 ATTRACTIVE OPPORTUNITIES IN CLOUD MIGRATION SERVICES MARKET 
           FIGURE 14 SEAMLESS INTEGRATION & COMPATIBILITY OF ENTERPRISE APPLICATIONS WITH CLOUD TECHNOLOGY TO PROPEL MARKET
    4.2 OVERVIEW OF RECESSION IN MARKET 
           FIGURE 15 MARKET TO WITNESS MINOR DECLINE IN Y-O-Y GROWTH IN 2023
    4.3 MARKET: TOP THREE APPLICATIONS 
           FIGURE 16 BI & ANALYTICS SEGMENT TO REGISTER HIGHEST CAGR DURING FORECAST PERIOD
    4.4 NORTH AMERICA: MARKET, BY DEPLOYMENT MODE AND VERTICAL (2023) 
           FIGURE 17 PUBLIC CLOUD DEPLOYMENT SEGMENT ACCOUNTED FOR LARGEST MARKET SHARE IN 2023
    4.5 CLOUD MIGRATION SERVICES MARKET SHARE, BY REGION, 2023 
           FIGURE 18 NORTH AMERICA ACCOUNTED FOR LARGEST MARKET SHARE IN 2023
 
5 MARKET OVERVIEW AND INDUSTRY TRENDS (Page No. - 54)
    5.1 INTRODUCTION 
    5.2 MARKET DYNAMICS 
           FIGURE 19 CLOUD MIGRATION SERVICES MARKET: DRIVERS, RESTRAINTS, OPPORTUNITIES, AND CHALLENGES
           5.2.1 DRIVERS
                    5.2.1.1 Increasing demand for better agility and automation
                    5.2.1.2 Requirement for swifter and seamless deployment
                    5.2.1.3 Growing need for lesser CAPEX and OPEX
                    5.2.1.4 Seamless integration and compatibility of enterprise applications with evolving landscape of cloud technology
           5.2.2 RESTRAINTS
                    5.2.2.1 Complexity associated with migrating legacy systems and applications to cloud
                    5.2.2.2 Fear of vendor lock-in
           5.2.3 OPPORTUNITIES
                    5.2.3.1 Increasing demand for MSPs in transitioning to and managing cloud environments
                    5.2.3.2 High adoption rate of cloud migration services across healthcare vertical
           5.2.4 CHALLENGES
                    5.2.4.1 Complexities in redesigning networks for cloud
                    5.2.4.2 Cloud interoperability
                    5.2.4.3 Compliance with stringent regulations
    5.3 CASE STUDY ANALYSIS 
           5.3.1 IBM ORCHESTRATES CO-OPERATIVE BANK’S IT INDEPENDENCE THROUGH SEAMLESS TRANSFORMATION
           5.3.2 BMG STRATEGICALLY ADOPTS CLOUD MIGRATION WITH GOOGLE AND RACKSPACE TO ADDRESS SCALING CHALLENGES AND EMPOWER ITS DATA-INTENSIVE OPERATIONS
           5.3.3 FINCAD’S INFRASTRUCTURE GETS MODERNIZED, ENHANCING PERFORMANCE AND PRODUCTIVITY, USING RACKSPACE’S ONICA BY MIGRATING TO AWS
           5.3.4 FORTUNE 500 ENTERPRISE ACHIEVES PAINLESS OCI GEN2 MIGRATION WITH ZCONVERTER
           5.3.5 FIRST AID BEAUTY CONQUERS TRAFFIC SPIKES AND AUTOMATES DEPLOYMENTS WITH HIGH-PERFORMANCE, SCALABLE MAGENTO WEBSITE BUILT ON AWS BY WSM
           5.3.6 STRIKING COST SAVINGS WITH AWS CLOUD MIGRATION
           5.3.7 INNOVYZE TRANSFORMS WATER OPERATIONS THROUGH SAAS ADVANCEMENT
           5.3.8 ALCOHOLIC BEVERAGES GIANT ELEVATES DIGITAL MARKETING WITH PUBLIC CLOUD ADOPTION
           5.3.9 MLB ELEVATING GAME — SHARPER STATS, QUICKER ANALYSIS, AND ADVANCED SCIENCE
           5.3.10 ZERTO PROTECTS SPIRIT AIRLINES AGAINST HURRICANE IRMA WITH APPLICATION MIGRATION
    5.4 VALUE CHAIN ANALYSIS 
           FIGURE 20 CLOUD MIGRATION SERVICES MARKET: VALUE CHAIN ANALYSIS
    5.5 ECOSYSTEM 
           FIGURE 21 MARKET: ECOSYSTEM
    5.6 TECHNOLOGY ANALYSIS 
           5.6.1 KEY TECHNOLOGIES
                    5.6.1.1 AI and ML
                    5.6.1.2 Cloud computing
                    5.6.1.3 Software-defined networking and virtual private cloud
           5.6.2 COMPLEMENTARY TECHNOLOGIES
                    5.6.2.1 Internet of things (IoT)
                    5.6.2.2 Edge computing
                    5.6.2.3 Big data & analytics
                    5.6.2.4 Blockchain
           5.6.3 ADJACENT TECHNOLOGIES
                    5.6.3.1 RPA
                    5.6.3.2 5G
                    5.6.3.3 AR/VR
    5.7 INDICATIVE PRICING ANALYSIS 
           TABLE 6 DUPLOCLOUD: INDICATIVE PRICING ANALYSIS OF CLOUD MIGRATION SERVICE VENDORS, BY SERVICE TYPE
           TABLE 7 AWS: INDICATIVE PRICING ANALYSIS OF CLOUD MIGRATION SERVICE VENDORS, BY SERVICE TYPE
    5.8 PATENT ANALYSIS 
           FIGURE 22 NUMBER OF PATENTS PUBLISHED, 2013–2023
           FIGURE 23 TOP FIVE PATENT OWNERS
           TABLE 8 TOP 10 PATENT APPLICANTS (US)
    5.9 PORTER’S FIVE FORCES ANALYSIS 
           FIGURE 24 CLOUD MIGRATION SERVICES MARKET: PORTER’S FIVE FORCES ANALYSIS
           TABLE 9 PORTER’S FIVE FORCES IMPACT ON MARKET
           5.9.1 THREAT OF NEW ENTRANTS
           5.9.2 THREAT OF SUBSTITUTES
           5.9.3 BARGAINING POWER OF SUPPLIERS
           5.9.4 BARGAINING POWER OF BUYERS
           5.9.5 INTENSITY OF COMPETITIVE RIVALRY
    5.10 REGULATORY LANDSCAPE 
           5.10.1 REGULATORY BODIES, GOVERNMENT AGENCIES, AND OTHER ORGANIZATIONS
                    TABLE 10 NORTH AMERICA: LIST OF REGULATORY BODIES, GOVERNMENT AGENCIES, AND OTHER ORGANIZATIONS
                    TABLE 11 EUROPE: LIST OF REGULATORY BODIES, GOVERNMENT AGENCIES, AND OTHER ORGANIZATIONS
                    TABLE 12 ASIA PACIFIC: LIST OF REGULATORY BODIES, GOVERNMENT AGENCIES, AND OTHER ORGANIZATIONS
                    TABLE 13 REST OF THE WORLD: LIST OF REGULATORY BODIES, GOVERNMENT AGENCIES, AND OTHER ORGANIZATIONS
           5.10.2 REGULATIONS
    5.11 TRENDS/DISRUPTIONS IMPACTING CUSTOMER’S BUSINESS 
                    FIGURE 25 REVENUE SHIFT FOR CLOUD MIGRATION SERVICES MARKET
    5.12 KEY STAKEHOLDERS & BUYING CRITERIA 
           5.12.1 KEY STAKEHOLDERS IN BUYING PROCESS
                    FIGURE 26 INFLUENCE OF STAKEHOLDERS ON BUYING PROCESS FOR END USERS
                    TABLE 14 INFLUENCE OF STAKEHOLDERS ON BUYING PROCESS FOR END USERS (%)
           5.12.2 BUYING CRITERIA
                    FIGURE 27 KEY BUYING CRITERIA FOR END USERS
                    TABLE 15 KEY BUYING CRITERIA FOR END USERS
    5.13 BUSINESS MODEL ANALYSIS 
           5.13.1 PRICING-BASED BUSINESS MODEL
                    5.13.1.1 Fixed price or project-based pricing model
                    5.13.1.2 Subscription-based pricing model
                    5.13.1.3 Customized pricing model
    5.14 KEY CONFERENCES AND EVENTS 
                    TABLE 16 MARKET: DETAILED LIST OF CONFERENCES AND EVENTS, 2024–2025
 
6 CLOUD MIGRATION SERVICES MARKET, BY OFFERING (Page No. - 85)
    6.1 INTRODUCTION 
           6.1.1 OFFERING: MARKET DRIVERS
    6.2 SERVICES 
           TABLE 17 MARKET, BY TYPE, 2018–2022 (USD MILLION)
           TABLE 18 MARKET, BY TYPE, 2023–2028 (USD MILLION)
           FIGURE 28 ASSESSMENT & PLANNING SERVICES SEGMENT TO DOMINATE MARKET DURING FORECAST PERIOD
           6.2.1 ASSESSMENT & PLANNING SERVICES
                    6.2.1.1 Rising need to reduce complexities of cloud migration to propel market
                    6.2.1.2 Readiness assessment
                    6.2.1.3 Dependency mapping
                    6.2.1.4 Migration roadmap
                               TABLE 19 ASSESSMENT & PLANNING SERVICES: CLOUD MIGRATION SERVICES MARKET, BY REGION, 2018–2022 (USD MILLION)
                               TABLE 20 ASSESSMENT & PLANNING SERVICES: MARKET, BY REGION, 2023–2028 (USD MILLION)
           6.2.2 MIGRATION & DEPLOYMENT SERVICES
                    6.2.2.1 Growing need to optimize cloud infrastructure to drive market
                    6.2.2.2 Lift & shift migration
                    6.2.2.3 DevOps integration
                               TABLE 21 MIGRATION & DEPLOYMENT SERVICES: MARKET, BY REGION, 2018–2022 (USD MILLION)
                               TABLE 22 MIGRATION & DEPLOYMENT SERVICES: MARKET, BY REGION, 2023–2028 (USD MILLION)
           6.2.3 INTEGRATION & CUSTOMIZATION SERVICES
                    6.2.3.1 Assimilation of diverse applications to boost demand
                    6.2.3.2 Application integration
                    6.2.3.3 Customization & configuration
                    6.2.3.4 System interoperability
                               TABLE 23 INTEGRATION & CUSTOMIZATION SERVICES: MARKET, BY REGION, 2018–2022 (USD MILLION)
                               TABLE 24 INTEGRATION & CUSTOMIZATION SERVICES: MARKET, BY REGION, 2023–2028 (USD MILLION)
           6.2.4 DATA MIGRATION & MANAGEMENT SERVICES
                    6.2.4.1 Ability to reduce disruptions and enhance data integration to fuel market
                    6.2.4.2 Data mapping & cleansing
                    6.2.4.3 Large-scale data migration
                    6.2.4.4 Data lifecycle management
                               TABLE 25 DATA MIGRATION & MANAGEMENT SERVICES: CLOUD MIGRATION SERVICES MARKET, BY REGION, 2018–2022 (USD MILLION)
                               TABLE 26 DATA MIGRATION & MANAGEMENT SERVICES: MARKET, BY REGION, 2023–2028 (USD MILLION)
           6.2.5 SECURITY & COMPLIANCE SERVICES
                    6.2.5.1 Increasing need for legal & regulatory frameworks to boost demand
                    6.2.5.2 Security assessment & remediation
                    6.2.5.3 Compliance adherence
                    6.2.5.4 Identity and access management (IAM)
                               TABLE 27 SECURITY & COMPLIANCE SERVICES: MARKET, BY REGION, 2018–2022 (USD MILLION)
                               TABLE 28 SECURITY & COMPLIANCE SERVICES: MARKET, BY REGION, 2023–2028 (USD MILLION)
           6.2.6 TRAINING & SUPPORT SERVICES
                    6.2.6.1 Increasing need for expertise and efficient resolutions to support market growth
                    6.2.6.2 User training & adoption
                    6.2.6.3 Ongoing support
                    6.2.6.4 Knowledge transfer
                               TABLE 29 TRAINING & SUPPORT SERVICES: MARKET, BY REGION, 2018–2022 (USD MILLION)
                               TABLE 30 TRAINING & SUPPORT SERVICES: MARKET, BY REGION, 2023–2028 (USD MILLION)
           6.2.7 MANAGED CLOUD SERVICES
                    6.2.7.1 Recurring performance maintenance of cloud infrastructure to fuel market
                    6.2.7.2 Cloud infrastructure management
                    6.2.7.3 Security management
                    6.2.7.4 Performance optimization
                               TABLE 31 MANAGED CLOUD SERVICES: CLOUD MIGRATION SERVICES MARKET, BY REGION, 2018–2022 (USD MILLION)
                               TABLE 32 MANAGED CLOUD SERVICES: MARKET, BY REGION, 2023–2028 (USD MILLION)
           6.2.8 OTHER SERVICES
                    TABLE 33 OTHER SERVICES: MARKET, BY REGION, 2018–2022 (USD MILLION)
                    TABLE 34 OTHER SERVICES: MARKET, BY REGION, 2023–2028 (USD MILLION)
    6.3 DEPLOYMENT MODE 
           TABLE 35 MARKET, BY DEPLOYMENT MODE, 2018–2022 (USD MILLION)
           TABLE 36 MARKET, BY DEPLOYMENT MODE, 2023–2028 (USD MILLION)
           FIGURE 29 HYBRID CLOUD SEGMENT TO REGISTER HIGHEST CAGR DURING FORECAST PERIOD
           6.3.1 PUBLIC CLOUD
                    6.3.1.1 Growing need for flexible & scalable cloud resources to drive market
                               TABLE 37 PUBLIC CLOUD: MARKET, BY REGION, 2018–2022 (USD MILLION)
                               TABLE 38 PUBLIC CLOUD: MARKET, BY REGION, 2023–2028 (USD MILLION)
           6.3.2 PRIVATE CLOUD
                    6.3.2.1 Enhanced privacy and control specifications to boost demand
                               TABLE 39 PRIVATE CLOUD: MARKET, BY REGION, 2018–2022 (USD MILLION)
                               TABLE 40 PRIVATE CLOUD: MARKET, BY REGION, 2023–2028 (USD MILLION)
           6.3.3 HYBRID CLOUD
                    6.3.3.1 Ability to integrate cloud models and enhance unified operations to support market growth
                               TABLE 41 HYBRID CLOUD: MARKET, BY REGION, 2018–2022 (USD MILLION)
                               TABLE 42 HYBRID CLOUD: MARKET, BY REGION, 2023–2028 (USD MILLION)
 
7 CLOUD MIGRATION SERVICES MARKET, BY APPLICATION (Page No. - 105)
    7.1 INTRODUCTION 
           7.1.1 APPLICATION: MARKET DRIVERS
                    FIGURE 30 BUSINESS INTELLIGENCE & ANALYTICS SEGMENT TO WITNESS HIGHEST CAGR DURING FORECAST PERIOD
                    TABLE 43 MARKET, BY APPLICATION, 2018–2022 (USD MILLION)
                    TABLE 44 MARKET, BY APPLICATION, 2023–2028 (USD MILLION)
    7.2 SUPPLY CHAIN MANAGEMENT 
           7.2.1 GROWING FOCUS ON ACCESSIBILITY IMPROVEMENT AND ASSET MANAGEMENT TO DRIVE MARKET
           7.2.2 ORDER MANAGEMENT
           7.2.3 INVENTORY MANAGEMENT
           7.2.4 PROCUREMENT MANAGEMENT
           7.2.5 LOGISTICS & FULFILMENT MANAGEMENT
           7.2.6 OTHER SUPPLY CHAIN MANAGEMENT APPLICATIONS
                    TABLE 45 SUPPLY CHAIN MANAGEMENT: MARKET, BY REGION, 2018–2022 (USD MILLION)
                    TABLE 46 SUPPLY CHAIN MANAGEMENT: MARKET, BY REGION, 2023–2028 (USD MILLION)
    7.3 PROJECT MANAGEMENT 
           7.3.1 CONTINUOUS TRACK-FLOW OF GOODS FOR EFFICIENT WORKFLOW TO PROPEL MARKET
           7.3.2 TASK MANAGEMENT
           7.3.3 WORKFLOW AUTOMATION
           7.3.4 ISSUE TRACKING & REPORTING
           7.3.5 COLLABORATION & COMMUNICATION
           7.3.6 OTHER PROJECT MANAGEMENT APPLICATIONS
                    TABLE 47 PROJECT MANAGEMENT: MARKET, BY REGION, 2018–2022 (USD MILLION)
                    TABLE 48 PROJECT MANAGEMENT: MARKET, BY REGION, 2023–2028 (USD MILLION)
    7.4 CONTENT MANAGEMENT 
           7.4.1 COLLABORATIVE SHARING OF DIGITAL CONTENT TO BOOST DEMAND
           7.4.2 CONTENT AUTHORING & PUBLISHING
           7.4.3 WEBSITE BUILDING & MAINTENANCE
           7.4.4 USER MANAGEMENT
           7.4.5 OTHER CONTENT MANAGEMENT APPLICATIONS
                    TABLE 49 CONTENT MANAGEMENT: CLOUD MIGRATION SERVICES MARKET, BY REGION, 2018–2022 (USD MILLION)
                    TABLE 50 CONTENT MANAGEMENT: MARKET, BY REGION, 2023–2028 (USD MILLION)
    7.5 DATA WAREHOUSE MANAGEMENT 
           7.5.1 MANAGEMENT OF UNSTRUCTURED DATA WITH FLEXIBLE STORAGE TO SUPPORT MARKET GROWTH
           7.5.2 PERFORMANCE OPTIMIZATION
           7.5.3 DATA ANALYTICS
           7.5.4 DATA INTEGRATION
           7.5.5 DATA SHARING & COLLABORATION
           7.5.6 OTHER DATA WAREHOUSE MANAGEMENT APPLICATIONS
                    TABLE 51 DATA WAREHOUSE MANAGEMENT: MARKET, BY REGION, 2018–2022 (USD MILLION)
                    TABLE 52 DATA WAREHOUSE MANAGEMENT: MARKET, BY REGION, 2023–2028 (USD MILLION)
    7.6 BUSINESS INTELLIGENCE & ANALYTICS 
           7.6.1 RISING NEED TO MINIMIZE UNPLANNED DOWNTIME TO BOOST DEMAND
           7.6.2 DATA VISUALIZATION
           7.6.3 EMBEDDED ANALYTICS
           7.6.4 DATA MODELING & PREPARATION
           7.6.5 SELF-SERVICE ANALYTICS
                    TABLE 53 BUSINESS INTELLIGENCE & ANALYTICS: MARKET, BY REGION, 2018–2022 (USD MILLION)
                    TABLE 54 BUSINESS INTELLIGENCE & ANALYTICS: MARKET, BY REGION, 2023–2028 (USD MILLION)
    7.7 OTHER APPLICATIONS 
           TABLE 55 OTHER APPLICATIONS: MARKET, BY REGION, 2018–2022 (USD MILLION)
           TABLE 56 OTHER APPLICATIONS: MARKET, BY REGION, 2023–2028 (USD MILLION)
 
8 CLOUD MIGRATION SERVICES MARKET, BY MIGRATION TYPE (Page No. - 119)
    8.1 INTRODUCTION 
           8.1.1 MIGRATION TYPE: MARKET DRIVERS
                    FIGURE 31 APPLICATION MIGRATION SEGMENT TO REGISTER HIGH GROWTH DURING FORECAST PERIOD
                    TABLE 57 MARKET, BY MIGRATION TYPE, 2018–2022 (USD MILLION)
                    TABLE 58 MARKET, BY MIGRATION TYPE, 2023–2028 (USD MILLION)
    8.2 INFRASTRUCTURE MIGRATION 
           8.2.1 SEAMLESS DATA MANAGEMENT AND INTEGRATION WITH CLOUD SERVICES TO DRIVE MARKET
           8.2.2 VIRTUAL MACHINES
           8.2.3 NETWORK CONFIGURATIONS
           8.2.4 LOGGING INFRASTRUCTURE
                    TABLE 59 INFRASTRUCTURE MIGRATION: CLOUD MIGRATION SERVICES MARKET, BY REGION, 2018–2022 (USD MILLION)
                    TABLE 60 INFRASTRUCTURE MIGRATION: MARKET, BY REGION, 2023–2028 (USD MILLION)
    8.3 PLATFORM MIGRATION 
           8.3.1 RISING NEED FOR ADVANCED CLOUD INFRASTRUCTURE TO PROPEL MARKET
           8.3.2 DATA CENTER
           8.3.3 DEVOPS AND TESTING
           8.3.4 ACCESS CONTROL
           8.3.5 IDENTITY & ACCESS MANAGEMENT (IAM)
                    TABLE 61 PLATFORM MIGRATION: MARKET, BY REGION, 2018–2022 (USD MILLION)
                    TABLE 62 PLATFORM MIGRATION: MARKET, BY REGION, 2023–2028 (USD MILLION)
    8.4 DATA MIGRATION 
           8.4.1 ABILITY TO PREVENT LOSS OF CRITICAL DATASETS TO BOOST DEMAND
           8.4.2 DATABASES
           8.4.3 FILE STORAGE
                    TABLE 63 DATA MIGRATION: MARKET, BY REGION, 2018–2022 (USD MILLION)
                    TABLE 64 DATA MIGRATION: MARKET, BY REGION, 2023–2028 (USD MILLION)
    8.5 APPLICATION MIGRATION 
           8.5.1 OPTIMAL FLEXIBILITY AND ENHANCED PERFORMANCE TO DRIVE MARKET
           8.5.2 WEB APPLICATIONS
           8.5.3 ENTERPRISE APPLICATIONS
           8.5.4 CUSTOM APPLICATIONS
                    TABLE 65 APPLICATION MIGRATION: MARKET, BY REGION, 2018–2022 (USD MILLION)
                    TABLE 66 APPLICATION MIGRATION: MARKET, BY REGION, 2023–2028 (USD MILLION)
    8.6 OTHER MIGRATION TYPES 
           TABLE 67 OTHER MIGRATION TYPES: MARKET, BY REGION, 2018–2022 (USD MILLION)
           TABLE 68 OTHER MIGRATION TYPES: MARKET, BY REGION, 2023–2028 (USD MILLION)
 
9 CLOUD MIGRATION SERVICES MARKET, BY VERTICAL (Page No. - 129)
    9.1 INTRODUCTION 
           9.1.1 VERTICAL: MARKET DRIVERS
                    FIGURE 32 BFSI SEGMENT WILL CONTINUE TO DOMINATE MARKET DURING FORECAST PERIOD
                    TABLE 69 MARKET, BY VERTICAL, 2018–2022 (USD MILLION)
                    TABLE 70 MARKET, BY VERTICAL, 2023–2028 (USD MILLION)
    9.2 BFSI 
           9.2.1 ROBUST SECURITY MEASURES AND COMPLIANCE WITH INDUSTRY REGULATIONS TO BOOST DEMAND
                    TABLE 71 BFSI: MARKET, BY REGION, 2018–2022 (USD MILLION)
                    TABLE 72 BFSI: MARKET, BY REGION, 2023–2028 (USD MILLION)
    9.3 HEALTHCARE & LIFE SCIENCES 
           9.3.1 IMPROVED ACCESSIBILITY TO REMOTE CARE TO DRIVE MARKET
                    TABLE 73 HEALTHCARE & LIFE SCIENCES: MARKET, BY REGION, 2018–2022 (USD MILLION)
                    TABLE 74 HEALTHCARE & LIFE SCIENCES: MARKET, BY REGION, 2023–2028 (USD MILLION)
    9.4 TELECOM 
           9.4.1 ENHANCED CONNECTIVITY AND REDUCTION IN OPERATIONAL COSTS TO SUPPORT MARKET GROWTH
                    TABLE 75 TELECOM: MARKET, BY REGION, 2018–2022 (USD MILLION)
                    TABLE 76 TELECOM: MARKET, BY REGION, 2023–2028 (USD MILLION)
    9.5 GOVERNMENT & PUBLIC SECTOR 
           9.5.1 STREAMLINED IT INFRASTRUCTURE AND OPTIMAL RESOURCE UTILIZATION TO FUEL MARKET
                    TABLE 77 GOVERNMENT & PUBLIC SECTOR: MARKET, BY REGION, 2018–2022 (USD MILLION)
                    TABLE 78 GOVERNMENT & PUBLIC SECTOR: MARKET, BY REGION, 2023–2028 (USD MILLION)
    9.6 MANUFACTURING 
           9.6.1 CLOUD-BASED DATA ANALYTICS FOR ACTIONABLE INSIGHTS TO SUPPORT MARKET GROWTH
                    TABLE 79 MANUFACTURING: CLOUD MIGRATION SERVICES MARKET, BY REGION, 2018–2022 (USD MILLION)
                    TABLE 80 MANUFACTURING: MARKET, BY REGION, 2023–2028 (USD MILLION)
    9.7 RETAIL & CONSUMER GOODS 
           9.7.1 SCALABLE INVENTORY MANAGEMENT WITH EFFICIENT SUPPLY CHAIN OPERATIONS TO BOOST DEMAND
                    TABLE 81 RETAIL & CONSUMER GOODS: MARKET, BY REGION, 2018–2022 (USD MILLION)
                    TABLE 82 RETAIL & CONSUMER GOODS: MARKET, BY REGION, 2023–2028 (USD MILLION)
    9.8 MEDIA & ENTERTAINMENT 
           9.8.1 FACILITATION OF COLLABORATIVE WORKFLOWS TO PROPEL MARKET
                    TABLE 83 MEDIA & ENTERTAINMENT: MARKET, BY REGION, 2018–2022 (USD MILLION)
                    TABLE 84 MEDIA & ENTERTAINMENT: MARKET, BY REGION, 2023–2028 (USD MILLION)
    9.9 AUTOMOTIVE & TRANSPORTATION 
           9.9.1 ABILITY TO HANDLE COMPLEX DATA ANALYTICS AND DESIGN TASKS TO BOOST DEMAND
                    TABLE 85 AUTOMOTIVE & TRANSPORTATION: MARKET, BY REGION, 2018–2022 (USD MILLION)
                    TABLE 86 AUTOMOTIVE & TRANSPORTATION: MARKET, BY REGION, 2023–2028 (USD MILLION)
    9.10 OTHER VERTICALS 
           TABLE 87 OTHER VERTICALS: MARKET, BY REGION, 2018–2022 (USD MILLION)
           TABLE 88 OTHER VERTICALS: MARKET, BY REGION, 2023–2028 (USD MILLION)
 
10 CLOUD MIGRATION SERVICES MARKET, BY REGION (Page No. - 142)
     10.1 INTRODUCTION 
               FIGURE 33 ASIA PACIFIC TO REGISTER HIGHEST CAGR DURING FORECAST PERIOD
               FIGURE 34 INDIA TO REGISTER HIGHEST GROWTH DURING FORECAST PERIOD
               TABLE 89 MARKET, BY REGION, 2018–2022 (USD MILLION)
               TABLE 90 MARKET, BY REGION, 2023–2028 (USD MILLION)
     10.2 NORTH AMERICA 
             10.2.1 NORTH AMERICA: MARKET DRIVERS
             10.2.2 NORTH AMERICA: RECESSION IMPACT
                       FIGURE 35 NORTH AMERICA: MARKET SNAPSHOT
                       TABLE 91 NORTH AMERICA: CLOUD MIGRATION SERVICES MARKET, BY TYPE, 2018–2022 (USD MILLION)
                       TABLE 92 NORTH AMERICA: MARKET, BY TYPE, 2023–2028 (USD MILLION)
                       TABLE 93 NORTH AMERICA: MARKET, BY DEPLOYMENT MODE, 2018–2022 (USD MILLION)
                       TABLE 94 NORTH AMERICA: MARKET, BY DEPLOYMENT MODE, 2023–2028 (USD MILLION)
                       TABLE 95 NORTH AMERICA: MARKET, BY APPLICATION, 2018–2022 (USD MILLION)
                       TABLE 96 NORTH AMERICA: MARKET, BY APPLICATION, 2023–2028 (USD MILLION)
                       TABLE 97 NORTH AMERICA: MARKET, BY MIGRATION TYPE, 2018–2022 (USD MILLION)
                       TABLE 98 NORTH AMERICA: MARKET, BY MIGRATION TYPE, 2023–2028 (USD MILLION)
                       TABLE 99 NORTH AMERICA: MARKET, BY VERTICAL, 2018–2022 (USD MILLION)
                       TABLE 100 NORTH AMERICA: MARKET, BY VERTICAL, 2023–2028 (USD MILLION)
                       TABLE 101 NORTH AMERICA: MARKET, BY COUNTRY, 2018–2022 (USD MILLION)
                       TABLE 102 NORTH AMERICA: MARKET, BY COUNTRY, 2023–2028 (USD MILLION)
             10.2.3 US
                       10.2.3.1 Security & regulatory compliance concerns to drive market
             10.2.4 CANADA
                       10.2.4.1 High adoption of hybrid and multi-cloud deployment modes to propel market
     10.3 EUROPE 
             10.3.1 EUROPE: MARKET DRIVERS
             10.3.2 EUROPE: RECESSION IMPACT
                       TABLE 103 EUROPE: CLOUD MIGRATION SERVICES MARKET, BY TYPE, 2018–2022 (USD MILLION)
                       TABLE 104 EUROPE: MARKET, BY TYPE, 2023–2028 (USD MILLION)
                       TABLE 105 EUROPE: MARKET, BY DEPLOYMENT MODE, 2018–2022 (USD MILLION)
                       TABLE 106 EUROPE: MARKET, BY DEPLOYMENT MODE, 2023–2028 (USD MILLION)
                       TABLE 107 EUROPE: MARKET, BY APPLICATION, 2018–2022 (USD MILLION)
                       TABLE 108 EUROPE: MARKET, BY APPLICATION, 2023–2028 (USD MILLION)
                       TABLE 109 EUROPE: MARKET, BY MIGRATION TYPE, 2018–2022 (USD MILLION)
                       TABLE 110 EUROPE: MARKET, BY MIGRATION TYPE, 2023–2028 (USD MILLION)
                       TABLE 111 EUROPE: MARKET, BY VERTICAL, 2018–2022 (USD MILLION)
                       TABLE 112 EUROPE: MARKET, BY VERTICAL, 2023–2028 (USD MILLION)
                       TABLE 113 EUROPE: MARKET, BY COUNTRY, 2018–2022 (USD MILLION)
                       TABLE 114 EUROPE: MARKET, BY COUNTRY, 2023–2028 (USD MILLION)
             10.3.3 UK
                       10.3.3.1 Growing focus on data security concerns and improved IT infrastructure to boost demand
             10.3.4 GERMANY
                       10.3.4.1 Rising focus on remote work facilitation to drive market
             10.3.5 FRANCE
                       10.3.5.1 Favorable government initiatives for innovation to fuel market
             10.3.6 SPAIN
                       10.3.6.1 Increasing focus on data security & compliance to support market growth
             10.3.7 ITALY
                       10.3.7.1 Improvements in digital infrastructure to drive market
             10.3.8 REST OF EUROPE
     10.4 ASIA PACIFIC 
             10.4.1 ASIA PACIFIC: MARKET DRIVERS
             10.4.2 ASIA PACIFIC: RECESSION IMPACT
                       FIGURE 36 ASIA PACIFIC: CLOUD MIGRATION SERVICES MARKET SNAPSHOT
                       TABLE 115 ASIA PACIFIC: MARKET, BY TYPE, 2018–2022 (USD MILLION)
                       TABLE 116 ASIA PACIFIC: MARKET, BY TYPE, 2023–2028 (USD MILLION)
                       TABLE 117 ASIA PACIFIC: MARKET, BY DEPLOYMENT MODE, 2018–2022 (USD MILLION)
                       TABLE 118 ASIA PACIFIC: MARKET, BY DEPLOYMENT MODE, 2023–2028 (USD MILLION)
                       TABLE 119 ASIA PACIFIC: MARKET, BY APPLICATION, 2018–2022 (USD MILLION)
                       TABLE 120 ASIA PACIFIC: MARKET, BY APPLICATION, 2023–2028 (USD MILLION)
                       TABLE 121 ASIA PACIFIC: MARKET, BY MIGRATION TYPE, 2018–2022 (USD MILLION)
                       TABLE 122 ASIA PACIFIC: MARKET, BY MIGRATION TYPE, 2023–2028 (USD MILLION)
                       TABLE 123 ASIA PACIFIC: MARKET, BY VERTICAL, 2018–2022 (USD MILLION)
                       TABLE 124 ASIA PACIFIC: MARKET, BY VERTICAL, 2023–2028 (USD MILLION)
                       TABLE 125 ASIA PACIFIC: MARKET, BY COUNTRY, 2018–2022 (USD MILLION)
                       TABLE 126 ASIA PACIFIC: MARKET, BY COUNTRY, 2023–2028 (USD MILLION)
             10.4.3 CHINA
                       10.4.3.1 Favorable government policies for cloud technologies to boost demand
             10.4.4 INDIA
                       10.4.4.1 High focus on advanced IT infrastructure to propel market
             10.4.5 JAPAN
                       10.4.5.1 Adoption of hybrid-cloud approach for optimal resource utilization to drive market
             10.4.6 AUSTRALIA & NEW ZEALAND
                       10.4.6.1 Regulatory compliance and data privacy considerations to support market growth
             10.4.7 SOUTH KOREA
                       10.4.7.1 Increasing strategic initiatives with prominent cloud vendors to fuel market
             10.4.8 ASEAN COUNTRIES
                       10.4.8.1 Rising focus on risk mitigation with hybrid cloud solutions to drive market
             10.4.9 REST OF ASIA PACIFIC
     10.5 MIDDLE EAST & AFRICA 
             10.5.1 MIDDLE EAST & AFRICA: MARKET DRIVERS
             10.5.2 MIDDLE EAST & AFRICA: RECESSION IMPACT
                       TABLE 127 MIDDLE EAST & AFRICA: CLOUD MIGRATION SERVICES MARKET, BY TYPE, 2018–2022 (USD MILLION)
                       TABLE 128 MIDDLE EAST & AFRICA: MARKET, BY TYPE, 2023–2028 (USD MILLION)
                       TABLE 129 MIDDLE EAST & AFRICA: MARKET, BY DEPLOYMENT MODE, 2018–2022 (USD MILLION)
                       TABLE 130 MIDDLE EAST & AFRICA: MARKET, BY DEPLOYMENT MODE, 2023–2028 (USD MILLION)
                       TABLE 131 MIDDLE EAST & AFRICA: MARKET, BY APPLICATION, 2018–2022 (USD MILLION)
                       TABLE 132 MIDDLE EAST & AFRICA: MARKET, BY APPLICATION, 2023–2028 (USD MILLION)
                       TABLE 133 MIDDLE EAST & AFRICA: MARKET, BY MIGRATION TYPE, 2018–2022 (USD MILLION)
                       TABLE 134 MIDDLE EAST & AFRICA: MARKET, BY MIGRATION TYPE, 2023–2028 (USD MILLION)
                       TABLE 135 MIDDLE EAST & AFRICA: MARKET, BY VERTICAL, 2018–2022 (USD MILLION)
                       TABLE 136 MIDDLE EAST & AFRICA: MARKET, BY VERTICAL, 2023–2028 (USD MILLION)
                       TABLE 137 MIDDLE EAST & AFRICA: MARKET, BY COUNTRY, 2018–2022 (USD MILLION)
                       TABLE 138 MIDDLE EAST & AFRICA: MARKET, BY COUNTRY, 2023–2028 (USD MILLION)
             10.5.3 GCC COUNTRIES
                       10.5.3.1 Vision 2030 and high expenditure on IT infrastructure to support market growth
             10.5.4 SOUTH AFRICA
                       10.5.4.1 Growing focus on scalable solutions to boost demand
             10.5.5 TURKEY
                       10.5.5.1 Emphasis on digital transformation and hybrid cloud deployments to support market growth
             10.5.6 EGYPT
                       10.5.6.1 Increasing adoption of SaaS solutions to propel market
             10.5.7 REST OF MIDDLE EAST & AFRICA
     10.6 LATIN AMERICA 
             10.6.1 LATIN AMERICA: MARKET DRIVERS
             10.6.2 LATIN AMERICA: RECESSION IMPACT
                       TABLE 139 LATIN AMERICA: CLOUD MIGRATION SERVICES MARKET, BY TYPE, 2018–2022 (USD MILLION)
                       TABLE 140 LATIN AMERICA: MARKET, BY TYPE, 2023–2028 (USD MILLION)
                       TABLE 141 LATIN AMERICA: MARKET, BY DEPLOYMENT MODE, 2018–2022 (USD MILLION)
                       TABLE 142 LATIN AMERICA: MARKET, BY DEPLOYMENT MODE, 2023–2028 (USD MILLION)
                       TABLE 143 LATIN AMERICA: MARKET, BY APPLICATION, 2018–2022 (USD MILLION)
                       TABLE 144 LATIN AMERICA: MARKET, BY APPLICATION, 2023–2028 (USD MILLION)
                       TABLE 145 LATIN AMERICA: MARKET, BY MIGRATION TYPE, 2018–2022 (USD MILLION)
                       TABLE 146 LATIN AMERICA: MARKET, BY MIGRATION TYPE, 2023–2028 (USD MILLION)
                       TABLE 147 LATIN AMERICA: MARKET, BY VERTICAL, 2018–2022 (USD MILLION)
                       TABLE 148 LATIN AMERICA: MARKET, BY VERTICAL, 2023–2028 (USD MILLION)
                       TABLE 149 LATIN AMERICA: MARKET, BY COUNTRY, 2018–2022 (USD MILLION)
                       TABLE 150 LATIN AMERICA: MARKET, BY COUNTRY, 2023–2028 (USD MILLION)
             10.6.3 BRAZIL
                       10.6.3.1 Growing adoption of AI and ML in data analytics to drive market
             10.6.4 MEXICO
                       10.6.4.1 High focus on big data for critical decision-making to support market growth
             10.6.5 ARGENTINA
                       10.6.5.1 Demand for cost-effective solutions to boost demand
             10.6.6 REST OF LATIN AMERICA
 
11 COMPETITIVE LANDSCAPE (Page No. - 183)
     11.1 OVERVIEW 
     11.2 STRATEGIES ADOPTED BY KEY PLAYERS 
               TABLE 151 OVERVIEW OF STRATEGIES ADOPTED BY KEY CLOUD MIGRATION SERVICE VENDORS
     11.3 REVENUE ANALYSIS 
               FIGURE 37 BUSINESS SEGMENT REVENUE ANALYSIS FOR KEY PLAYERS, 2018–2022 (USD BILLION)
     11.4 MARKET SHARE ANALYSIS 
               FIGURE 38 MARKET SHARE ANALYSIS FOR KEY PLAYERS, 2022
               TABLE 152 CLOUD MIGRATION SERVICES MARKET: DEGREE OF COMPETITION
     11.5 BRAND/PRODUCT COMPARATIVE ANALYSIS 
               TABLE 153 BRAND/PRODUCT COMPARATIVE ANALYSIS, BY CLOUD MIGRATION SERVICES
     11.6 COMPANY EVALUATION MATRIX: KEY PLAYERS 
             11.6.1 STARS
             11.6.2 EMERGING LEADERS
             11.6.3 PERVASIVE PLAYERS
             11.6.4 PARTICIPANTS
                       FIGURE 39 CLOUD MIGRATION SERVICES: COMPANY EVALUATION MATRIX FOR KEY PLAYERS, 2022
             11.6.5 COMPANY FOOTPRINT OF KEY PLAYERS
                       TABLE 154 PRODUCT FOOTPRINT (23 COMPANIES)
                       TABLE 155 VERTICAL FOOTPRINT (23 COMPANIES)
                       TABLE 156 REGIONAL FOOTPRINT (23 COMPANIES)
                       TABLE 157 COMPANY FOOTPRINT (23 COMPANIES)
     11.7 COMPANY EVALUATION MATRIX: STARTUPS/SMES 
             11.7.1 PROGRESSIVE COMPANIES
             11.7.2 RESPONSIVE COMPANIES
             11.7.3 DYNAMIC COMPANIES
             11.7.4 STARTING BLOCKS
                       FIGURE 40 MARKET: COMPANY EVALUATION MATRIX FOR STARTUPS/SMES, 2022
             11.7.5 COMPETITIVE BENCHMARKING
                       TABLE 158 MARKET: DETAILED LIST OF KEY STARTUP/SMES
                       TABLE 159 CLOUD MIGRATION SERVICES MARKET: COMPETITIVE BENCHMARKING OF STARTUPS/SMES
     11.8 COMPETITIVE SCENARIO 
             11.8.1 PRODUCT LAUNCHES
                       TABLE 160 CLOUD MIGRATION SERVICES: PRODUCT LAUNCHES & ENHANCEMENTS, JANUARY 2020–NOVEMBER 2023
             11.8.2 DEALS
                       TABLE 161 CLOUD MIGRATION SERVICES: DEALS, JANUARY 2020–NOVEMBER 2023
     11.9 VALUATION AND FINANCIAL METRICS OF KEY CLOUD MIGRATION SERVICE VENDORS 
               FIGURE 41 EV/EBITDA OF KEY CLOUD MIGRATION SERVICE VENDORS
               FIGURE 42 YEAR-TO-DATE (YTD) PRICE TOTAL RETURN AND 5-YEAR STOCK BETA OF KEY CLOUD MIGRATION SERVICE VENDORS
 
12 COMPANY PROFILES (Page No. - 208)
     12.1 INTRODUCTION 
(Business overview, Products/Services offered, Recent developments & MnM View)*
     12.2 KEY PLAYERS 
             12.2.1 GOOGLE
                       TABLE 162 GOOGLE: BUSINESS OVERVIEW
                       FIGURE 43 GOOGLE: COMPANY SNAPSHOT
                       TABLE 163 GOOGLE: PRODUCTS/SERVICES OFFERED
                       TABLE 164 GOOGLE: PRODUCT/SERVICE LAUNCHES & ENHANCEMENTS
                       TABLE 165 GOOGLE: DEALS
             12.2.2 AWS
                       TABLE 166 AWS: BUSINESS OVERVIEW
                       FIGURE 44 AWS: COMPANY SNAPSHOT
                       TABLE 167 AWS: PRODUCTS/SERVICES OFFERED
                       TABLE 168 AWS: PRODUCT/SERVICE LAUNCHES & ENHANCEMENTS
                       TABLE 169 AWS: DEALS
             12.2.3 IBM
                       TABLE 170 IBM: BUSINESS OVERVIEW
                       FIGURE 45 IBM: COMPANY SNAPSHOT
                       TABLE 171 IBM: PRODUCTS/SERVICES OFFERED
                       TABLE 172 IBM: PRODUCT/SERVICE LAUNCHES & ENHANCEMENTS
                       TABLE 173 IBM: DEALS
             12.2.4 MICROSOFT
                       TABLE 174 MICROSOFT: BUSINESS OVERVIEW
                       FIGURE 46 MICROSOFT: COMPANY SNAPSHOT
                       TABLE 175 MICROSOFT: PRODUCTS/SERVICES OFFERED
                       TABLE 176 MICROSOFT: PRODUCT/SERVICE LAUNCHES & ENHANCEMENTS
                       TABLE 177 MICROSOFT: DEALS
             12.2.5 ACCENTURE
                       TABLE 178 ACCENTURE: BUSINESS OVERVIEW
                       FIGURE 47 ACCENTURE: COMPANY SNAPSHOT
                       TABLE 179 ACCENTURE: PRODUCTS/SERVICES OFFERED
                       TABLE 180 ACCENTURE: DEALS
             12.2.6 CISCO
                       TABLE 181 CISCO: BUSINESS OVERVIEW
                       FIGURE 48 CISCO: COMPANY SNAPSHOT
                       TABLE 182 CISCO: PRODUCTS/SERVICES OFFERED
                       TABLE 183 CISCO: DEALS
             12.2.7 VMWARE
                       TABLE 184 VMWARE: BUSINESS OVERVIEW
                       FIGURE 49 VMWARE: COMPANY SNAPSHOT
                       TABLE 185 VMWARE: PRODUCTS/SERVICES OFFERED
                       TABLE 186 VMWARE: PRODUCT/SERVICE LAUNCHES & ENHANCEMENTS
                       TABLE 187 VMWARE: DEALS
             12.2.8 ORACLE
                       TABLE 188 ORACLE: BUSINESS OVERVIEW
                       FIGURE 50 ORACLE: COMPANY SNAPSHOT
                       TABLE 189 ORACLE: PRODUCTS/SERVICES OFFERED
                       TABLE 190 ORACLE: PRODUCT/SERVICE LAUNCHES & ENHANCEMENTS
                       TABLE 191 ORACLE: DEALS
             12.2.9 INFOSYS
                       TABLE 192 INFOSYS: BUSINESS OVERVIEW
                       FIGURE 51 INFOSYS: COMPANY SNAPSHOT
                       TABLE 193 INFOSYS: PRODUCTS/SERVICES OFFERED
                       TABLE 194 INFOSYS: PRODUCT LAUNCHES AND ENHANCEMENTS
                       TABLE 195 INFOSYS: DEALS
             12.2.10 NTT DATA
                       TABLE 196 NTT DATA: BUSINESS OVERVIEW
                       FIGURE 52 NTT DATA: COMPANY SNAPSHOT
                       TABLE 197 NTT DATA: PRODUCTS/SERVICES OFFERED
                       TABLE 198 NTT DATA: PRODUCT/SERVICE LAUNCHES & ENHANCEMENTS
                       TABLE 199 NTT DATA: DEALS
*Details on Business overview, Products/Services offered, Recent developments & MnM View might not be captured in case of unlisted companies.
     12.3 OTHER PLAYERS 
             12.3.1 SAP
             12.3.2 DXC
             12.3.3 HPE
             12.3.4 VERITIS
             12.3.5 RIVERMEADOW
             12.3.6 SECUREKLOUD
             12.3.7 RACKSPACE TECHNOLOGY
             12.3.8 INFORMATICA
             12.3.9 WSM
             12.3.10 VIRTUSTREAM
             12.3.11 LANGATE
             12.3.12 MAVEN WAVE
             12.3.13 SAIGON TECHNOLOGY
             12.3.14 BELITSOFT
             12.3.15 LTIMINDTREE
             12.3.16 ASPIRE SYSTEMS
             12.3.17 RELOKIA
             12.3.18 TRIGENT SOFTWARE
             12.3.19 SCALEFOCUS
             12.3.20 SIMFORM
             12.3.21 IT SVIT
 
13 ADJACENT AND RELATED MARKETS (Page No. - 266)
     13.1 INTRODUCTION 
     13.2 CLOUD COMPUTING MARKET - GLOBAL FORECAST TO 2028 
             13.2.1 MARKET DEFINITION
             13.2.2 MARKET OVERVIEW
                       13.2.2.1 Cloud computing market, by service model
                                   TABLE 200 CLOUD COMPUTING MARKET, BY SERVICE MODEL, 2018–2022 (USD BILLION)
                                   TABLE 201 CLOUD COMPUTING MARKET, BY SERVICE MODEL, 2023–2028 (USD BILLION)
                       13.2.2.2 Cloud computing market, by deployment model
                                   TABLE 202 CLOUD COMPUTING MARKET, BY DEPLOYMENT MODEL, 2018–2022 (USD BILLION)
                                   TABLE 203 CLOUD COMPUTING MARKET, BY DEPLOYMENT MODEL, 2023–2028 (USD BILLION)
                       13.2.2.3 Cloud computing market, by organization size
                                   TABLE 204 CLOUD COMPUTING MARKET, BY ORGANIZATION SIZE, 2018–2022 (USD BILLION)
                                   TABLE 205 CLOUD COMPUTING MARKET, BY ORGANIZATION SIZE, 2023–2028 (USD BILLION)
                       13.2.2.4 Cloud computing market, by vertical
                                   TABLE 206 CLOUD COMPUTING MARKET, BY VERTICAL, 2018–2022 (USD BILLION)
                                   TABLE 207 CLOUD COMPUTING MARKET, BY VERTICAL, 2023–2028 (USD BILLION)
                       13.2.2.5 Cloud computing market, by region
                                   TABLE 208 CLOUD COMPUTING MARKET, BY REGION, 2018–2022 (USD BILLION)
                                   TABLE 209 CLOUD COMPUTING MARKET, BY REGION, 2023–2028 (USD BILLION)
     13.3 CLOUD MANAGED SERVICES MARKET - GLOBAL FORECAST TO 2027 
             13.3.1 MARKET DEFINITION
             13.3.2 MARKET OVERVIEW
                       13.3.2.1 Cloud managed services market, by service type
                                   TABLE 210 CLOUD MANAGED SERVICES MARKET, BY SERVICE TYPE, 2018–2021 (USD MILLION)
                                   TABLE 211 CLOUD MANAGED SERVICES MARKET, BY SERVICE TYPE, 2022–2027 (USD MILLION)
                       13.3.2.2 Cloud managed services market, by deployment mode
                                   TABLE 212 CLOUD MANAGED SERVICES MARKET, BY DEPLOYMENT MODE, 2017–2021 (USD MILLION)
                                   TABLE 213 CLOUD MANAGED SERVICES MARKET, BY DEPLOYMENT MODE, 2022–2027 (USD MILLION)
                       13.3.2.3 Cloud managed services market, by organization size
                                   TABLE 214 CLOUD MANAGED SERVICES MARKET, BY ORGANIZATION SIZE, 2018–2021 (USD MILLION)
                                   TABLE 215 CLOUD MANAGED SERVICES MARKET, BY ORGANIZATION SIZE, 2022–2027 (USD MILLION)
                       13.3.2.4 Cloud managed services market, by vertical
                                   TABLE 216 CLOUD MANAGED SERVICES MARKET, BY VERTICAL, 2018–2021 (USD MILLION)
                                   TABLE 217 CLOUD MANAGED SERVICES MARKET, BY VERTICAL, 2022–2027 (USD MILLION)
                       13.3.2.5 Cloud managed services market, by region
                                   TABLE 218 CLOUD MANAGED SERVICES MARKET, BY REGION, 2018–2021 (USD MILLION)
                                   TABLE 219 CLOUD MANAGED SERVICES MARKET, BY REGION, 2022–2027 (USD MILLION)
 
14 APPENDIX (Page No. - 278)
     14.1 DISCUSSION GUIDE 
     14.2 KNOWLEDGESTORE: MARKETSANDMARKETS’ SUBSCRIPTION PORTAL 
     14.3 CUSTOMIZATION OPTIONS 
     14.4 RELATED REPORTS 
     14.5 AUTHOR DETAILS 

The cloud migration services market research study involved extensive secondary sources, directories, journals, and paid databases. Primary sources were mainly industry experts from the core and related industries, preferred cloud migration services providers, third-party service providers, consulting service providers, end users, and other commercial enterprises. In-depth interviews were conducted with various primary respondents, including key industry participants and subject matter experts, to obtain and verify critical qualitative and quantitative information, and assess the market’s prospects.

Secondary Research

In the secondary research process, various sources were referred to, for identifying and collecting information for this study. Secondary sources included annual reports, press releases, and investor presentations of companies; white papers, journals, and certified publications; and articles from recognized authors, directories, and databases. The data was also collected from other secondary sources, such as journals, government websites, blogs, and vendors' websites. Additionally, cloud migration services spending of various countries was extracted from the respective sources. Secondary research was mainly used to obtain key information related to the industry’s value chain and supply chain to identify key players based on service type, market classification, and segmentation according to offerings of major players, industry trends related to service type, deployment modes, migration type, application, vertical, and regions, and key developments from both market- and technology-oriented perspectives.

Primary Research

In the primary research process, various primary sources from both the supply and demand sides were interviewed to obtain qualitative and quantitative information on the market. The primary sources from the supply side included various industry experts, including Chief Experience Officers (CXOs); Vice Presidents (VPs); directors from business development, marketing, and cloud migration services expertise; related key executives from cloud migration services vendors, SIs, professional service providers, and industry associations; and key opinion leaders.

Primary interviews were conducted to gather insights, such as market statistics, revenue data collected from solutions and services, market breakups, market size estimations, market forecasts, and data triangulation. Primary research also helped understand various trends related to migration types, applications, deployments, and regions. Stakeholders from the demand side, such as Chief Information Officers (CIOs), Chief Technology Officers (CTOs), Chief Strategy Officers (CSOs), and end users using cloud migration services solutions, were interviewed to understand the buyer’s perspective on suppliers, products, service providers, and their current usage of cloud migration services, which would impact the overall cloud migration services market.

Cloud Migration Services  Market Size, and Share

To know about the assumptions considered for the study, download the pdf brochure

COMPANY NAME

DESIGNATION

IBM

Senior Partner, Global Hybrid Cloud Migration Offering

AWS

Cloud Migration Consultant

Accenture

Cloud Migration Consultant 

NTT Data

Director- Data & Analytics

Market Size Estimation

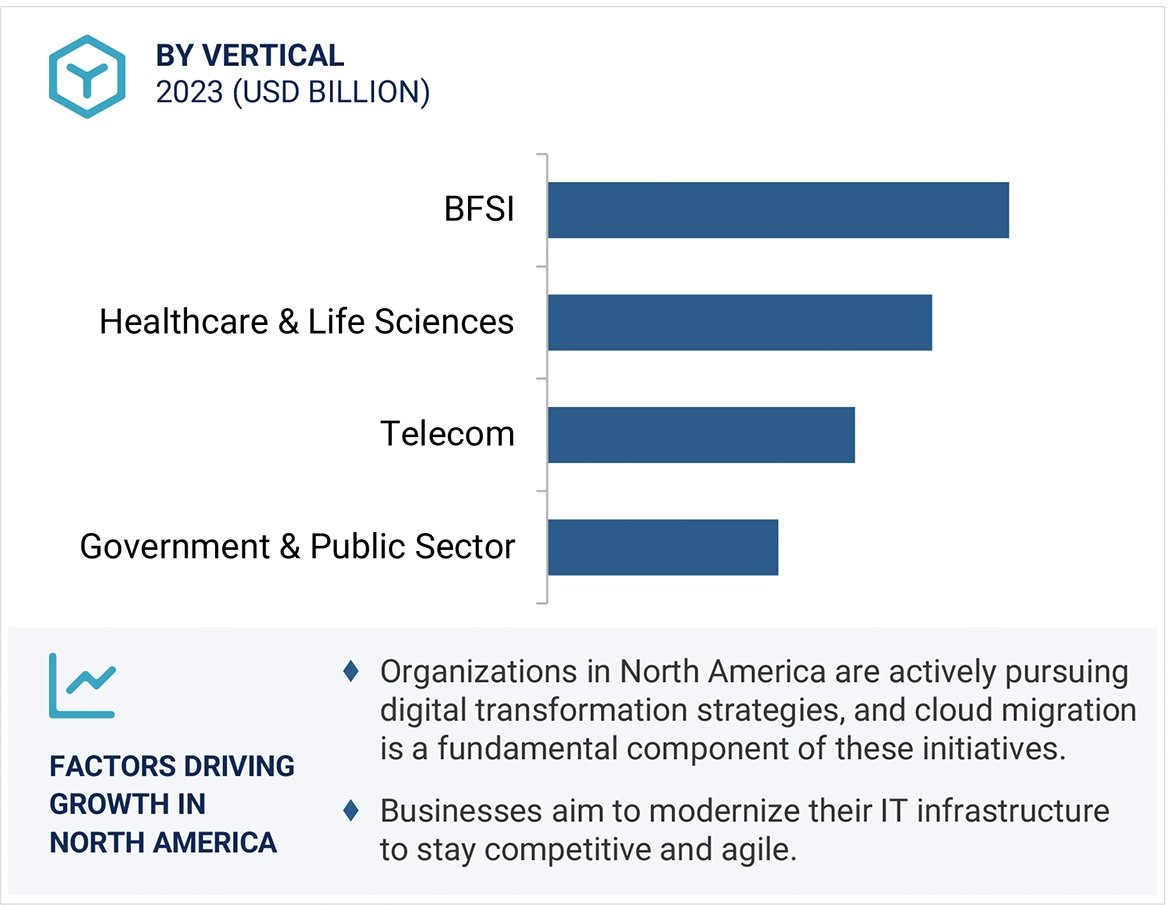
In the bottom-up approach, the adoption rate of cloud migration services among different verticals in key countries concerning their regions contributing the most to the market share was identified. For cross-validation, the adoption of cloud migration services among industries and different use cases concerning their regions was identified and extrapolated. Weightage was given to use cases identified in different regions for the market size calculation.

Based on the market numbers, the regional split was determined by primary and secondary sources. The procedure included the analysis of the cloud migration services market’s regional penetration. Based on secondary research, the regional spending on Information and Communications Technology (ICT), socio-economic analysis of each country, strategic vendor analysis of major cloud migration services providers, and organic and inorganic business development activities of regional and global players were estimated. With the data triangulation procedure and data validation through primaries, the exact values of the overall cloud migration services market size and segments’ size were determined and confirmed using the study.

Global Cloud migration services Market Size: Bottom-Up and Top-Down Approach

Cloud Migration Services  Market Bottom Up Approach

To know about the assumptions considered for the study, Request for Free Sample Report

Data Triangulation

Based on the market numbers, the regional split was determined by primary and secondary sources. The procedure included the analysis of the cloud migration services market’s regional penetration. Based on secondary research, the regional spending on Information and Communications Technology (ICT), socio-economic analysis of each country, strategic vendor analysis of major cloud migration services providers, and organic and inorganic business development activities of regional and global players were estimated. With the data triangulation procedure and data validation through primaries, the exact values of the overall cloud migration services market size and segments’ size were determined and confirmed using the study.

Market Definition

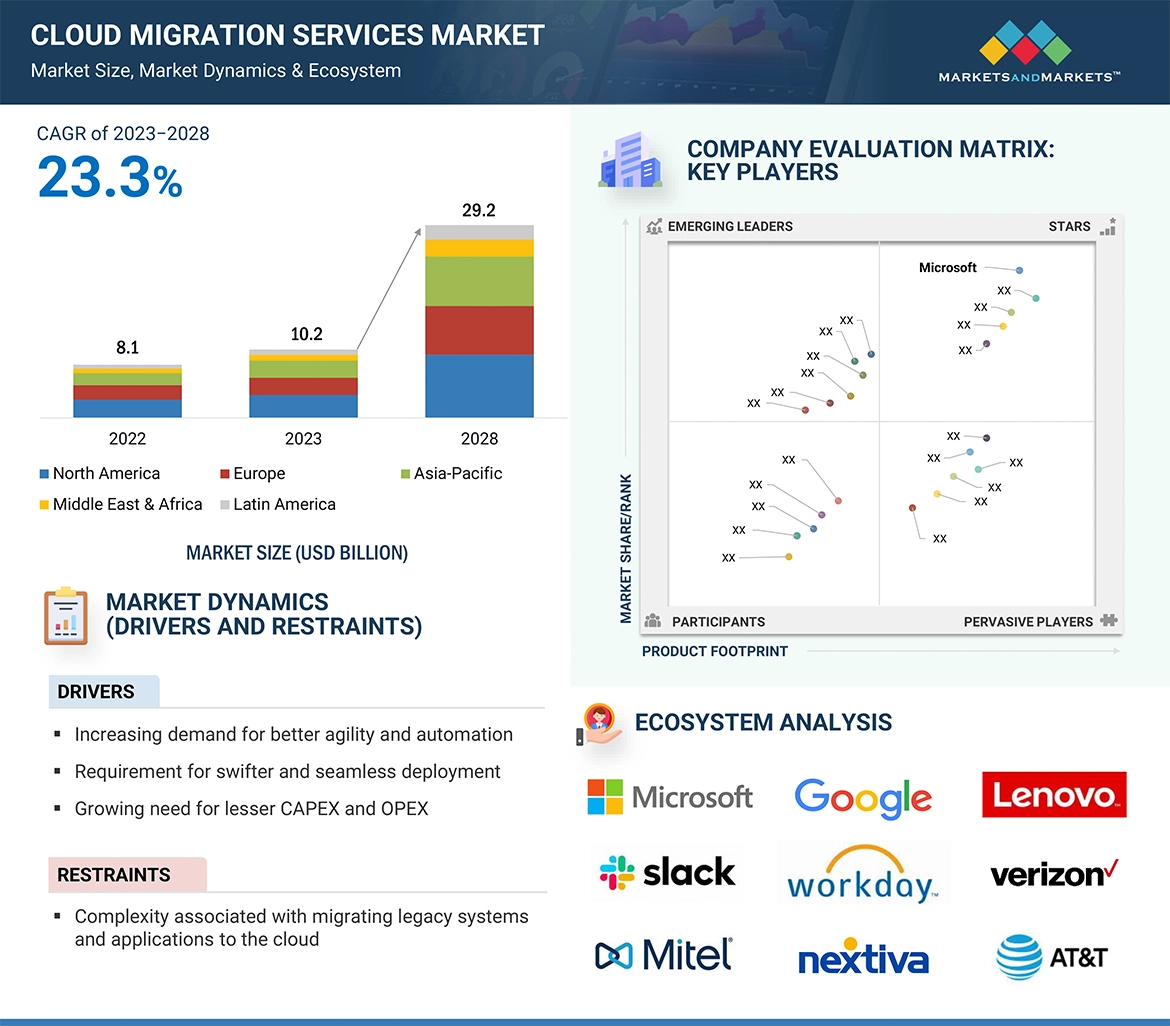
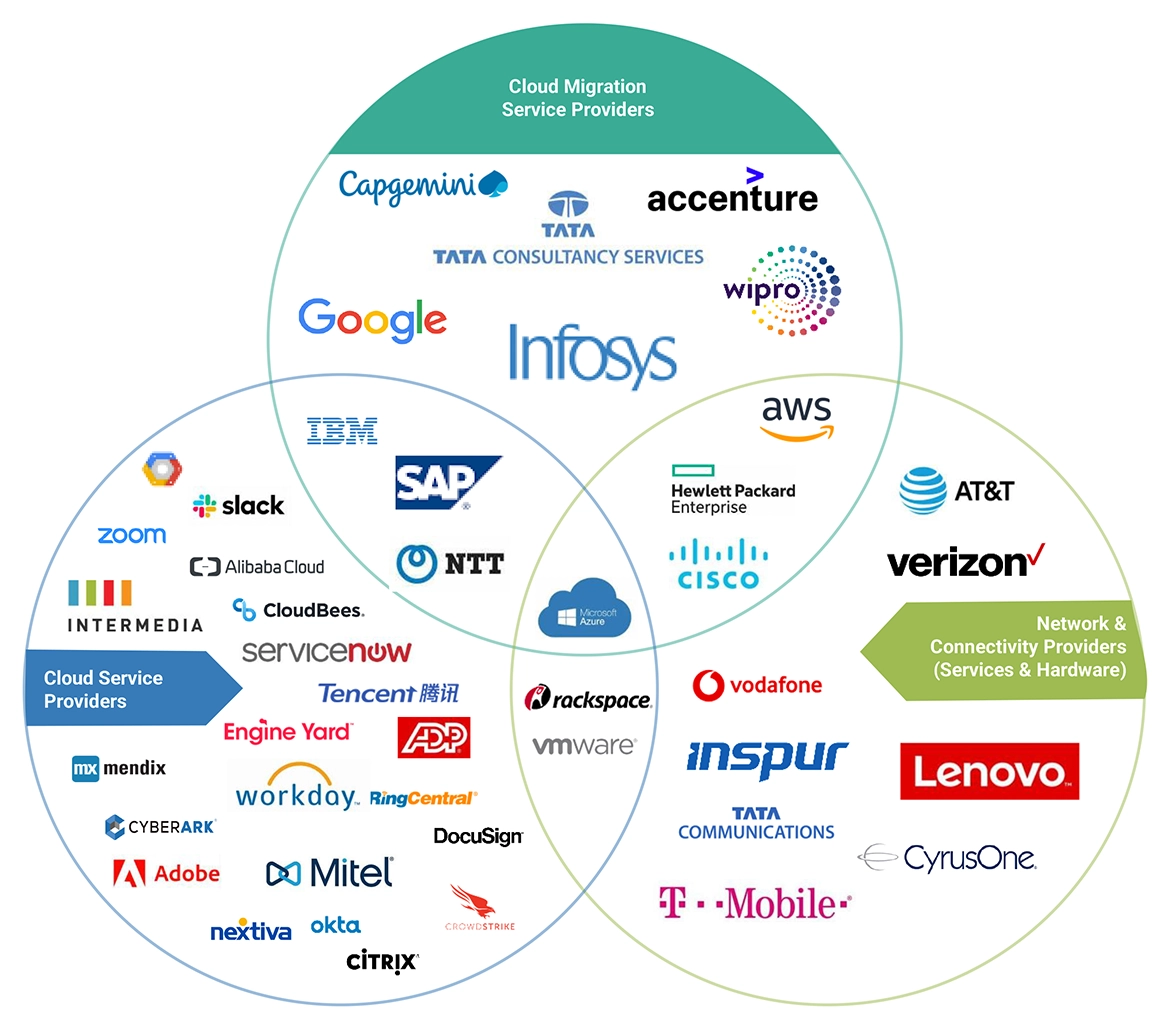
A cloud migration services refer to the collection of processes that help enterprises in migrating data, applications, servers, databases, and various workloads from on-premises to the Infrastructure as a Service (IaaS) cloud model, or from one cloud environment to another. Cloud migration is critical for achieving improved operational performance and efficiency, which requires careful planning, analysis, and execution to maintain the compatibility of the cloud environment with the organizational requirements.

STAKEHOLDERS

  • Cloud migration services vendors
  • Cloud migration vendors
  • Managed service providers
  • Support and maintenance service providers
  • System Integrators (SIs)/migration service providers
  • Value-Added Resellers (VARs) and distributors
  • Distributors and Value-added Resellers (VARs)
  • System Integrators (SIs)
  • Independent Software Vendors (ISV)
  • Third-party providers
  • Technology providers

Report Objectives

  • To define, describe, and predict the cloud migration services market by offering (service type, and deployment mode), migration type, application, vertical and region
  • To provide detailed information related to major factors (drivers, restraints, opportunities, and industry-specific challenges) influencing the market growth
  • To analyze the micro markets with respect to individual growth trends, prospects, and their contribution to the total market
  • To analyze the opportunities in the market for stakeholders by identifying the high-growth segments of the cloud migration services market
  • To analyze opportunities in the market and provide details of the competitive landscape for stakeholders and market leaders
  • To forecast the market size of segments for five main regions: North America, Europe, Asia Pacific, Middle East & Africa, and Latin America
  • To profile key players and comprehensively analyze their market rankings and core competencies
  • To analyze competitive developments, such as partnerships, new product launches, and mergers and acquisitions, in the cloud migration services market
  • To analyze the impact of recession across all the regions across the cloud migration services market

Available Customizations

With the given market data, MarketsandMarkets offers customizations as per your company’s specific needs. The following customization options are available for the report:

Product Analysis

  • Product quadrant, which gives a detailed comparison of the product portfolio of each company.

Geographic Analysis

  • Further breakup of the North American cloud migration services market
  • Further breakup of the European market
  • Further breakup of the Asia Pacific market
  • Further breakup of the Middle Eastern & African market
  • Further breakup of the Latin America cloud migration services market

Company Information

  • Detailed analysis and profiling of additional market players (up to five)
Custom Market Research Services

We will customize the research for you, in case the report listed above does not meet with your exact requirements. Our custom research will comprehensively cover the business information you require to help you arrive at strategic and profitable business decisions.

Request Customization
Report Code
TC 4610
Published ON
Feb, 2024
Choose License Type
BUY NOW
  • SHARE
X
Request Customization
Speak to Analyst
Speak to Analyst
OR FACE-TO-FACE MEETING
PERSONALIZE THIS RESEARCH
  • Triangulate with your Own Data
  • Get Data as per your Format and Definition
  • Gain a Deeper Dive on a Specific Application, Geography, Customer or Competitor
  • Any level of Personalization
REQUEST A FREE CUSTOMIZATION
LET US HELP YOU!
  • What are the Known and Unknown Adjacencies Impacting the Cloud Migration Services Market
  • What will your New Revenue Sources be?
  • Who will be your Top Customer; what will make them switch?
  • Defend your Market Share or Win Competitors
  • Get a Scorecard for Target Partners
CUSTOMIZED WORKSHOP REQUEST
+1-888-600-6441
  • Call Us
  • +1-888-600-6441 (Corporate office hours)
  • +1-888-600-6441 (US/Can toll free)
  • +44-800-368-9399 (UK office hours)
CONNECT WITH US
ABOUT TRUST ONLINE
©2024 MarketsandMarkets Research Private Ltd. All rights reserved
DMCA.com Protection Status Website Feedback