
Data Acquisition System Market Size, Share & Trends, 2025 To 2030

Data Acquisition System Market Size, Share, Growth & Trends by Offering (External Chassis, Plug-in Boards, Software), Speed (>100MS/S, 20MS/S-100MS/S, 1MS/S-20MS/S, 100KS/S-1MS/S), Use case (Flight & Space, NVH, Acoustics, Structural Health, Data Recording) - Global Forecast to 2030


DATA ACQUISITION (DAQ) SYSTEM MARKET SIZE, SHARE & TRENDS
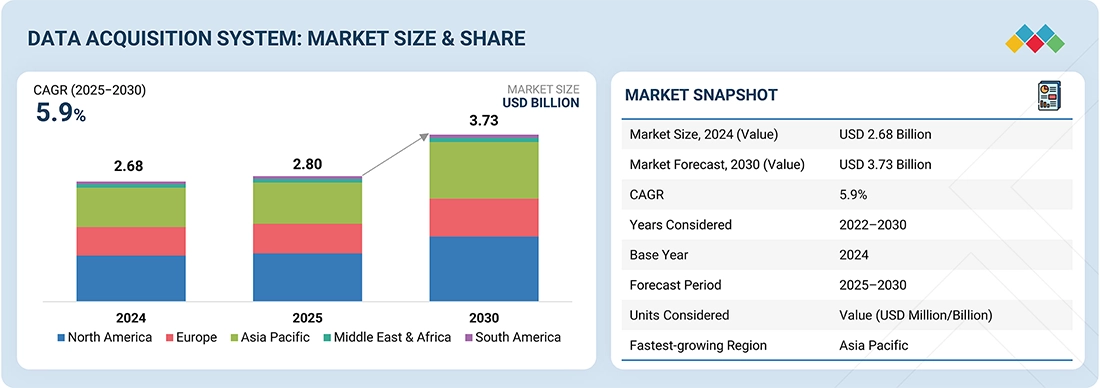
According to Marketsandmarkets, the global data acquisition system market size was valued at USD 2.80 billion in 2025 and is projected to reach USD 3.73 billion by 2030, growing at a CAGR of 5.9% from 2025 to 2030. The demand for data acquisition systems is growing because industries need precise, real-time data for better decision-making and automation. Advances in technology have made these systems more accessible and versatile across sectors like manufacturing, healthcare, and energy. Additionally, increasing complexity in processes and regulations drives the need for accurate monitoring and control.
MARKET SNAPSHOT TABLE
| REPORT METRIC | DETAILS |
|---|---|
| Market Size, 2025 (Value) | USD 2.80 Billion |
| Market Forecast, 2030 (Value) | USD 3.73 Billion |
| Growth Rate | CAGR of 5.9% from 2025 to 2030 |
| Years Considered | 2021–2030 |
| Base Year | 2024 |
| Forecast Period | 2025–2030 |
| Units Considered | Value (USD Million/Billion), Volume (Thousand/Million Units) |
| Report Coverage | Revenue Forecast, Company Ranking, Competitive Landscape, Growth Factors, and Trends |
| Top Companies |
|
| Growth Drivers |
|
| Segments Covered |
|
| Regional Scope | North America, Europe, Asia Pacific, Middle East, Latin America, Africa |
Market Size & Forecast
KEY TAKEAWAYS
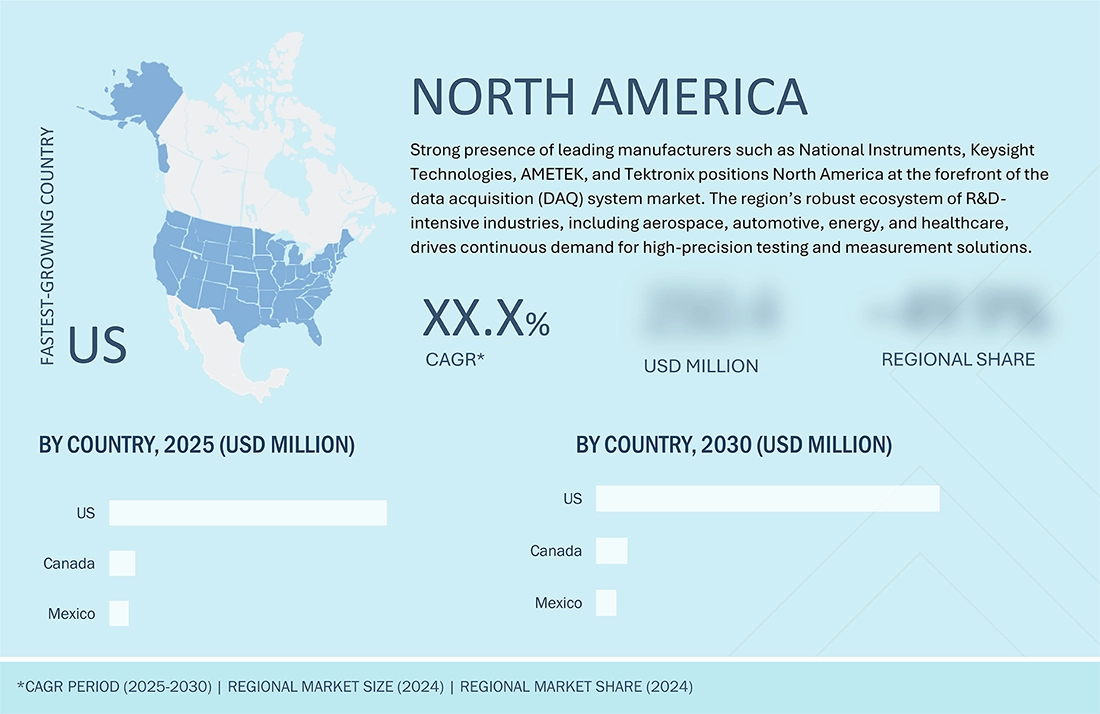
- The North America data acquisition system market dominated with a share of 38.4% in 2024.
- By offerings, the software segment is expected to register the highest CAGR of 6.8%.
- By speed, the ultra-high (>100 MS/S) segment is projected to grow at the fastest rate from 2025 to 2030.
- By application, the testing segment is expected to dominate the market.
- By vertical, the wireless communication & infrastructur segment will grow the fastest during the forecast period.
- NATIONAL INSTRUMENTS CORP, Keysight Technologies, Spectris, and Yokogawa Electric Corporation, were identified as some of the star players in the data acquisiton system market (global), given their strong market share and product footprint.
- Starinsense, Logic Fruit Technologies, Theta Measurement and control Solutions, among others, have distinguished themselves among startups and SMEs by securing strong footholds in specialized niche areas, underscoring their potential as emerging market leaders
A data acquisition system (DAQ) is a technology used to continuously collect, measure, and digitize physical signals from various sensors for analysis and monitoring in real time. The demand for DAQ systems is growing due to the rising need for predictive maintenance, which helps reduce downtime and operational costs by identifying issues before they become critical. Additionally, increasing regulatory requirements for data accuracy and traceability in industries such as pharmaceuticals and aerospace drive the adoption of DAQ systems.
Source: Secondary Research, Interviews with Experts, MarketsandMarkets Analysis
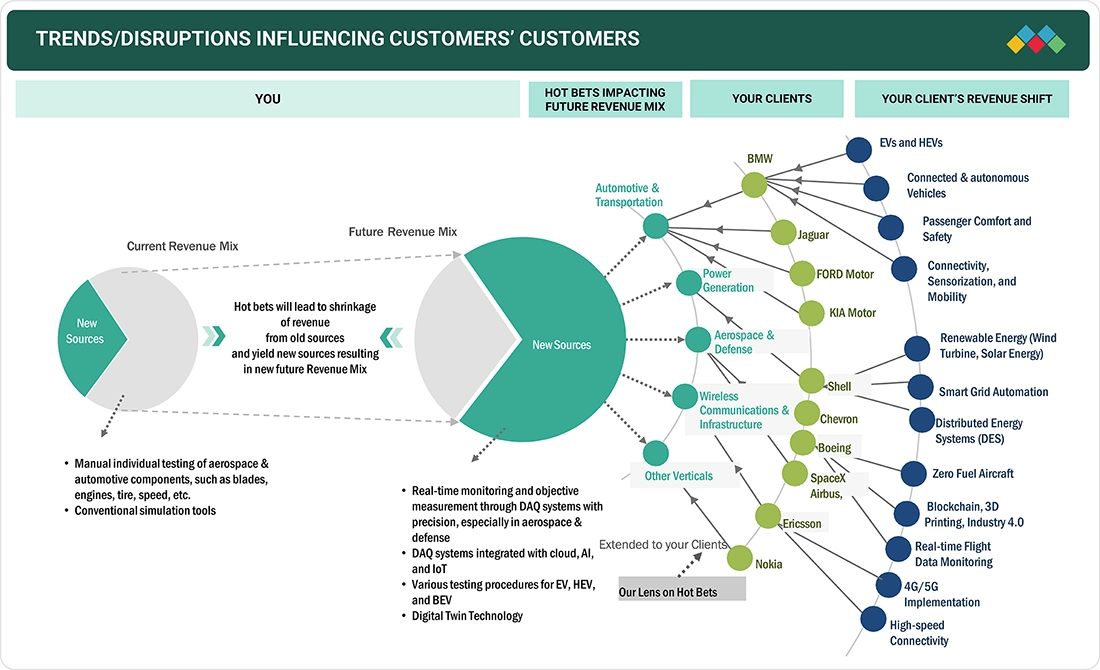
TRENDS & DISRUPTIONS IMPACTING CUSTOMERS' CUSTOMERS
The data acquisition system industry is evolving with trends like integration of AI and IoT, cloud-based solutions, and wireless remote monitoring, enabling real-time data processing and scalability. However, challenges such as cybersecurity risks, integration complexities with legacy systems, and supply chain disruptions are causing significant market disruptions. These factors are reshaping how industries adopt and implement data acquisition system technologies for more efficient and secure data acquisition.
Source: Secondary Research, Interviews with Experts, MarketsandMarkets Analysis
DATA ACQUISITION (DAQ) SYSTEM MARKET DYNAMICS
Level
-
Growing emphasis on data monitoring to improve efficiency in industrial operations

-
Surging deployment of Industry 5.0 technologies

Level
-
Requirement for high computational power for real-time data analysis

-
Price sensitivity among consumers

Level
-
Shifting preference toward automated DAQ systems

-
Surging demand for high-speed connectivity technologies in industries

Level
-
Regulatory and compliance constraints

-
Increasing cybersecurity risks

Source: Secondary Research, Interviews with Experts, MarketsandMarkets Analysis
Driver: Growing emphasis on data monitoring to improve efficiency in industrial operations
Industries increasingly rely on DAQ systems to continuously collect accurate, real-time data from machinery and processes. This data helps identify inefficiencies, predict equipment failures, and enable proactive maintenance, reducing downtime and operational costs. As a result, companies can optimize productivity, improve resource management, and make faster, data-driven decisions.
Restraint: Requirement for high computational power for real-time data analysis
The need for high computational power for real-time data analysis can be a restraint for DAQ systems, as it demands expensive hardware and advanced processing capabilities. This increases overall system costs and complexity, making it challenging for some industries to implement or scale DAQ solutions effectively. Additionally, managing and maintaining such powerful systems requires specialized expertise, which can limit adoption..
Opportunity: Shifting preference toward automated DAQ systems
The shifting preference towards automated DAQ systems presents a significant opportunity in the market. Automation enhances data accuracy, reduces human error, and speeds up data collection and processing, enabling more efficient and reliable operations. As industries move towards smart manufacturing and Industry 4.0, demand for automated DAQ solutions is rising, driving innovation and growth in the sector.
Challenge: Regulatory and compliance constraints
Regulatory and compliance constraints act as a challenge for the DAQ market, as strict industry standards require data acquisition systems to meet rigorous accuracy, security, and reporting criteria. Meeting these regulations often involves costly certifications, frequent audits, and complex system upgrades, which can slow down deployment and increase operational expenses. Companies must carefully navigate these requirements to ensure their DAQ solutions remain compliant and reliable.
Data Acquisition System Market Growth: COMMERCIAL USE CASES ACROSS INDUSTRIES
| COMPANY | USE CASE DESCRIPTION | BENEFITS |
|---|---|---|
 |
DAQ in R&D labs, aerospace testing, automotive diagnostics, and industrial automation for versatile and high-precision data collection | Highly customizable modular DAQ systems with extensive software integration (LabVIEW). Precise data acquisition, scalability, and ease of prototyping |
 |
DAQ is widely used in telecommunications, electronic device testing, and defense applications requiring detailed signal analysis and validation | High-performance DAQ with advanced signal processing and a wide frequency range. Accurate and reliable measurement with strong analytical tools |
 |
Applied in manufacturing process optimization, quality control, and materials testing for improved product reliability and efficiency | Integrated DAQ solutions with sensor and data analytics expertise | Enhanced data quality and actionable insights through real-time monitoring |
 |
Ideal for aerospace component testing, industrial machinery monitoring, and environmental data logging in harsh conditions | Rugged, reliable DAQ hardware with high-speed data streaming and real-time processing capabilities | Long lifecycle and easy integration |
 |
Energy, petrochemical, and process industries for continuous monitoring, safety management, and process optimization | Comprehensive DAQ and control systems with strong emphasis on accuracy and regulatory compliance | Advanced diagnostics and predictive maintenance |
Logos and trademarks shown above are the property of their respective owners. Their use here is for informational and illustrative purposes only.
DATA ACQUISITION (DAQ) SYSTEM MARKET SHARE ECOSYSTEM
The data acquisition system ecosystem involves identifying and analyzing interconnected relationships among various stakeholders, including R&D Centers and Institutes, manufacturers, and end users. R&D Centers and Institutes drive innovation by developing advanced DAQ technologies and testing methods for various applications. Manufacturers design and produce DAQ hardware and software systems tailored to industry-specific requirements. End users deploy DAQ systems in real-world environments to monitor, control, and optimize processes across industries.
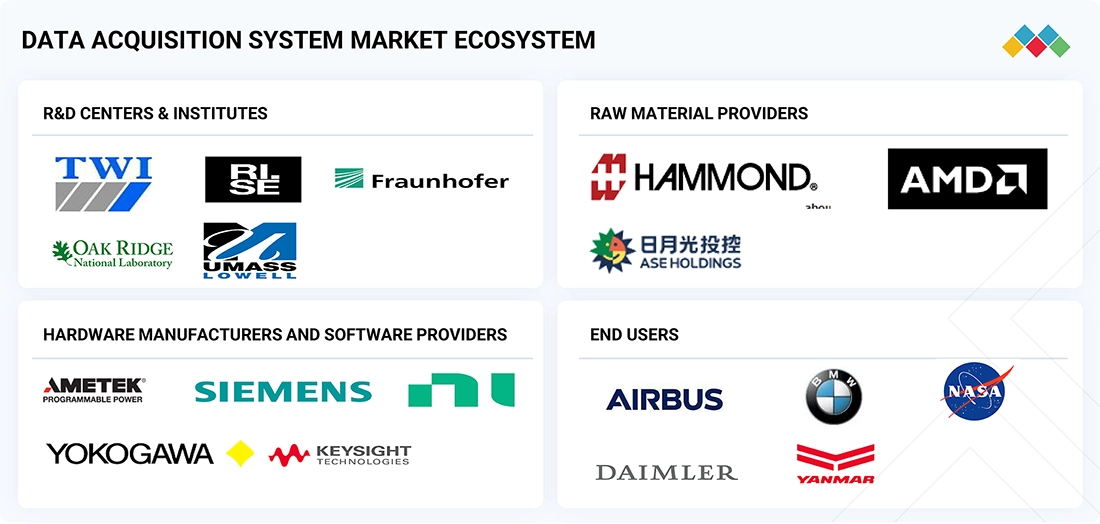
Logos and trademarks shown above are the property of their respective owners. Their use here is for informational and illustrative purposes only.
DATA ACQUISITION (DAQ) SYSTEM MARKET GROWTH SEGMENTS
Source: Secondary Research, Interviews with Experts, MarketsandMarkets Analysis
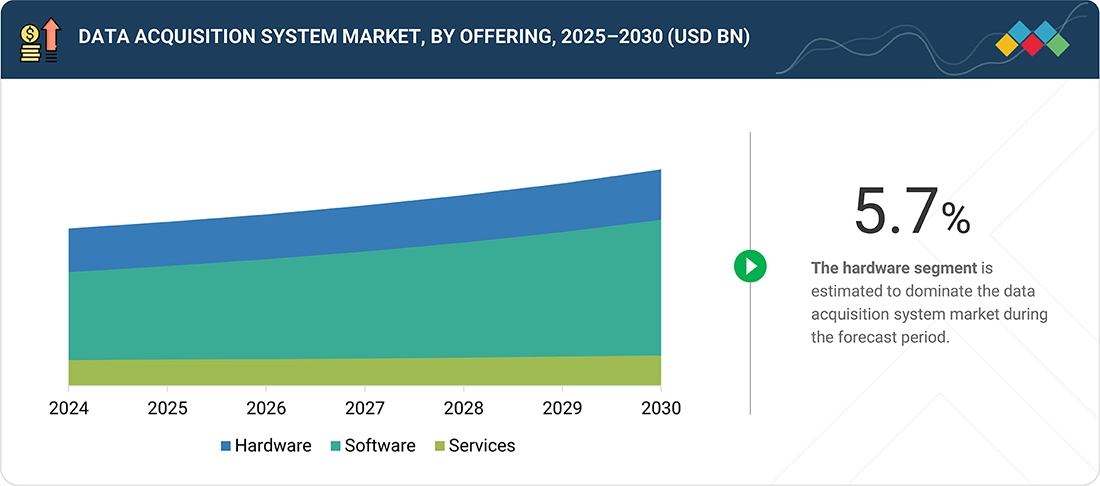
Data Acquisition System Market Trends, by Offering
Hardware is estimated to have the largest share in the DAQ market because it is essential for capturing and converting physical signals into digital data. The high demand for reliable, precise, and durable sensors, data loggers, and interface devices drives this dominance. Additionally, ongoing advancements in hardware technology support diverse applications across industries, sustaining strong market growth.
Data Acquisition System Market, by Speed
Speed below 100 KS/s is estimated to dominate the DAQ market because many industrial and testing applications require moderate-speed data capture rather than ultra-high-speed sampling. This range balances accuracy and cost-effectiveness, making it suitable for monitoring signals like temperature, pressure, and vibration where extremely fast data rates aren't necessary. It also simplifies system design and reduces data processing demands, appealing to a broad range of users.
Data Acquisition System Market, by Application
Testing leads the DAQ market because it's a critical phase in product development, quality assurance, and regulatory compliance across industries. DAQ systems are essential for capturing accurate data during performance, stress, and safety tests to validate designs and ensure reliability. The growing complexity of products, especially in aerospace, automotive, and electronics, further drives the need for advanced testing solutions..
Data Acquisition System Market, by Vertical
Aerospace & defense dominate the DAQ market due to their high demand for precision, reliability, and real-time data monitoring in mission-critical applications. These industries rely heavily on DAQ systems for rigorous testing, validation, and operational monitoring of complex systems like aircraft, satellites, and defense equipment. Strict regulatory standards and the need for advanced R&D further fuel their investment in high-performance DAQ solutions.
REGION
North America to hold the largest market share in the global data acquisition system market growth during the forecast period
North America is projected to be the largest in the DAQ market due to its strong presence of key industry players, advanced technological infrastructure, and high R&D investments. The region's leadership in aerospace, defense, automotive, and industrial automation drives consistent demand for high-performance DAQ systems. Strict regulatory standards and early adoption of emerging technologies further support market growth.
Data Acquisition System Market Trends: COMPANY EVALUATION MATRIX
In the DAQ market matrix, National Instruments Corp. (Star) leads with a strong global presence, modular hardware platforms, and powerful software like LabVIEW, enabling wide adoption across industries such as aerospace, automotive, and electronics testing. Ametek (Emerging Leader) is gaining momentum with its rugged, high-performance DAQ solutions tailored for harsh environments, especially in aerospace and industrial applications, making it a growing force in specialized data acquisition segments.
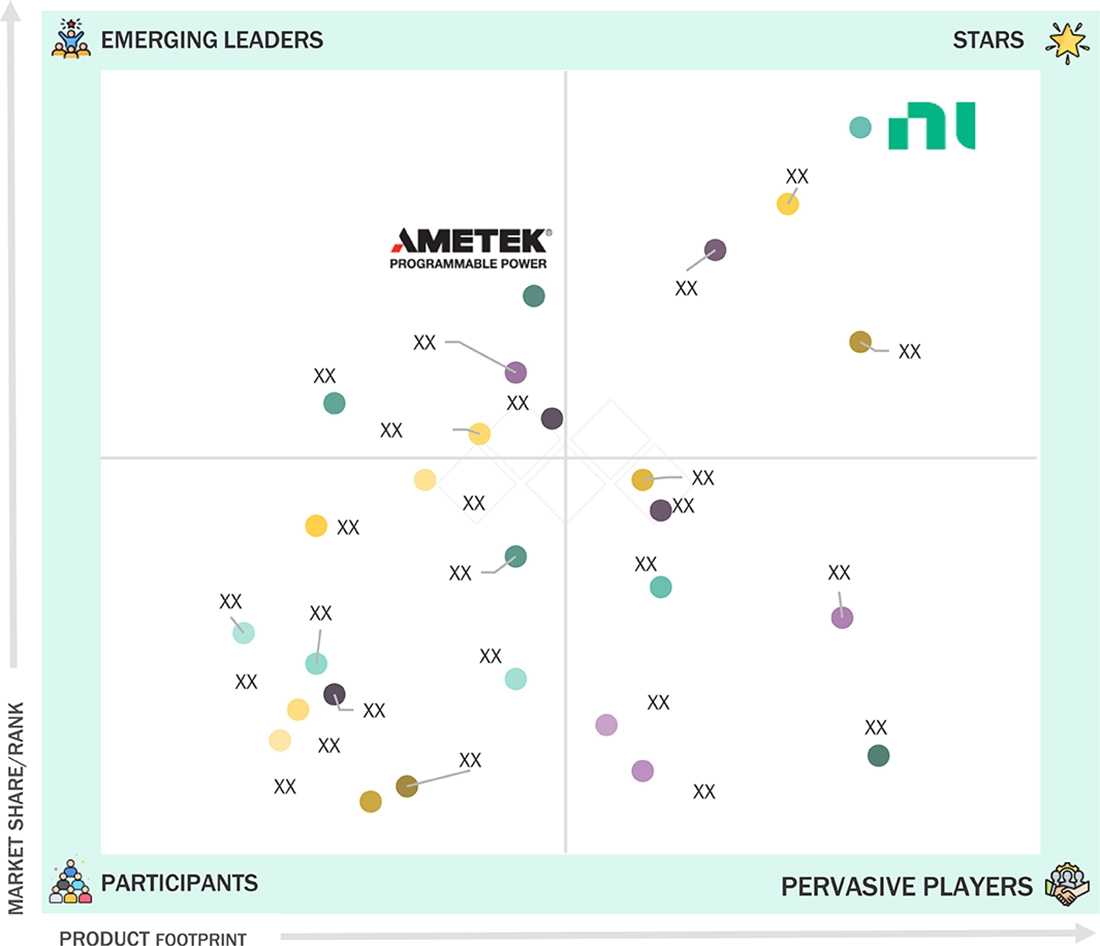
Source: Secondary Research, Interviews with Experts, MarketsandMarkets Analysis
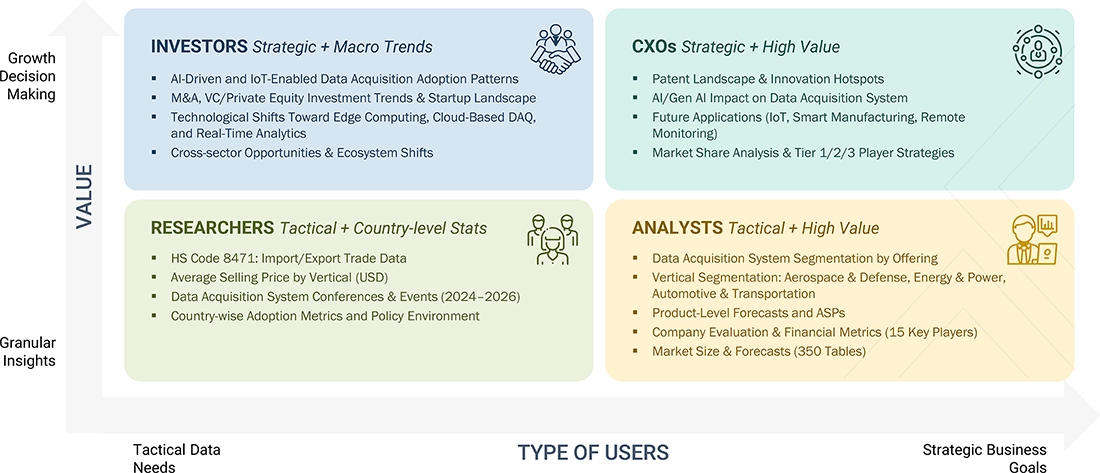
WHAT IS IN IT FOR YOU: Data Acquisition System Market REPORT CONTENT GUIDE
DELIVERED CUSTOMIZATIONS
We have successfully delivered the following deep-dive customizations:
| CLIENT REQUEST | CUSTOMIZATION DELIVERED | VALUE ADDS |
|---|---|---|
| Competitive Positioning of DAQ Vendors | Comparative profiling of key DAQ manufacturers and system integrators by product type, data accuracy, connectivity, and software analytics capabilities | Enabled clients to benchmark competitors and refine value propositions for target industries |
| Regulatory & Compliance Mapping | Assessment of standards and certification requirements (ISO, IEEE, CE, FCC) influencing DAQ system integration and interoperability in target markets | Reduced compliance-related entry risks and accelerated certification readiness |
| Emerging Technology Impact Analysis | Evaluation of how trends like IoT integration, cloud-based data logging, AI-driven signal analysis, and edge computing are shaping DAQ system design and demand | Guided R&D focus, futureproofed product portfolios, and enhanced digital competitiveness |
| Investment & Growth Opportunity Assessment | Identification of untapped verticals and application areas such as renewable energy monitoring, EV testing, and smart manufacturing | Informed strategic investments and improved ROI through focused expansion. |
RECENT DEVELOPMENTS
- February 2025 : Emerson, the parent company of NATIONAL INSTRUMENTS CORP , expanded its data acquisition (DAQ) portfolio with the introduction of the NI cDAQ-9187 and cDAQ-9183 Ethernet chassis, along with the NI 9204 input module. A GitHub repository for NI FlexLogger DAQ software plug-ins has been launched, offering cost-effective solutions for deploying high-performance test and measurement systems over Ethernet.
- September 2024 : Emerson expanded its NI USB data acquisition (DAQ) lineup with the new NI mioDAQ device. Designed to help engineers enhance quality and accelerate time-to-market for advanced electronic technologies, the solution delivers improved measurement performance, more powerful software, and a streamlined setup experience.
- July 2021 : ADLINK Technology Inc. expanded its MCM-210 standalone Ethernet DAQ series with the addition of the MCM-216 and MCM-218 models. Powered by ARM Cortex-A9 processors, these Ethernet DAQ modules featured 16 or 8 channels with 16-bit resolution, offering voltage or current input and operating as standalone edge devices without the need for a host PC.
Table of Contents
 Exclusive indicates content/data unique to MarketsandMarkets and not available with any competitors.
Methodology
The study used four major activities to estimate the market size of the data acquisition system. Exhaustive secondary research was conducted to gather information on the market and its peer and parent markets. The next step was to validate these findings, assumptions, and market size with industry experts across the value chain through primary research. Both top-down and bottom-up approaches were employed to estimate the total market size. Finally, market breakdown and data triangulation methods were used to estimate the market size for different segments and subsegments.
Secondary Research
In the secondary research process, various sources were used to identify and collect information on the data acquisition system market. Secondary sources for this research study include corporate filings (such as annual reports, investor presentations, and financial statements); trade, business, and professional associations; white papers; certified publications; and articles by recognized authors, directories, and databases. The secondary data was collected and analyzed to determine the overall market size, further validated through primary research.
List of key secondary sources
|
Source |
Web Link |
|
The International Organization of Motor Vehicle Manufacturers |
https://www.oica.net/ |
|
Energy Information Administration |
https://www.eia.gov/ |
|
Federal Aviation Administration |
https://www.faa.gov/ |
|
ASEAN Automotive Federation |
https://www.asean-autofed.com/ |
Primary Research
Primary interviews were conducted to gather insights on market statistics, revenue data, market breakdowns, size estimations, and forecasting. Additionally, primary research was used to comprehend various technologies, types, end uses, and regional trends. Interviews with stakeholders from the demand side, including CIOs, CTOs, CSOs, and customer/end-user installation teams using data acquisition system offerings and processes, were also conducted to understand their perspective on suppliers, products, component providers, and their current and future use of data acquisition system, which will impact the overall market. Several primary interviews were conducted across major countries in North America, Europe, Asia Pacific, and RoW.

To know about the assumptions considered for the study, download the pdf brochure
Market Size Estimation
In the complete market engineering process, top-down and bottom-up approaches and several data triangulation methods have been used to estimate and forecast the overall market segments and subsegments listed in this report. Key players in the market have been identified through secondary research, and their market shares in the respective regions have been determined through primary and secondary research. This entire procedure includes the study of annual and financial reports of the top market players and extensive interviews for key insights (quantitative and qualitative) with industry experts (CEOs, VPs, directors, and marketing executives).
All percentage shares, splits, and breakdowns have been determined using secondary sources and verified through primary sources. All the parameters affecting the markets covered in this research study have been accounted for, viewed in detail, verified through primary research, and analyzed to obtain the final quantitative and qualitative data. This data has been consolidated and supplemented with detailed inputs and analysis from MarketsandMarkets and presented in this report. The following figure represents this study's overall market size estimation process.
Data Acquisition System Market : Top-Down and Bottom-Up Approach

Data Triangulation
Once the overall size of the data acquisition system market was determined using the methods described above, it was divided into multiple segments and subsegments. Market engineering was performed for each segment and subsegment using market breakdown and data triangulation methods, as applicable, to obtain accurate statistics. Various factors and trends from the demand and supply sides were studied to triangulate the data. The market was validated using both top-down and bottom-up approaches.
Market Definition
A data acquisition system (DAQ) collects, measures, and analyzes data from various sources, such as sensors, instruments, or devices. It is crucial in scientific research, engineering, industrial automation, and medical monitoring. A typical DAQ system consists of sensors or transducers that convert physical phenomena (temperature, pressure, or force) into electrical signals. These signals are then conditioned through amplification and filtering to ensure accuracy.
Key Stakeholders
- Raw material vendors
- Component and hardware providers
- Sensor providers
- DAQ solution providers
- DAQ software providers
- System integrators
- Original equipment manufacturers (OEMs)/device manufacturers
- Technology standards organizations, forums, alliances, and associations
- Governments, financial institutions, and investment communities
- Research organizations
- Analysts and strategic business planners
- Venture capitalists, private equity firms, and startup companies
Report Objectives
- To describe and forecast the data acquisition system market size by offering, speed, application, vertical, and region, in terms of value
- To describe and forecast the market for various segments across four main regions, namely, North America, Europe, Asia Pacific, and RoW, in terms of value
- To describe and forecast the market by offering, in terms of volume
- To strategically analyze micromarkets with regard to individual growth trends, prospects, and contributions to the markets
- To provide detailed information regarding drivers, restraints, opportunities, and challenges influencing market growth
- To analyze opportunities for stakeholders by identifying high-growth segments in the market
- To provide a detailed overview of the data acquisition system value chain
- To strategically analyze key technologies, average selling price trends, trends impacting customer business, ecosystem, regulatory landscape, patent landscape, Porter's five forces, import and export scenarios, trade landscape, key stakeholders, buying criteria, and case studies pertaining to the market under study
- To strategically profile key players in the data acquisition system market and comprehensively analyze their market share and core competencies
- To analyze competitive developments such as partnerships, acquisitions, expansions, collaborations, and product launches, along with R&D in the data acquisition system market
Available Customizations
With the given market data, MarketsandMarkets offers customizations according to the specific requirements of companies. The following customization options are available for the report:
- Detailed analysis and profiling of additional market players (up to 5)
- Additional country-level analysis of the data acquisition system market
Product Analysis
- The product matrix provides a detailed comparison of the product portfolio of each company in the data acquisition system market.
Key Questions Addressed by the Report
What is the current market size of the global Data Acquisition System (DAQ) market?
The global Data Acquisition System market is estimated to reach USD 2.80 billion in 2025. Increasing demand for real-time data monitoring, industrial automation, testing, and measurement solutions is driving market adoption. (MarketsandMarkets)
What is the forecasted size of the Data Acquisition System market by 2030?
The Data Acquisition System market is projected to reach USD 3.73 billion by 2030, growing from USD 2.80 billion in 2025. (MarketsandMarkets)
What is the expected CAGR of the Data Acquisition System market during 2025–2030?
The global Data Acquisition System market is expected to grow at a CAGR of 5.9% from 2025 to 2030 due to increasing demand for accurate measurement, testing, and automation systems. (MarketsandMarkets)
What are the major growth drivers for the Data Acquisition System industry?
Key growth drivers include increasing focus on industrial automation, predictive maintenance, real-time monitoring, Industry 5.0 adoption, connected devices, advanced testing requirements, and demand for accurate data analysis. (MarketsandMarkets)
What are the key trends shaping the Data Acquisition System market?
Major trends include AI and IoT integration, cloud-based data acquisition, wireless DAQ systems, high-speed connectivity, remote monitoring, digital transformation, and advanced analytics for real-time decision-making. (MarketsandMarkets)
Which companies are the leading players in the Data Acquisition System market?
Major companies operating in the market include National Instruments Corporation, Keysight Technologies, Yokogawa Electric Corporation, Spectris, Honeywell International, Siemens, Emerson Electric, Teledyne Technologies, and HBM (HBK). (MarketsandMarkets)
Which industries are driving demand for Data Acquisition Systems?
Major industries adopting DAQ systems include aerospace & defense, automotive, industrial manufacturing, energy & power, healthcare, telecommunications, electronics, and research & development sectors. (MarketsandMarkets)
Which offering segment is expected to grow fastest in the Data Acquisition System market?
The software segment is expected to register the highest growth rate, with a projected CAGR of 6.8% during 2025–2030, driven by demand for advanced analysis, simulation, and data management capabilities. (MarketsandMarkets)
Which application segment dominates the Data Acquisition System market?
The testing application segment is expected to dominate the market due to increasing requirements for product validation, performance testing, quality control, and compliance across industries such as automotive and aerospace. (MarketsandMarkets)
Which region is expected to lead the Data Acquisition System market?
North America is expected to hold the largest market share. The region accounted for approximately 38.4% of the market share in 2024, supported by strong adoption of advanced testing technologies, aerospace programs, industrial automation, and presence of
Need a Tailored Report?
Customize this report to your needs
Get 10% FREE Customization
Customize This ReportPersonalize This Research
- Triangulate with your Own Data
- Get Data as per your Format and Definition
- Gain a Deeper Dive on a Specific Application, Geography, Customer or Competitor
- Any level of Personalization
Let Us Help You
- What are the Known and Unknown Adjacencies Impacting the Data Acquisition System Market
- What will your New Revenue Sources be?
- Who will be your Top Customer; what will make them switch?
- Defend your Market Share or Win Competitors
- Get a Scorecard for Target Partners

Custom Market Research Services
We Will Customise The Research For You, In Case The Report Listed Above Does Not Meet With Your Requirements
Get 10% Free CustomisationTESTIMONIALS

Tetsuya Ohhira
Business Development Manager-Technology Business
Nikon Corporation,
Leading Japanese MNC specializing in optics and imaging productswww.nikon.com
MarketsandMarkets™ response
is quick. Their attitude is flexible and positive. Analyst Insights are globally considered and
significant. Client Services quickly respond to our inquiry and demand. Their wide range of global
surveys help us make our strategic plan.
We hope Knowledge Store will be easier to search
for a report.
VP - Marketing & Business Development
Leading Provider of Process Control Solutions
We engaged with MarketsandMarkets on a study to perform an analysis and recommend a Go-To-Market strategy for metrology and process control in the semiconductor market. The study was tailored to our targets and needs with well-defined milestones. Our overall experience with the MarketsandMarkets team was very good throughout the project in all aspects including the analysis methodologies used, the quality and depth of primary and secondary data sets, the professionalism and flexibility of the team and the ability to meet the target schedule and milestones. We want to thank MarketsandMarkets team for a job well done.
Growth opportunities and latent adjacency in Data Acquisition System Market


Douglas
Apr, 2026
Is there a dedicated section on emerging technologies impacting the data acquisition system market?.
Richard
Apr, 2026
I appreciate the detailed regional segmentation it really helps in understanding market dynamics..