Digital Agriculture Market by Technology (Peripheral and Core), Type (Hardware and Software), Operation (Farming & Feeding, Monitoring & Scouting, and Marketing & Demand Generation), Operation and Region - Global Forecast to 2027
[303 Pages Report] The global digital agriculture market is estimated to be valued at USD 18.0 billion in 2022. It is projected to reach USD 29.8 billion by 2027, at a CAGR of 10.5%, in terms of value, between 2022 and 2027. The advancement in technology, minimizing wastage and efficient use of resources, yield maximization, and strategic governmental policy are increasing awareness about digital agriculture and helping in increasing adoption. These are some of the key trends in the global digital agriculture market due to which the market is expected to grow.
To know about the assumptions considered for the study, Request for Free Sample Report
Digital Agriculture Market Dynamics
Drivers: Increasing initiatives by the government and key players operating in the digital agriculture market
The growth of the farm management software market is driven by the increasing agricultural activities and the growing need for real-time data for decision-making. In April 2019, Precision Hawk launched PrecisionAnalytics. Some of the start-ups in North America have also invested in developing software that would cater to the digital agriculture market. The US Global Development Lab and Bureau Food Security together joined hands for “Digital Development for Feed the Future, wherein they are demonstrating digital tools that can holistically leverage cost-effective agricultural practice. The European Commission 2020 launched Horizon Europe Program, under which research and innovation are key driving factors.
Restraints: Large number of fragmented lands
Developing countries such as India, China, and Africa account for many fragmented farmlands. Most farmers in these countries do not have access to fundamental farming technologies, such as yield monitoring, guidance technology, and variable rate technology. The fragmented nature of the digital agriculture industry makes it difficult to implement a standardized solution. Land fragmentation leads to an improper allocation of input and resources, which further leads to high costs.
Opportunities: Early detection of crop diseases and ease of farm management to further boost the market
The demand for automation in the livestock industry is increasing significantly to increase productivity, improve farm management, tackle the challenge of high labor costs, and address the need for real-time analysis and better decision-making. Automation has become necessary for modern-day operations, and the integration of AI and IoT in daily farming activity is impacting the efficiency and output of farm operations. The availability of real-time information leads to timely decisions, thereby reducing operations costs.
Challenges: Growing concerns regarding data management
Data management is the key to making smart farm management decisions and improving farm operations. The data is collected in a raw format, processed by context, relevance, and priority, and it is then presented in a manner that can be used to make decisions. Data management is a major challenge faced by farmers and other stakeholders in the digital agriculture market. The data obtained is crucial as it helps farmers and other stakeholders in the value chain to make productive decisions. Many growers or farmers are unaware of the effective use of data for decision-making purposes. Hence, it is essential to provide farmers and growers with proper data management tools and techniques.
By technology, the core technology segment is projected to grow at the highest CAGR in the digital agriculture market during the forecast period
Based on the technologies, the core technology segment is estimated to occupy the second-largest market share in 2022, in terms of value, and it is also projected to grow at the highest CAGR in the digital agriculture market. Digital agriculture involves optimized management of inputs such as robotics, drones, and AI in a farm according to its need. Factors facilitating the growth in the core technologies include the rising use of aerial imagery sensors, satellite imaging, hyperspectral imaging devices, big data and advanced analytics, and predictive farming techniques.
By type, the software segment holds the second-largest share in the digital agriculture market
Based on types, the software segment is expected to grow and occupy the second-largest market share in terms of value. Software has become one of the essential elements of digital agriculture and is used to interpret and analyze the gathered data. The use of software allows farmers to monitor and take control of their fields through smartphones, desktops, and laptops, eliminating field trips. This helps in saving time and additional analysis tools help derive information between yields, soil testing information, and application data.
By operations, the monitoring & scouting segment is projected to grow at the highest CAGR during the forecast period
By operations, the monitoring & scouting segment is projected to grow at the highest CAGR by 2027 in the digital agriculture market. Monitoring and scouting allow farmers and other stakeholders to remotely capture any disruption in the farm activity. The sensing and imagery use advanced sensors and drone imagery to provide remote sensing solutions to the growers. Traditionally, crop scouting involved walking and taking measurements in the fields; currently, crop scouting uses more sophisticated devices, such as a GPS receiver on a vehicle, which maneuvers through the fields marking field-specific information on pests and crop injury.
By offering, the advisory services segment is projected to grow at the highest CAGR in the digital agriculture market
Based on offerings, the advisory services segment is estimated to grow at the highest CAGR in terms of value in the digital agriculture market. Companies or farmers/agronomists outsource the responsibility of handling field-related operations to service providers. These service providers take care of most operations and provide suggestions to farmers to enhance production. Advisory services help generate records and integrate the unstructured data acquired by growers to improve and enhance their decisions.
To know about the assumptions considered for the study, download the pdf brochure
Asia Pacific is the fastest-growing region at a significant CAGR in the digital agriculture market
Increasing modernization in the agriculture industry is a major factor driving the region's growth. The region is dominated by agricultural-dependent countries such as India, China, and Bangladesh. China occupies the largest market share in the Asia Pacific digital agriculture market. The country is set to increase investment in its domestic agricultural industry from several technologies, from AI farming technology to auto-steering, sensors, and drones. Using these technologies helps optimize farm operations and increase agricultural output and profitability of the region.
Key Market Players:
Key players in this market include CISCO Systems, Inc. (US), IBM Corporation (US), Accenture (Ireland), Deere & Company (US), Trimble INC. (US), DeLaval (Sweden), AKVA Group (Norway), Hexagon AB (Sweden), DJI (China), Epicor Software Corporation (US), Vodafone Group PLC. (UK), Bayer Cropscience AG (Germany), TELUS AGRICULTURE (Canada), Small Robot Company (England), Zemdirbiu Konsultacijos UAB (England), Raven Industries (US), Gamaya (Switzerland), AGCO Corporation (US), PrecisionHawk (US), Agreena (Denmark), Ceres Imaging (US), Agricultural Consulting Services (US), EC2CE (Spain), Eurofins Scientific (France), and Arable (US).
Get online access to the report on the World's First Market Intelligence Cloud
- Easy to Download Historical Data & Forecast Numbers
- Company Analysis Dashboard for high growth potential opportunities
- Research Analyst Access for customization & queries
- Competitor Analysis with Interactive dashboard
- Latest News, Updates & Trend analysis
Request Sample Scope of the Report
Get online access to the report on the World's First Market Intelligence Cloud
- Easy to Download Historical Data & Forecast Numbers
- Company Analysis Dashboard for high growth potential opportunities
- Research Analyst Access for customization & queries
- Competitor Analysis with Interactive dashboard
- Latest News, Updates & Trend analysis
Report Metric |
Details |
Market Size Value in 2022 | USD 18.0 billion |
Market Size Value in 2027 | USD 29.8 billion |
Market Growth Rate | 10.5% |
Estimated Year | 2022 |
Market size estimation | 2019–2027 |
Base year considered | 2021 |
Forecast period considered | 2022–2027 |
Units considered | Value (USD Million/USD Billion) |
Segments Covered | Technology, type, operation, offering, and region |
Regions covered | North America, Europe, Asia Pacific, South America, and RoW |
Market Growth Drivers | The advancement in technology, minimizing wastage and efficient use of resources, yield maximization, and strategic governmental policy are increasing awareness about digital agriculture and helping in increasing adoption |
Market Opportunities | Early detection of crop diseases and ease of farm management to further boost the market |
Largest Growing Region | Asia Pacific |
Companies studied |
|
Target Audience:
- Agriculture Equipment Component Suppliers
- Electronics Component and Device Manufacturers
- Original Equipment Manufacturers (OEMs)
- Product Manufacturers
- Agriculture Component and Device Suppliers and Distributors
- Software, Service, and Technology Providers
- Standardization and Testing Firms
- Government Bodies such as Regulatory Authorities and Policymakers
- Associations, Organizations, Forums, and Alliances Related to Semiconductor and Automotive Industries
- Research Institutes and Organizations
- Market Research and Consulting Firms
- Agri-food Buyers
Report Scope:
This research report categorizes the digital agriculture market based on technology, type, operation, offering, and region.
By Technology
-
Peripheral technologies
- Platforms
- Apps
-
Core technologies
- Automation
- Robotics
- Drones
- AI-ML
By Type
-
Hardware
-
Automation and control systems
- Drones/UAVs
- Irrigation controllers
- Global Positioning Systems (GPS)/ GNSS device
- Flow and application control devices
- Guidance and steering systems
- Handheld mobile devices/handheld computers
- Displays
- Harvesters & forwarders
- Variable rate controllers
- Control systems
- Robotics hardware
- HVAC systems
- LED grow lights
- Others
-
Sensing and monitoring device
- Yield monitor
- Soil sensors
- Water sensors
- Climate sensors
- Camera systems
- RFID and sensors for precision forestry
- Temperature and environmental monitoring sensors
- pH and dissolved oxygen sensors
- EC sensors
- RFID tags & readers for livestock monitoring
- Sensors for livestock monitoring
- Sensors for smart greenhouse
-
Automation and control systems
-
Software
- On-cloud
- On-premises
- AI and data analytics
-
Service
- System integration and consulting
- Managed services
- Connectivity services
- Assistant professional services
- Maintenance and support services
By Operation
-
Farming and feeding
- Precision agriculture
- Precision animal rearing and feeding
- Precision aquaculture
- Precision forestry
- Smart greenhouse
- Monitoring and scouting
- Marketing and demand generation
By Offering
- Advisory services
- Precision agriculture and farm management
- Quality management and traceability
- Digital procurement
- Agri eCommerce
- Financial services
By Region
- North America
- Europe
- Asia Pacific
- South America
- Rest of the World
Recent Developments
- In June 2021, Deere & Company (US) partnered with Mobile Track Solution (US) to provide digital solutions for precision farming. Under this, Mobile Track Solutions provided John Deere & Company with greater than 27 cubic yard capacity towed scrapers for its distribution channels. This will help improve earthmoving efficiency and precision in large-scale applications.
- In April 2020, Trimble partnered with HORSCH (Germany) to develop automation solutions for the agriculture industry. HORSCH and Trimble, in collaboration, will focus on developing solutions, including autonomous machines and workflow management systems that improve farm productivity.
- In January 2020, IBM (US) and Yara International (Norway), a global leader in crop nutrition and digital farming solutions, invited farmer associations, industry players, academia, and NGOs from the food and agriculture industry to collaborate on developing digital agricultural solutions such as open data exchange platform for improving field efficiency, transparency, and sustainability of global food production.
Frequently Asked Questions (FAQ):
How big is the digital agriculture market?
Digital agriculture market is projected to generate USD 29.8 billion revenue by 2027.
What are the components of digital agriculture?
The components of digital agriculture are AI and data analytics, remote sensing, Internet of Things (IoT).
Which are the major digital agriculture market technology considered in this study, and which segments are projected to have promising growth rates in the future?
All the major digital agriculture market technology, such as peripheral and core technologies, are considered in the scope of the study. Peripheral currently accounts for a dominant share in the digital agriculture market, and the segment is projected to experience a significant growth rate in the next five years due to its application as a major technology in the digital agriculture market.
I am interested in the Asia Pacific market for peripheral and core segments. Is customization available for the same? What all information would be included in the same?
Yes, customization for the Asia Pacific market for various segments can be provided on various aspects, including market size, forecast, market dynamics, company profiles, and competitive landscape. Exclusive insights on below Asia Pacific countries will be provided:
- China
- Japan
- Australia & New Zealand
- India
- Rest of Asia Pacific (Thailand, Vietnam, the Philippines, and Bangladesh)
Also, you can let us know if there are any other countries of your interest
What are some drivers fueling the growth of the digital agriculture market?
Global digital agricultural market is characterized by the following drivers:
Drivers: Optimization of farm management by using agricultural services and software integration to drive the market
Digital agriculture is currently in practice to optimize the available resources with extreme efficiency. Digifarming is an integration of precision farming and smart agriculture, which is achieved through hardware and software implementation. To precisely operate these devices and software and increase their outcome, farmers opt for different services that help them enhance the farm output. Digital agriculture can be either through installing smart devices, a part of the Internet of Things (IoT) or through Software as a Service (SaaS). Software as a Service is more of an economical way, as it makes companies invest and learn in ML and software monitoring for performing predictive analysis and delivering customized reports. Some companies are becoming one-stop solutions for driving farm management, traceability, sales management, and risk management in the Agri sector.
I am interested in understanding the research methodology on how you arrived at the market size and segmental splits before making a purchase decision. Can you provide me with an explanation on the same?
Yes, a detailed explanation of the research methodology can be provided over a scheduled call; it will also enable us to explain all your queries in detail. For a brief overview and knowledge: Multiple approaches have been adopted to understand the holistic view of this market, including:
- Bottom-up approach
- Top-down approach (Based on the global market)
- Primary interviews with industry experts
- Data triangulation
What kind of information is provided in the competitive landscape section?
For the list of the below-mentioned players, company profiles provide insights such as a business overview covering information on the company’s business segments, financials, geographic presence, revenue mix, and business revenue mix. The company profiles section also provides information on product offerings, key developments associated with the company, SWOT analysis, and MnM view to elaborate analyst view on the company. Some of the key players in the market are CISCO Systems, Inc. (US), IBM Corporation (US), Accenture (Ireland), Deere & Company (US), Trimble INC. (US), DeLaval (Sweden), AKVA Group (Norway), Hexagon AB (Sweden), DJI (China), Epicor Software Corporation (US), Vodafone Group PLC. (UK), Bayer Cropscience AG (Germany), TELUS AGRICULTURE (Canada), Small Robot Company (England), Zemdirbiu Konsultacijos UAB (England), Raven Industries (US), Gamaya (Switzerland), AGCO Corporation (US), PrecisionHawk (US), Agreena (Denmark), Ceres Imaging (US), Agricultural Consulting Services (US), EC2CE (Spain), Eurofins Scientific (France), and Arable (US). . . .
To speak to our analyst for a discussion on the above findings, click Speak to Analyst
TABLE OF CONTENTS
1 INTRODUCTION (Page No. - 37)
1.1 STUDY OBJECTIVES
1.2 MARKET DEFINITION
1.3 STUDY SCOPE
FIGURE 1 DIGITAL AGRICULTURE MARKET SEGMENTATION
FIGURE 2 REGIONAL SEGMENTATION
1.4 YEARS CONSIDERED
1.5 CURRENCY CONSIDERED
TABLE 1 USD EXCHANGE RATES, 2018–2021
1.6 INCLUSIONS AND EXCLUSIONS
1.7 STAKEHOLDERS
1.8 LIMITATIONS
2 RESEARCH METHODOLOGY (Page No. - 44)
2.1 RESEARCH DATA
FIGURE 3 DIGITAL AGRICULTURE MARKET: RESEARCH DESIGN
2.1.1 SECONDARY DATA
2.1.1.1 Key data from secondary sources
2.1.2 PRIMARY DATA
2.1.2.1 Primary interviews with experts
2.1.2.2 List of key primary interview participants
2.1.2.3 Key data from primary sources
2.1.2.4 Breakdown of primary interviews
2.1.2.5 Key primary insights
2.2 MARKET SIZE ESTIMATION
FIGURE 4 APPROACH ONE: BOTTOM-UP (DEMAND SIDE)
FIGURE 5 APPROACH ONE: BOTTOM-UP (SUPPLY SIDE)
FIGURE 6 APPROACH TWO: TOP-DOWN (BASED ON GLOBAL MARKET)
2.3 DATA TRIANGULATION
FIGURE 7 DATA TRIANGULATION
2.4 RESEARCH ASSUMPTIONS
3 EXECUTIVE SUMMARY (Page No. - 53)
TABLE 2 DIGITAL AGRICULTURE MARKET SNAPSHOT, 2022 VS. 2027
FIGURE 8 MARKET, BY TYPE, 2022 VS. 2027 (USD MILLION)
FIGURE 9 MARKET, BY OPERATION, MARKET SHARE 2022
FIGURE 10 MARKET, BY OFFERING, 2022 VS. 2027 (USD MILLION)
FIGURE 11 MARKET, BY TECHNOLOGY, 2022 VS. 2027 (USD MILLION)
FIGURE 12 MARKET SHARE (VALUE), BY REGION, 2021
4 PREMIUM INSIGHTS (Page No. - 58)
4.1 ATTRACTIVE OPPORTUNITIES FOR DIGITAL AGRICULTURE MARKET PLAYERS
FIGURE 13 HIGH ADOPTION OF DIGITAL AGRICULTURE IN DEVELOPING MARKETS TO ESCALATE MARKET GROWTH
4.2 NORTH AMERICA: DIGITAL AGRICULTURE MARKET, BY TECHNOLOGY & COUNTRY
FIGURE 14 US TO ACCOUNT FOR LARGEST SHARE IN NORTH AMERICAN MARKET IN 2021
4.3 MARKET, BY TYPE
FIGURE 15 DIGITAL AGRICULTURE HARDWARE TO DOMINATE DURING FORECAST PERIOD
4.4 MARKET, BY OPERATION
FIGURE 16 FARMING & FEEDING OPERATIONS TO DOMINATE IN 2022
4.5 MARKET, BY OFFERING
FIGURE 17 PRECISION AGRICULTURE & FARM MANAGEMENT SEGMENT TO DOMINATE MARKET DURING FORECAST PERIOD
4.6 DIGITAL AGRICULTURE MARKET, BY TECHNOLOGY
FIGURE 18 PERIPHERAL TECHNOLOGIES TO DOMINATE MARKET DURING FORECAST PERIOD
4.7 DIGITAL AGRICULTURE MARKET, BY APPLICATION & REGION
FIGURE 19 ASIA PACIFIC TO DOMINATE MARKET DURING FORECAST PERIOD
5 MARKET OVERVIEW (Page No. - 62)
5.1 INTRODUCTION
5.1.1 MACROECONOMIC FACTORS
FIGURE 20 SMARTPHONE PENETRATION, BY REGION, 2019 VS 2025
FIGURE 21 GLOBAL GNSS DEMAND, 2021 VS 2031 (EUR BILLION)
5.2 MARKET DYNAMICS
FIGURE 22 DIGITAL AGRICULTURE MARKET DYNAMICS
5.2.1 DRIVERS
5.2.1.1 Demand for optimization of farm management using agricultural services and software integration
5.2.1.2 Increase in initiatives by government and key players operating in market
5.2.1.3 Growth in concerns regarding ecosystem change
5.2.2 RESTRAINTS
5.2.2.1 Lack of technical knowledge and training activities
5.2.2.2 Large number of fragmented lands in developing countries
5.2.3 OPPORTUNITIES
5.2.3.1 Increase in use of agricultural-based software via smartphones
5.2.3.2 Early detection of crop diseases and ease of farm management
5.2.4 CHALLENGES
5.2.4.1 High cost of devices and software to impact adoption among small-scale farmers
5.2.4.2 Rise in concerns regarding data management and requirement for adequate training
6 INDUSTRY TRENDS (Page No. - 68)
6.1 INTRODUCTION
6.2 CURRENT LANDSCAPE OF AGRICULTURAL INDUSTRY
6.3 VALUE CHAIN ANALYSIS
6.3.1 RESEARCH & DEVELOPMENT
6.3.2 DEVICE & COMPONENT MANUFACTURERS
6.3.3 SYSTEM INTEGRATORS
6.3.4 SERVICE PROVIDERS
6.3.5 END USERS
FIGURE 23 VALUE CHAIN ANALYSIS: DIGITAL AGRICULTURE MARKET
6.4 TECHNOLOGY ANALYSIS
6.4.1 ARTIFICIAL INTELLIGENCE
6.4.1.1 Crop yield productions & price forecasts
6.4.2 IOT
6.4.3 UNMANNED AERIAL VEHICLES
6.5 ECOSYSTEM MAPPING: DIGITAL AGRICULTURE MARKET
6.5.1 DEMAND SIDE
6.5.2 SUPPLY SIDE
FIGURE 24 MARKET: ECOSYSTEM
TABLE 3 MARKET: SUPPLY CHAIN (ECOSYSTEM)
6.6 TRENDS IMPACTING BUYERS
FIGURE 25 DIGITAL AGRICULTURE MARKET: TRENDS IMPACTING BUYERS
6.7 PATENT ANALYSIS
FIGURE 26 NUMBER OF PATENTS GRANTED BETWEEN 2012 AND 2022
TABLE 4 PATENTS PERTAINING TO DIGITAL AGRICULTURE, 2020–2022
6.8 PRICING ANALYSIS
TABLE 5 AVERAGE SELLING PRICE (ASP) FOR ROV SYSTEM COMPONENTS, BY PRODUCT, 2022 VS. 2027 (USD/PIECE)
TABLE 6 ASP OF AQUACULTURE SENSORS, 2022 (USD/UNIT)
TABLE 7 ASP OF MILKING ROBOTS, 2022 VS. 2027 (USD/UNIT)
TABLE 8 ASP OF RFID TAGS & READERS, 2022 VS. 2027 (USD/UNIT)
6.9 TRADE DATA
TABLE 9 IMPORT DATA OF AGRICULTURAL MACHINERY, BY COUNTRY, 2019–2021 (USD MILLION)
TABLE 10 EXPORT DATA OF AGRICULTURAL MACHINERY, BY COUNTRY, 2019–2021 (USD MILLION)
6.9.1 GNSS DEVICES SHIPMENT
FIGURE 27 GLOBAL GNSS DEVICES SHIPMENT, BY REGION, 2021–2031 (MILLION)
6.10 KEY CONFERENCES & EVENTS
TABLE 11 KEY CONFERENCES & EVENTS, 2022–2023
6.11 PORTER’S FIVE FORCES ANALYSIS
TABLE 12 DIGITAL AGRICULTURE MARKET: PORTER’S FIVE FORCES ANALYSIS
6.11.1 THREAT FROM NEW ENTRANTS
6.11.2 THREAT FROM SUBSTITUTES
6.11.3 BARGAINING POWER OF SUPPLIERS
6.11.4 BARGAINING POWER OF BUYERS
6.11.5 DEGREE OF COMPETITION
6.12 CASE STUDIES
6.12.1 INTERNAL PROCESS IMPROVEMENTS WITH DIGITAL AGRICULTURE
6.12.2 ANNA BINNA FARMS USED AGWORLD SOFTWARE PLATFORM FOR FARM RECORD-KEEPING
6.13 BUYING CRITERIA
6.13.1 BUYING CRITERIA ACROSS TYPES
FIGURE 28 KEY BUYING CRITERIA FOR DIGITAL AGRICULTURE TYPES
TABLE 13 KEY BUYING CRITERIA FOR DIGITAL AGRICULTURE TYPES
7 REGULATORY FRAMEWORK (Page No. - 91)
7.1 TARIFF & REGULATORY LANDSCAPE
TABLE 14 NORTH AMERICA: REGULATORY BODIES, GOVERNMENT AGENCIES, AND OTHER ORGANIZATIONS
TABLE 15 EUROPE: REGULATORY BODIES, GOVERNMENT AGENCIES, AND OTHER ORGANIZATIONS
TABLE 16 ASIA PACIFIC: REGULATORY BODIES, GOVERNMENT AGENCIES, AND OTHER ORGANIZATIONS
TABLE 17 REST OF THE WORLD: REGULATORY BODIES, GOVERNMENT AGENCIES, AND OTHER ORGANIZATIONS
7.1.1 NORTH AMERICA
7.1.1.1 United States (US)
TABLE 18 US: ROBOTICS FOR AGRICULTURAL AND INDUSTRIAL USE
7.1.1.2 Canada
TABLE 19 CANADA: ROBOTIC MACHINERY AND ROBOT USAGE
7.1.1.3 Mexico
TABLE 20 MEXICO: DRONE CATEGORIES
7.1.2 EUROPEAN UNION (EU)
TABLE 21 EU: DRONE FLYING BASED ON INTENDED OPERATIONS
TABLE 22 EUROPE: AGRICULTURAL MACHINERY AND ROBOT PRODUCTION STANDARDS
7.1.3 ASIA PACIFIC
7.1.3.1 India
7.1.3.2 China
TABLE 23 CHINA: ARTICLES REGARDING AGRICULTURAL TECHNOLOGIES
TABLE 24 CHINA: DRONE CLASSIFICATION BASED ON WEIGHT
7.1.3.3 Australia
7.1.4 REST OF THE WORLD
8 DIGITAL AGRICULTURE MARKET, BY OFFERING (Page No. - 102)
8.1 INTRODUCTION
FIGURE 29 PRECISION AGRICULTURE & FARM MANAGEMENT TO DOMINATE DURING FORECAST PERIOD
TABLE 25 DIGITAL AGRICULTURE MARKET, BY OFFERING, 2019–2021 (USD MILLION)
TABLE 26 MARKET, BY OFFERING, 2022–2027 (USD MILLION)
8.2 ADVISORY SERVICES
8.2.1 ADVISORY SERVICES PROMOTE ADOPTION OF IMPROVED FARM TECHNOLOGIES
TABLE 27 ADVISORY SERVICES MARKET, BY REGION, 2019–2021 (USD MILLION)
TABLE 28 ADVISORY SERVICES MARKET, BY REGION, 2022–2027 (USD MILLION)
8.3 PRECISION AGRICULTURE & FARM MANAGEMENT
8.3.1 INCREASE IN DATA MANAGEMENT SERVICES TO IMPROVE DECISION-MAKING FOR SMART FARMS
TABLE 29 PRECISION AGRICULTURE & FARM MANAGEMENT MARKET, BY REGION, 2019–2021 (USD MILLION)
TABLE 30 PRECISION AGRICULTURE & FARM MANAGEMENT MARKET, BY REGION, 2022–2027 (USD MILLION)
8.4 QUALITY MANAGEMENT & TRACEABILITY
8.4.1 INNOVATION OF DIGI-LED DATA TO ENHANCE QUALITY MANAGEMENT OF FARMS
TABLE 31 QUALITY MANAGEMENT & TRACEABILITY MARKET, BY REGION, 2019–2021 (USD MILLION)
TABLE 32 QUALITY MANAGEMENT TRACEABILITY MARKET, BY REGION, 2022–2027 (USD MILLION)
8.5 DIGITAL PROCUREMENT
8.5.1 PRODUCTION TRENDS THROUGH DIGITAL PROCUREMENT TO BOOST MARKET GROWTH
TABLE 33 DIGITAL PROCUREMENT MARKET, BY REGION, 2019–2021 (USD MILLION)
TABLE 34 DIGITAL PROCUREMENT MARKET, BY REGION, 2022–2027 (USD MILLION)
8.6 AGRI ECOMMERCE
8.6.1 GROWTH IN AGRICULTURAL PRODUCE POPULARITY ON ECOMMERCE PLATFORMS
TABLE 35 AGRI ECOMMERCE MARKET, BY REGION, 2019–2021 (USD MILLION)
TABLE 36 AGRI ECOMMERCE MARKET, BY REGION, 2022–2027 (USD MILLION)
8.7 FINANCIAL SERVICES
8.7.1 INCREASE IN DEMAND FOR DIGITAL AGRICULTURE PAYMENT SERVICES TO BOOST MARKET GROWTH
TABLE 37 FINANCIAL SERVICES MARKET, BY REGION, 2019–2021 (USD MILLION)
TABLE 38 FINANCIAL SERVICES MARKET, BY REGION, 2022–2027 (USD MILLION)
9 DIGITAL AGRICULTURE MARKET, BY TECHNOLOGY (Page No. - 112)
9.1 INTRODUCTION
FIGURE 30 PERIPHERAL TECHNOLOGY TO DOMINATE DIGITAL AGRICULTURE MARKET DURING FORECAST PERIOD
TABLE 39 DIGITAL AGRICULTURE MARKET, BY TECHNOLOGY, 2019–2021 (USD MILLION)
TABLE 40 MARKET, BY REGION, 2022–2027 (USD MILLION)
TABLE 41 PERIPHERAL DIGITAL AGRICULTURE TECHNOLOGY MARKET, BY TYPE, 2019–2021 (USD MILLION)
TABLE 42 PERIPHERAL DIGITAL AGRICULTURE TECHNOLOGY MARKET, BY TYPE, 2022–2027 (USD MILLION)
TABLE 43 CORE DIGITAL AGRICULTURE TECHNOLOGY MARKET, BY TYPE, 2019–2021 (USD MILLION)
TABLE 44 CORE DIGITAL AGRICULTURE TECHNOLOGY MARKET, BY TYPE, 2022–2027 (USD MILLION)
9.2 PERIPHERAL TECHNOLOGY
9.2.1 PRECISION AGRICULTURE SOLUTIONS PROVIDE HIGH-VALUE INSIGHTS TO MAKE REAL-TIME DECISIONS
9.2.2 PLATFORMS
9.2.2.1 Platforms help farmers develop future field plans
9.2.3 APPS
9.2.3.1 Greater penetration of mobile devices in emerging economies to drive segment
TABLE 45 PERIPHERAL DIGITAL AGRICULTURE TECHNOLOGY MARKET, BY REGION, 2019–2021 (USD MILLION)
TABLE 46 PERIPHERAL DIGITAL AGRICULTURE TECHNOLOGY MARKET, BY REGION, 2022–2027 (USD MILLION)
9.3 CORE TECHNOLOGY
9.3.1 INCREASE IN APPLICATION OF CORE TECHNOLOGIES IN REDUCING ENVIRONMENTAL IMPACT TO BOOST MARKET
9.3.2 AUTOMATION
9.3.2.1 Automation technology to increase yield and rate of farm production
9.3.3 DRONES
9.3.3.1 Ability of drones to survey crops and herds over vast areas to drive demand
9.3.4 ROBOTICS
9.3.4.1 Reduction in manual labor in farm activities to boost market
9.3.5 AI/ML
9.3.5.1 Real-time actionable insights to improve agriculture yield to boost segment
TABLE 47 CORE DIGITAL AGRICULTURE TECHNOLOGY MARKET, BY REGION, 2019–2021 (USD MILLION)
TABLE 48 CORE DIGITAL AGRICULTURE TECHNOLOGY MARKET, BY REGION, 2022–2027 (USD MILLION)
10 DIGITAL AGRICULTURE MARKET, BY OPERATION (Page No. - 121)
10.1 INTRODUCTION
TABLE 49 DIGITAL AGRICULTURE MARKET, BY OPERATION, 2019–2021 (USD MILLION)
TABLE 50 MARKET, BY OPERATION, 2022–2027 (USD MILLION)
10.2 FARMING & FEEDING
10.2.1 INCREASE IN DEMAND FOR MONITORING OF FARMING AND FEEDING SYSTEMS TO DETERMINE CROP AND LIVESTOCK HEALTH
TABLE 51 FARMING & FEEDING OPERATIONS MARKET, BY REGION, 2019–2021 (USD MILLION)
TABLE 52 FARMING & FEEDING OPERATIONS MARKET, BY REGION, 2022–2027 (USD MILLION)
10.2.2 PRECISION AGRICULTURE
10.2.2.1 Trend of using technology to improve agricultural yield to drive market
10.2.3 PRECISION ANIMAL REARING AND FEEDING
10.2.3.1 Growth in importance of animal health to propel segment
10.2.4 PRECISION AQUACULTURE
10.2.4.1 Adoption of technology to enhance aquaculture operations to drive demand
10.2.5 PRECISION FORESTRY
10.2.5.1 Ease of forestry operations and improved efficiency to drive segment
10.2.6 SMART GREENHOUSES
10.2.6.1 Use of technology to further improve smart agriculture operations to boost market growth
TABLE 53 FARMING & FEEDING OPERATIONS MARKET, BY TYPE, 2019–2021 (USD MILLION)
TABLE 54 FARMING & FEEDING OPERATIONS MARKET, BY TYPE, 2022–2027 (USD MILLION)
10.3 MONITORING & SCOUTING
10.3.1 GROWTH IN QUALITY CONCERNS TO IMPACT IMPORTANCE OF MONITORING & SCOUTING IN DIGITAL AGRICULTURE
TABLE 55 MONITORING & SCOUTING OPERATIONS MARKET, BY REGION, 2019–2021 (USD MILLION)
TABLE 56 MONITORING & SCOUTING OPERATIONS MARKET, BY REGION, 2022–2027 (USD MILLION)
10.4 MARKETING & DEMAND GENERATION
10.4.1 SURGE IN DEMAND FOR ONLINE SELLING OF AGRICULTURAL OUTPUT TO DRIVE MARKETING AND DEMAND GENERATION
TABLE 57 MARKETING & DEMAND GENERATION OPERATIONS MARKET, BY REGION, 2019–2021 (USD MILLION)
TABLE 58 MARKETING & DEMAND GENERATION OPERATIONS MARKET, BY REGION, 2022–2027 (USD MILLION)
11 DIGITAL AGRICULTURE MARKET, BY TYPE (Page No. - 130)
11.1 INTRODUCTION
FIGURE 31 DIGITAL AGRICULTURE MARKET, BY TYPE, 2022 VS. 2027 (USD MILLION)
TABLE 59 MARKET, BY TYPE, 2019–2021 (USD MILLION)
TABLE 60 MARKET, BY TYPE, 2022–2027 (USD MILLION)
11.2 HARDWARE
11.2.1 VARIETY OF AUTOMATION AND MONITORING TOOLS IN DIFFERENT TYPES OF AGRICULTURE TO BOOST DEMAND
TABLE 61 DIGITAL AGRICULTURE HARDWARE MARKET, BY REGION, 2019–2021 (USD MILLION)
TABLE 62 DIGITAL AGRICULTURE HARDWARE MARKET, BY REGION, 2022–2027 (USD MILLION)
TABLE 63 DIGITAL AGRICULTURE HARDWARE MARKET, BY TYPE, 2019–2021 (USD MILLION)
TABLE 64 DIGITAL AGRICULTURE HARDWARE MARKET, BY TYPE, 2022–2027 (USD MILLION)
11.2.2 AUTOMATION & CONTROL SYSTEMS
11.2.2.1 High demand for drones to monitor crop growth and pest control activity to boost demand
11.2.2.2 Drones/UAVs
11.2.2.3 Irrigation controllers
11.2.2.4 GPS/GNSS
11.2.2.5 Flow & application control devices
11.2.2.6 Guidance & steering
11.2.2.7 Handheld mobile device/handheld computers
11.2.2.8 Displays
11.2.2.9 Harvesters & forwarders
11.2.2.10 Variable rate controllers
11.2.2.11 Control systems
11.2.2.12 Robotic hardware
11.2.2.13 HVAC systems
11.2.2.14 LED grow lights
11.2.2.15 Other automation & control systems
TABLE 65 AGRICULTURE AUTOMATION & CONTROL SYSTEMS MARKET, BY TYPE, 2019–2021 (USD MILLION)
TABLE 66 AGRICULTURE AUTOMATION & CONTROL SYSTEMS MARKET, BY TYPE, 2022–2027 (USD MILLION)
11.2.3 SENSING & MONITORING DEVICES
11.2.3.1 High demand for sensors to make informed decisions to drive segment
11.2.3.2 Yield monitors
11.2.3.3 Soil sensors
11.2.3.4 Water sensors
11.2.3.5 Climate sensors
11.2.3.6 Camera systems
11.2.3.7 RFID & sensors for precision forestry
11.2.3.8 Temperature & environment monitoring sensors
11.2.3.9 pH & dissolved oxygen sensors
11.2.3.10 EC sensors
11.2.3.11 RFID tags & readers for livestock monitoring
11.2.3.12 Sensors for livestock monitoring
11.2.3.13 Sensors for smart greenhouses
11.2.3.14 Other sensing & monitoring devices
TABLE 67 AGRICULTURE SENSING & MONITORING DEVICES MARKET, BY TYPE, 2019–2021 (USD MILLION)
TABLE 68 AGRICULTURE SENSING & MONITORING DEVICES MARKET, BY TYPE, 2022–2027 (USD MILLION)
11.3 SOFTWARE
11.3.1 KEY DEVELOPMENTS BY COMPANIES TO FURTHER BOOST ADOPTION OF SOFTWARE IN DIGITAL AGRICULTURE
TABLE 69 DIGITAL AGRICULTURE SOFTWARE MARKET, BY REGION, 2019–2021 (USD MILLION)
TABLE 70 DIGITAL AGRICULTURE SOFTWARE MARKET, BY REGION, 2022–2027 (USD MILLION)
11.3.2 ON-CLOUD
11.3.2.1 Easy data handling and storage to fuel demand for on-cloud software
11.3.3 ON-PREMISES
11.3.3.1 High data integrity, easy maintenance, and storage to be key drivers for on-premise software
11.3.4 AI & DATA ANALYTICS
11.3.4.1 Increase in trend of AI and data analytics to enhance farm operations to further boost adoption among farmers
TABLE 71 DIGITAL AGRICULTURE SOFTWARE MARKET, BY TYPE, 2019–2021 (USD MILLION)
TABLE 72 DIGITAL AGRICULTURE SOFTWARE MARKET, BY TYPE, 2022–2027 (USD MILLION)
11.4 SERVICES
11.4.1 INCREASE IN IMPORTANCE OF PRECISION TECHNIQUES IN DIFFERENT SEGMENTS TO FURTHER IMPACT NEED FOR SERVICES
TABLE 73 DIGITAL AGRICULTURE SERVICES MARKET, BY REGION, 2019–2021 (USD MILLION)
TABLE 74 DIGITAL AGRICULTURE SERVICES MARKET, BY REGION, 2022–2027 (USD MILLION)
11.4.2 SYSTEM INTEGRATION & CONSULTING
11.4.2.1 Rise in importance of hardware and software integration for smooth farm functioning to propel growth
11.4.3 DATA COLLECTION & ANALYTICAL SERVICES
11.4.3.1 Need to integrate data in structured form to drive data collection and analytical services
11.4.4 CONNECTIVITY SERVICES
11.4.4.1 Opportunity for real-time data generation to impact demand for connectivity services
11.4.5 ASSISTANT PROFESSIONAL SERVICES
11.4.5.1 Need for improvements and professional services to manage entire value chain to increase demand
11.4.6 MAINTENANCE & SUPPORT SERVICES
11.4.6.1 Continuous need to maintain different digital agriculture systems to propel market
TABLE 75 DIGITAL AGRICULTURE SERVICES MARKET, BY TYPE, 2019–2021 (USD MILLION)
TABLE 76 DIGITAL AGRICULTURE SERVICES MARKET, BY TYPE, 2022–2027 (USD MILLION)
12 DIGITAL AGRICULTURE MARKET, BY REGION (Page No. - 147)
12.1 INTRODUCTION
FIGURE 32 INDIA TO BE FASTEST-GROWING COUNTRY IN DIGITAL AGRICULTURE MARKET
TABLE 77 MARKET, BY REGION, 2019–2021 (USD MILLION)
TABLE 78 MARKET, BY REGION, 2022–2027 (USD MILLION)
12.2 NORTH AMERICA
FIGURE 33 NORTH AMERICA: DIGITAL AGRICULTURE MARKET SNAPSHOT
TABLE 79 NORTH AMERICA: MARKET, BY COUNTRY, 2019–2021 (USD MILLION)
TABLE 80 NORTH AMERICA: MARKET, BY COUNTRY, 2022–2027 (USD MILLION)
TABLE 81 NORTH AMERICA: MARKET, BY TYPE, 2019–2021 (USD MILLION)
TABLE 82 NORTH AMERICA: MARKET, BY TYPE, 2022–2027 (USD MILLION)
TABLE 83 NORTH AMERICA: MARKET, BY OPERATION, 2019–2021 (USD MILLION)
TABLE 84 NORTH AMERICA: MARKET, BY OPERATION, 2022–2027 (USD MILLION)
TABLE 85 NORTH AMERICA: MARKET, BY OFFERING, 2019–2021 (USD MILLION)
TABLE 86 NORTH AMERICA: MARKET, BY OFFERING, 2022–2027 (USD MILLION)
TABLE 87 NORTH AMERICA: MARKET, BY TECHNOLOGY, 2019–2021 (USD MILLION)
TABLE 88 NORTH AMERICA: MARKET, BY TECHNOLOGY, 2022–2027 (USD MILLION)
12.2.1 US
12.2.1.1 Rise in usage of digital agriculture technologies in US
TABLE 89 US: DIGITAL AGRICULTURE MARKET, BY TYPE, 2019–2021 (USD MILLION)
TABLE 90 US: MARKET, BY TYPE, 2022–2027 (USD MILLION)
12.2.2 CANADA
12.2.2.1 Federal investments, accessibility, and favorable regulatory environment framework to propel market
TABLE 91 CANADA: DIGITAL AGRICULTURE MARKET, BY TYPE, 2019–2021 (USD MILLION)
TABLE 92 CANADA: MARKET, BY TYPE, 2022–2027 (USD MILLION)
12.2.3 MEXICO
12.2.3.1 Limited resources driving demand for digital agriculture technologies
TABLE 93 MEXICO: DIGITAL AGRICULTURE MARKET, BY TYPE, 2019–2021 (USD MILLION)
TABLE 94 MEXICO: MARKET, BY TYPE, 2022–2027 (USD MILLION)
12.3 EUROPE
TABLE 95 EUROPE: DIGITAL AGRICULTURE MARKET, BY COUNTRY, 2019–2021 (USD MILLION)
TABLE 96 EUROPE: MARKET, BY COUNTRY, 2022–2027 (USD MILLION)
TABLE 97 EUROPE: MARKET, BY TYPE, 2019–2021 (USD MILLION)
TABLE 98 EUROPE: MARKET, BY TYPE, 2022–2027 (USD MILLION)
TABLE 99 EUROPE: MARKET, BY OPERATION, 2019–2021 (USD MILLION)
TABLE 100 EUROPE: MARKET, BY OPERATION, 2022–2027 (USD MILLION)
TABLE 101 EUROPE: MARKET, BY OFFERING, 2019–2021 (USD MILLION)
TABLE 102 EUROPE: MARKET, BY OFFERING, 2022–2027 (USD MILLION)
TABLE 103 EUROPE: MARKET, BY TECHNOLOGY, 2019–2021 (USD MILLION)
TABLE 104 EUROPE: MARKET, BY TECHNOLOGY, 2022–2027 (USD MILLION)
12.3.1 GERMANY
12.3.1.1 Increase in funding for research projects to impact market
TABLE 105 GERMANY: DIGITAL AGRICULTURE MARKET, BY TYPE, 2019–2021 (USD MILLION)
TABLE 106 GERMANY: MARKET, BY TYPE, 2022–2027 (USD MILLION)
12.3.2 RUSSIA
12.3.2.1 Agriculture 4.0 to increase demand for modern technologies
TABLE 107 RUSSIA: DIGITAL AGRICULTURE MARKET, BY TYPE, 2019–2021 (USD MILLION)
TABLE 108 RUSSIA: MARKET, BY TYPE, 2022–2027 (USD MILLION)
12.3.3 FRANCE
12.3.3.1 Rise in awareness regarding technology and automation to support market growth
TABLE 109 FRANCE: DIGITAL AGRICULTURE MARKET, BY TYPE, 2019–2021 (USD MILLION)
TABLE 110 FRANCE: MARKET, BY TYPE, 2022–2027 (USD MILLION)
12.3.4 ITALY
12.3.4.1 ‘Made in Italy’ campaign to drive modernization
TABLE 111 ITALY: DIGITAL AGRICULTURE MARKET, BY TYPE, 2019–2021 (USD MILLION)
TABLE 112 ITALY: MARKET, BY TYPE, 2022–2027 (USD MILLION)
12.3.5 UK
12.3.5.1 Greater need to meet growing automation needs to boost market in the UK
TABLE 113 UK: DIGITAL AGRICULTURE MARKET, BY TYPE, 2019–2021 (USD MILLION)
TABLE 114 UK: MARKET, BY TYPE, 2022–2027 (USD MILLION)
12.3.6 SWEDEN
12.3.6.1 Growth in utilization of agricultural technologies for soil monitoring to boost market
TABLE 115 SWEDEN: DIGITAL AGRICULTURE MARKET, BY TYPE, 2019–2021 (USD MILLION)
TABLE 116 SWEDEN: MARKET, BY TYPE, 2022–2027 (USD MILLION)
12.3.7 NETHERLANDS
12.3.7.1 Utilization of drones in greenhouses to drive demand for digital agriculture
TABLE 117 NETHERLANDS: DIGITAL AGRICULTURE MARKET, BY TYPE, 2019–2021 (USD MILLION)
TABLE 118 NETHERLANDS: MARKET, BY TYPE, 2022–2027 (USD MILLION)
12.3.8 REST OF EUROPE
TABLE 119 REST OF EUROPE: DIGITAL AGRICULTURE MARKET, BY TYPE, 2019–2021 (USD MILLION)
TABLE 120 REST OF EUROPE: MARKET, BY TYPE, 2022–2027 (USD MILLION)
12.4 ASIA PACIFIC
FIGURE 34 ASIA PACIFIC: DIGITAL AGRICULTURE ADDITIVES MARKET SNAPSHOT
TABLE 121 ASIA PACIFIC: MARKET, BY COUNTRY, 2019–2021 (USD MILLION)
TABLE 122 ASIA PACIFIC: MARKET, BY COUNTRY, 2022–2027 (USD MILLION)
TABLE 123 ASIA PACIFIC: MARKET, BY TYPE, 2019–2021 (USD MILLION)
TABLE 124 ASIA PACIFIC: MARKET, BY TYPE, 2022–2027 (USD MILLION)
TABLE 125 ASIA PACIFIC: MARKET, BY OPERATION, 2019–2021 (USD MILLION)
TABLE 126 ASIA PACIFIC: MARKET, BY OPERATION, 2022–2027 (USD MILLION)
TABLE 127 ASIA PACIFIC: MARKET, BY OFFERING, 2019–2021 (USD MILLION)
TABLE 128 ASIA PACIFIC: MARKET, BY OFFERING, 2022–2027 (USD MILLION)
TABLE 129 ASIA PACIFIC: MARKET, BY TECHNOLOGY, 2019–2021 (USD MILLION)
TABLE 130 ASIA PACIFIC: MARKET, BY TECHNOLOGY, 2022–2027 (USD MILLION)
12.4.1 CHINA
12.4.1.1 Large population and increase in food demand to shape digital agriculture landscape
TABLE 131 CHINA: DIGITAL AGRICULTURE MARKET, BY TYPE, 2019–2021 (USD MILLION)
TABLE 132 CHINA: MARKET, BY TYPE, 2022–2027 (USD MILLION)
12.4.2 JAPAN
12.4.2.1 Higher demand for digital agriculture to make country’s food industry self-sufficient
TABLE 133 JAPAN: DIGITAL AGRICULTURE MARKET, BY TYPE, 2019–2021 (USD MILLION)
TABLE 134 JAPAN: MARKET, BY TYPE, 2022–2027 (USD MILLION)
12.4.3 AUSTRALIA & NEW ZEALAND
12.4.3.1 Thriving poultry industry and increasing exports to propel market
TABLE 135 AUSTRALIA & NEW ZEALAND: DIGITAL AGRICULTURE MARKET, BY TYPE, 2019–2021 (USD MILLION)
TABLE 136 AUSTRALIA & NEW ZEALAND: MARKET, BY TYPE, 2022–2027 (USD MILLION)
12.4.4 INDIA
12.4.4.1 Government initiatives to provide great opportunities for digital agriculture in India
TABLE 137 INDIA: DIGITAL AGRICULTURE MARKET, BY TYPE, 2019–2021 (USD MILLION)
TABLE 138 INDIA: MARKET, BY TYPE, 2022–2027 (USD MILLION)
12.4.5 REST OF ASIA PACIFIC
TABLE 139 REST OF ASIA PACIFIC: DIGITAL AGRICULTURE MARKET, BY TYPE, 2019–2021 (USD MILLION)
TABLE 140 REST OF ASIA PACIFIC: MARKET, BY TYPE, 2022–2027 (USD MILLION)
12.5 SOUTH AMERICA
TABLE 141 SOUTH AMERICA: DIGITAL AGRICULTURE MARKET, BY COUNTRY, 2019–2021 (USD MILLION)
TABLE 142 SOUTH AMERICA: MARKET, BY COUNTRY, 2022–2027 (USD MILLION)
TABLE 143 SOUTH AMERICA: MARKET, BY TYPE, 2019–2021 (USD MILLION)
TABLE 144 SOUTH AMERICA: MARKET, BY TYPE, 2022–2027 (USD MILLION)
TABLE 145 SOUTH AMERICA: MARKET, BY OPERATION, 2019–2021 (USD MILLION)
TABLE 146 SOUTH AMERICA: MARKET, BY OPERATION, 2022–2027 (USD MILLION)
TABLE 147 SOUTH AMERICA: MARKET, BY OFFERING, 2019–2021 (USD MILLION)
TABLE 148 SOUTH AMERICA: MARKET, BY OFFERING, 2022–2027 (USD MILLION)
TABLE 149 SOUTH AMERICA: MARKET, BY TECHNOLOGY, 2019–2021 (USD MILLION)
TABLE 150 SOUTH AMERICA: MARKET, BY TECHNOLOGY, 2022–2027 (USD MILLION)
12.5.1 BRAZIL
12.5.1.1 Growth in agriculture activities to boost market for digital agriculture
TABLE 151 BRAZIL: DIGITAL AGRICULTURE MARKET, BY TYPE, 2019–2021 (USD MILLION)
TABLE 152 BRAZIL: MARKET, BY TYPE, 2022–2027 (USD MILLION)
12.5.2 ARGENTINA
12.5.2.1 Increase in public-private partnerships for agriculture innovations
TABLE 153 ARGENTINA: DIGITAL AGRICULTURE MARKET, BY TYPE, 2019–2021 (USD MILLION)
TABLE 154 ARGENTINA: MARKET, BY TYPE, 2022–2027 (USD MILLION)
12.5.3 REST OF SOUTH AMERICA
TABLE 155 REST OF SOUTH AMERICA: DIGITAL AGRICULTURE MARKET, BY TYPE, 2019–2021 (USD MILLION)
TABLE 156 REST OF SOUTH AMERICA: MARKET, BY TYPE, 2022–2027 (USD MILLION)
12.6 REST OF THE WORLD (ROW)
TABLE 157 ROW: DIGITAL AGRICULTURE MARKET, BY COUNTRY, 2019–2021 (USD MILLION)
TABLE 158 ROW: MARKET, BY COUNTRY, 2022–2027 (USD MILLION)
TABLE 159 ROW: MARKET, BY TYPE, 2019–2021 (USD MILLION)
TABLE 160 ROW: MARKET, BY TYPE, 2022–2027 (USD MILLION)
TABLE 161 ROW: MARKET, BY OPERATION, 2019–2021 (USD MILLION)
TABLE 162 ROW: MARKET, BY OPERATION, 2022–2027 (USD MILLION)
TABLE 163 ROW: MARKET, BY OFFERING, 2019–2021 (USD MILLION)
TABLE 164 REST OF THE WORLD: DIGITAL AGRICULTURE MARKET, BY OFFERING, 2022–2027 (USD MILLION)
TABLE 165 ROW: DIGITAL AGRICULTURE MARKET, BY TECHNOLOGY, 2019–2021 (USD MILLION)
TABLE 166 ROW: MARKET, BY TECHNOLOGY, 2022–2027 (USD MILLION)
12.6.1 AFRICA
12.6.1.1 Increase in awareness and penetration of digitalization to drive market
TABLE 167 AFRICA: DIGITAL AGRICULTURE MARKET, BY TYPE, 2019–2021 (USD MILLION)
TABLE 168 AFRICA: MARKET, BY TYPE, 2022–2027 (USD MILLION)
12.6.2 MIDDLE EAST
12.6.2.1 Rise in adoption of smartphones for agriculture to fuel growth
TABLE 169 MIDDLE EAST: DIGITAL AGRICULTURE MARKET, BY TYPE, 2019–2021 (USD MILLION)
TABLE 170 MIDDLE EAST: MARKET, BY TYPE, 2022–2027 (USD MILLION)
13 COMPETITIVE LANDSCAPE (Page No. - 188)
13.1 OVERVIEW
13.2 MARKET SHARE ANALYSIS
TABLE 171 DIGITAL AGRICULTURE MARKET SHARE ANALYSIS, 2021
13.3 HISTORICAL REVENUE ANALYSIS OF KEY PLAYERS
FIGURE 35 TOTAL REVENUE ANALYSIS OF KEY PLAYERS, 2017–2021 (USD BILLION)
13.4 COMPANY EVALUATION QUADRANT (KEY PLAYERS)
13.4.1 STARS
13.4.2 PERVASIVE PLAYERS
13.4.3 EMERGING LEADERS
13.4.4 PARTICIPANTS
FIGURE 36 DIGITAL AGRICULTURE MARKET, COMPANY EVALUATION QUADRANT, 2021
13.4.5 COMPANY PRODUCT FOOTPRINT (KEY PLAYERS)
TABLE 172 DIGITAL AGRICULTURE COMPANY FOOTPRINT, BY OFFERING
TABLE 173 DIGITAL AGRICULTURE COMPANY FOOTPRINT, BY TYPE
TABLE 174 DIGITAL AGRICULTURE COMPANY FOOTPRINT, BY OPERATION
TABLE 175 DIGITAL AGRICULTURE COMPANY FOOTPRINT, BY TECHNOLOGY
TABLE 176 DIGITAL AGRICULTURE COMPANY FOOTPRINT, BY REGION
TABLE 177 OVERALL COMPANY FOOTPRINT
13.5 COMPANY EVALUATION QUADRANT (OTHER PLAYERS)
13.5.1 PROGRESSIVE COMPANIES
13.5.2 STARTING BLOCKS
13.5.3 RESPONSIVE COMPANIES
13.5.4 DYNAMIC COMPANIES
FIGURE 37 DIGITAL AGRICULTURE MARKET: COMPANY EVALUATION QUADRANT, 2021 (OTHER PLAYERS)
TABLE 178 DIGITAL AGRICULTURE: COMPETITIVE BENCHMARKING OF OTHER PLAYERS
13.6 COMPETITIVE SCENARIO
13.6.1 PRODUCT LAUNCHES
TABLE 179 DIGITAL AGRICULTURE MARKET: PRODUCT LAUNCHES, 2019–2022
13.6.2 DEALS
TABLE 180 MARKET: DEALS, 2019–2022
13.6.3 OTHERS
TABLE 181 MARKET: OTHERS, 2021–2022
14 COMPANY PROFILES (Page No. - 207)
14.1 KEY PLAYERS
(Business Overview, Products Offered, Recent Developments, and MnM View (Key strengths/Right to Win, Strategic Choices Made, and Weaknesses and Competitive Threats))*
14.1.1 CISCO SYSTEMS, INC.
TABLE 182 CISCO SYSTEMS, INC.: BUSINESS OVERVIEW
FIGURE 38 CISCO SYSTEMS, INC.: COMPANY SNAPSHOT
TABLE 183 CISCO SYSTEMS, INC.: PRODUCTS/SOLUTIONS/SERVICES OFFERED
TABLE 184 CISCO SYSTEMS, INC.: NEW PRODUCT LAUNCHES
TABLE 185 CISCO SYSTEMS, INC.: DEALS
14.1.2 IBM CORPORATION
TABLE 186 IBM CORPORATION: BUSINESS OVERVIEW
FIGURE 39 IBM CORPORATION: COMPANY SNAPSHOT
TABLE 187 IBM CORPORATION: PRODUCTS/SOLUTIONS/SERVICES OFFERED
TABLE 188 IBM CORPORATION: NEW PRODUCT LAUNCH
TABLE 189 IBM CORPORATION: DEALS
14.1.3 ACCENTURE
TABLE 190 ACCENTURE: BUSINESS OVERVIEW
FIGURE 40 ACCENTURE: COMPANY SNAPSHOT
TABLE 191 ACCENTURE: PRODUCTS/SOLUTIONS/SERVICES OFFERED
14.1.4 DEERE & COMPANY
TABLE 192 DEERE & COMPANY: BUSINESS OVERVIEW
FIGURE 41 DEERE & COMPANY: COMPANY SNAPSHOT
TABLE 193 DEERE & COMPANY: PRODUCTS/SOLUTIONS/SERVICES OFFERED
TABLE 194 DEERE & COMPANY: NEW PRODUCT LAUNCHES
TABLE 195 DEERE & COMPANY: DEALS
14.1.5 TRIMBLE INC.
TABLE 196 TRIMBLE INC.: BUSINESS OVERVIEW
FIGURE 42 TRIMBLE INC.: COMPANY SNAPSHOT
TABLE 197 TRIMBLE INC.: PRODUCTS/SOLUTIONS/SERVICES OFFERED
TABLE 198 TRIMBLE INC.: NEW PRODUCT LAUNCH
TABLE 199 TRIMBLE INC.: DEALS
14.1.6 DELAVAL
TABLE 200 DELAVAL: BUSINESS OVERVIEW
FIGURE 43 DELAVAL: COMPANY SNAPSHOT
TABLE 201 DELAVAL: PRODUCTS OFFERED
TABLE 202 DELAVAL: NEW PRODUCT LAUNCHES
TABLE 203 DELAVAL: DEALS
14.1.7 AKVA GROUP
TABLE 204 AKVA GROUP: BUSINESS OVERVIEW
FIGURE 44 AKVA GROUP: COMPANY SNAPSHOT
TABLE 205 AKVA GROUP: PRODUCTS OFFERED
TABLE 206 AKVA GROUP: DEALS
14.1.8 HEXAGON AB
TABLE 207 HEXAGON AB: BUSINESS OVERVIEW
FIGURE 45 HEXAGON AB: COMPANY SNAPSHOT
TABLE 208 HEXAGON AB: PRODUCTS OFFERED
14.1.9 DA JIANG INNOVATIONS SCIENCE & TECHNOLOGY CO. (DJI)
TABLE 209 DJI: BUSINESS OVERVIEW
TABLE 210 DJI: PRODUCTS OFFERED
14.1.10 EPICOR SOFTWARE CORPORATION
TABLE 211 EPICOR SOFTWARE CORPORATION: BUSINESS OVERVIEW
TABLE 212 EPICOR SOFTWARE CORPORATION: PRODUCTS/SOLUTIONS/SERVICES OFFERED
14.2 OTHER PLAYERS
14.2.1 VODAFONE GROUP PLC
TABLE 213 VODAFONE GROUP PLC: BUSINESS OVERVIEW
FIGURE 46 VODAFONE GROUP PLC: COMPANY SNAPSHOT
TABLE 214 VODAFONE GROUP PLC: PRODUCTS OFFERED
TABLE 215 VODAFONE GROUP PLC: NEW PRODUCT LAUNCHES
14.2.2 BAYER CROPSCIENCE AG
TABLE 216 BAYER CROPSCIENCE AG: BUSINESS OVERVIEW
FIGURE 47 BAYER CROPSCIENCE AG: COMPANY SNAPSHOT
TABLE 217 BAYER CROPSCIENCE AG: PRODUCTS OFFERED
TABLE 218 BAYER CROPSCIENCE AG: NEW PRODUCT LAUNCHES
TABLE 219 BAYER CROPSCIENCE AG: DEALS
14.2.3 TELUS AGRICULTURE
TABLE 220 TELUS AGRICULTURE: BUSINESS OVERVIEW
TABLE 221 TELUS AGRICULTURE: PRODUCTS OFFERED
TABLE 222 TELUS AGRICULTURE: DEALS
14.2.4 SMALL ROBOT COMPANY
TABLE 223 SMALL ROBOT COMPANY: BUSINESS OVERVIEW
TABLE 224 SMALL ROBOT COMPANY: PRODUCTS/SOLUTIONS/SERVICES OFFERED
TABLE 225 SMALL ROBOT COMPANY: NEW PRODUCT LAUNCH
14.2.5 ZEMDIRBIU KONSULTACIJOS UAB
TABLE 226 ZEMDIRBIU KONSULTACIJOS UAB: BUSINESS OVERVIEW
TABLE 227 ZEMDIRBIU KONSULTACIJOS UAB: PRODUCTS/SOLUTIONS/SERVICES OFFERED
14.2.6 RAVEN INDUSTRIES
TABLE 228 RAVEN INDUSTRIES: BUSINESS OVERVIEW
FIGURE 48 RAVEN INDUSTRIES: COMPANY SNAPSHOT
TABLE 229 RAVEN INDUSTRIES: PRODUCTS OFFERED
TABLE 230 RAVEN INDUSTRIES: NEW PRODUCT LAUNCHES
TABLE 231 RAVEN INDUSTRIES: DEALS
TABLE 232 RAVEN INDUSTRIES: OTHERS
14.2.7 GAMAYA
TABLE 233 GAMAYA: BUSINESS OVERVIEW
TABLE 234 GAMAYA: PRODUCTS OFFERED
14.2.8 AGCO CORPORATION
TABLE 235 AGCO CORPORATION: BUSINESS OVERVIEW
FIGURE 49 AGCO CORPORATION: COMPANY SNAPSHOT
TABLE 236 AGCO CORPORATION: PRODUCTS OFFERED
TABLE 237 AGCO CORPORATION: DEALS
14.2.9 PRECISIONHAWK
TABLE 238 PRECISIONHAWK: BUSINESS OVERVIEW
TABLE 239 PRECISIONHAWK: PRODUCTS OFFERED
TABLE 240 PRECISIONHAWK: NEW PRODUCT LAUNCHES
TABLE 241 PRECISIONHAWK: DEALS
14.2.10 AGREENA
TABLE 242 AGREENA: BUSINESS OVERVIEW
TABLE 243 AGREENA: PRODUCTS OFFERED
TABLE 244 AGREENA: DEALS
14.2.11 CERES IMAGING
TABLE 245 CERES IMAGING: BUSINESS OVERVIEW
TABLE 246 CERES: PRODUCTS OFFERED
TABLE 247 CERES: NEW PRODUCT LAUNCHES
14.2.12 AGRICULTURAL CONSULTING SERVICES (ACS)
TABLE 248 AGRICULTURAL CONSULTING SERVICES: BUSINESS OVERVIEW
TABLE 249 AGRICULTURAL CONSULTING SERVICES (ACS): PRODUCTS OFFERED
14.2.13 EC2CE
TABLE 250 EC2CE: BUSINESS OVERVIEW
TABLE 251 EC2CE: PRODUCTS OFFERED
TABLE 252 EC2CE: NEW PRODUCT LAUNCHES
14.2.14 EUROFINS SCIENTIFIC
TABLE 253 EUROFINS SCIENTIFIC: BUSINESS OVERVIEW
FIGURE 50 EUROFINS SCIENTIFIC: COMPANY SNAPSHOT
TABLE 254 EUROFINS SCIENTIFIC: PRODUCTS OFFERED
14.2.15 ARABLE
TABLE 255 ARABLE: BUSINESS OVERVIEW
TABLE 256 ARABLE: PRODUCTS OFFERED
TABLE 257 ARABLE: NEW PRODUCT LAUNCHES
TABLE 258 ARABLE: DEALS
TABLE 259 ARABLE: OTHERS
*Details on Business Overview, Products Offered, Recent Developments, and MnM View (Key strengths/Right to Win, Strategic Choices Made, and Weaknesses and Competitive Threats) might not be captured in case of unlisted companies.
15 ADJACENT AND RELATED MARKETS (Page No. - 288)
15.1 INTRODUCTION
TABLE 260 ADJACENT MARKETS TO DIGITAL AGRICULTURE MARKET
15.2 LIMITATIONS
15.3 PRECISION FARMING MARKET
15.3.1 MARKET DEFINITION
15.3.2 MARKET OVERVIEW
TABLE 261 PRECISION FARMING MARKET, BY OFFERING, 2018–2021 (USD MILLION)
TABLE 262 PRECISION FARMING MARKET, BY OFFERING, 2022–2030 (USD MILLION)
15.4 SMART AGRICULTURE MARKET
15.4.1 MARKET DEFINITION
15.4.2 MARKET OVERVIEW
TABLE 263 SMART AGRICULTURE MARKET, BY AGRICULTURE TYPE, 2017–2020 (USD MILLION)
TABLE 264 SMART AGRICULTURE MARKET, BY AGRICULTURE TYPE, 2021–2026 (USD MILLION)
15.5 FARM MANAGEMENT SOFTWARE MARKET
15.5.1 MARKET DEFINITION
15.5.2 MARKET OVERVIEW
TABLE 265 FARM MANAGEMENT SOFTWARE MARKET, BY FARM PRODUCTION PLANNING, 2017–2020 (USD MILLION)
TABLE 266 FARM MANAGEMENT SOFTWARE MARKET, BY FARM PRODUCTION PLANNING, 2021–2026 (USD MILLION)
16 APPENDIX (Page No. - 293)
16.1 DISCUSSION GUIDE
16.2 KNOWLEDGESTORE: MARKETSANDMARKETS’ SUBSCRIPTION PORTAL
16.3 CUSTOMIZATION OPTIONS
16.4 RELATED REPORTS
16.5 AUTHOR DETAILS
The study involved four major activities in estimating the digital agriculture market size. Exhaustive secondary research was conducted to collect information on the market, peer market, and parent market. The next step was to validate these findings, assumptions, and sizing with industry experts across the value chain through primary research. The top-down and bottom-up approaches were employed to estimate the complete market size. Thereafter, market breakdown and data triangulation were used to estimate the market size of segments and sub-segments.
Secondary Research
In the secondary research process, various secondary sources were referred to, for identifying and collecting information relevant to this study. Secondary sources include annual reports, press releases, and investor presentations of companies; white papers, certified publications, and articles from recognized authors; directories; and databases. The secondary research was done to obtain key information about the industry’s supply chain, the market’s value chain, the total pool of key players, market classification and segmentation according to industry trends, geographic markets, and key developments from both market- and technology-oriented perspectives.
Secondary sources for this research study include government sources, corporate filings (such as annual reports, investor presentations, and financial statements), and trade, business, and professional associations. The secondary data was collected and analyzed to arrive at the overall market size, which was further validated through primary research.
Primary Research
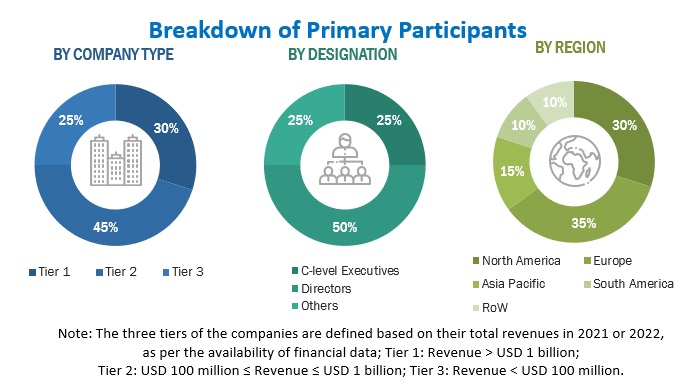
Extensive primary research was conducted to gather information and verify and validate the critical market numbers. Various sources from both supply and demand sides were interviewed to obtain the qualitative and quantitative information relevant to this report. Primary sources from the supply side include industry experts such as CEOs, vice presidents, marketing directors, technology and innovation directors, application developers, application users, and related executives from various key companies and organizations operating in the smart agriculture market. The primary research was also conducted to identify segmentation types, industry trends, and key players, as well as to analyze the competitive landscape; key player strategies; key market dynamics such as drivers, restraints, opportunities, challenges, and industry trends.
Given below is the breakdown of the primary respondents.
To know about the assumptions considered for the study, download the pdf brochure
Market Size Estimation
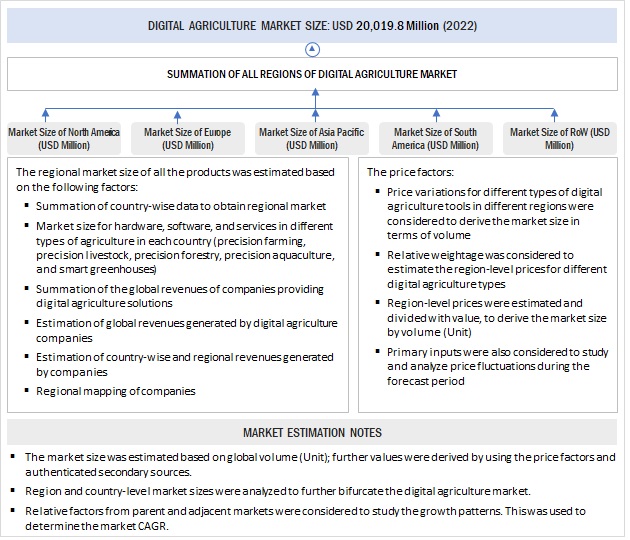
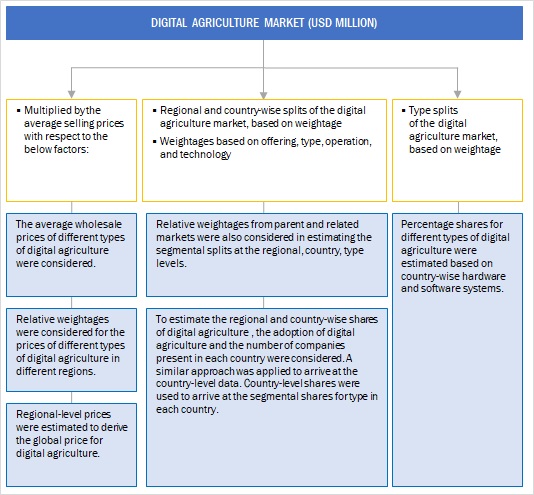
Both the top-down and bottom-up approaches were used to estimate and validate the total size of the digital agriculture market. These methods were also used extensively to estimate the size of various subsegments in the market. The research methodology used to estimate the market size includes the following:
- The key players were identified through extensive primary and secondary research.
- The value chain and market size of the digital agriculture market, in terms of value, were determined through primary and secondary research.
- All percentage shares, splits, and breakdowns were determined using secondary sources and verified through primary sources.
- All parameters that affect the market covered in this research study were accounted for, viewed in extensive detail, verified through primary research, and analyzed to obtain the final quantitative and qualitative data.
- The research included the study of reports, reviews, and newsletters of top market players, along with extensive interviews for opinions from key leaders, such as CEOs, directors, and marketing executives.
Data Triangulation
After arriving at the overall market size from the estimation process explained above, the total market was split into several segments and subsegments. The data triangulation and market breakdown procedures were employed, wherever applicable, to estimate the overall digital agriculture market and arrive at the exact statistics for all segments and subsegments. The data was triangulated by studying various factors and trends from the demand and supply sides. The market size was also validated using the top-down and bottom-up approaches. It was then verified through primary interviews. Hence, three approaches were adopted—the top-down approach, the bottom-up approach, and the one involving expert interviews. Only when the values arrived at from the three points, match the data is assumed to be correct.
Report Objectives
- To describe and forecast the digital agriculture market, in terms of technology, type, operation, offering, and region.
- To describe and forecast the digital agriculture market, in terms of value, by region–North America, Europe, Asia Pacific, South America, and the Rest of the World—along with their respective countries. To provide detailed information regarding the major factors influencing the market growth (drivers, restraints, opportunities, and challenges)
- To strategically analyze micro-markets with respect to individual growth trends, prospects, and contributions to the overall market.
- To study the complete value chain of the digital agriculture market.
- To analyze opportunities in the market for stakeholders by identifying the high-growth segments of the digital agriculture market.
- To strategically profile the key players and comprehensively analyze their market positions, in terms of ranking and core competencies, along with details on the competitive landscape of market leaders.
- To analyze strategic approaches, such as expansions, product launches, acquisitions, and partnerships in the digital agriculture market.
Available Customizations:
Based on the given market data, MarketsandMarkets offers customizations in the reports according to client-specific requirements. The available customization options are as follows:
Product Analysis
-
Product Matrix, which gives a detailed comparison of the product portfolio of each company
Geographic Analysis
- Further breakdown of the Rest of the European digital agriculture market by key countries Denmark, Spain, Finland, and Norway
- Further breakdown of the Rest of the Asia Pacific digital agriculture market by key countries Thailand, Vietnam, the Philippines, and Bangladesh
- Further breakdown of the Rest of South America’s digital agriculture market by key countries Peru, Bolivia, Paraguay, Chile, Ecuador, Colombia, and Venezuela
Company Information
- Detailed analyses and profiling of additional market players (up to five)
Growth opportunities and latent adjacency in Digital Agriculture Market