This research study involves the use of extensive secondary sources, directories, and databases, such as Hoovers, Bloomberg L.P., Factiva, ICIS, and OneSource, to identify and collect information useful for this technical, market-oriented, and commercial study of the global District cooling market. Primary sources are mainly industry experts from core and related industries, preferred suppliers, manufacturers, distributors, service providers, and organizations related to all segments of the value chain of this industry. In-depth interviews were conducted with various primary respondents, including key industry participants, subject matter experts (SMEs), C-level executives of key market players, and industry consultants, among other experts, to obtain and verify critical qualitative and quantitative information as well as assess growth prospects of the market.
Secondary Research
Secondary sources include annual reports, press releases, and investor presentations of companies; directories and databases, which include D&B, Bloomberg, and Factiva, white papers and articles from recognized authors, and publications and databases from associations, such as the BP Statistical Review of World Energy, Energy Information Administration, and Department of Energy. Secondary research has been used to obtain important information about the key players and market classification & segmentation according to industry trends to the bottom-most level and key developments related to market and technology perspectives. A database of the key industry leaders has also been prepared using secondary research.
Primary Research
In the primary research process, various sources from both the supply and demand sides have been interviewed to obtain and verify qualitative and quantitative information for this report as well as analyze prospects. Primary sources from the supply side include industry experts such as CEOs, vice presidents, marketing directors, technology and innovation directors, and related executives from various leading companies and organizations operating in the district cooling market. Primary sources from the demand side include experts and key persons from the application segment.
After the complete market engineering process (which includes calculations of market statistics, market breakdown, market size estimations, market forecasts, and data triangulation), extensive primary research has been conducted to gather information and verify and validate the critical numbers arrived at. Primary research has also been conducted to identify the segmentation, applications, Porter’s Five Forces, key players, competitive landscape, and key market dynamics such as drivers, opportunities, challenges, industry trends, and strategies adopted by key players.
Following is the breakdown of primary respondents:

To know about the assumptions considered for the study, download the pdf brochure
Market Size Estimation
In the complete market engineering process, both top-down and bottom-up approaches have been extensively used along with several data triangulation methods to estimate and forecast the overall market segments listed in this report.
Top-down and bottom-up approaches have been used to estimate and validate the market size of district cooling for various applications in each region. The key players in the market have been identified through secondary research, and their market share in respective regions has been determined through primary and secondary research. This entire procedure includes the study of annual and financial reports of the key market players and extensive interviews for insights from industry leaders such as CEOs, vice presidents, directors, and marketing executives. All percentage shares, splits, and breakdowns have been determined using secondary sources and verified through primary sources.
Global District cooling Market Size: Bottom Up Approach

To know about the assumptions considered for the study, Request for Free Sample Report
Global District cooling Market Size: Top-down Approach

Data Triangulation
After arriving at the overall market size from the estimation process explained above, the total market has been split into several segments and sub-segments. Data triangulation and market breakdown procedures have been used wherever applicable to complete the overall market engineering process and to arrive at the exact statistics for all segments and sub-segments. The data has been triangulated by studying various factors and trends from both the demand and supply sides. The market has been validated using both the top-down and bottom-up approaches. Then, it was verified through primary interviews. Hence, for every data segment, there are three sources—the top-down approach, the bottom-up approach, and expert interviews. When the values arrived at from the three points matched, the data was assumed to be correct.
Market Definition.
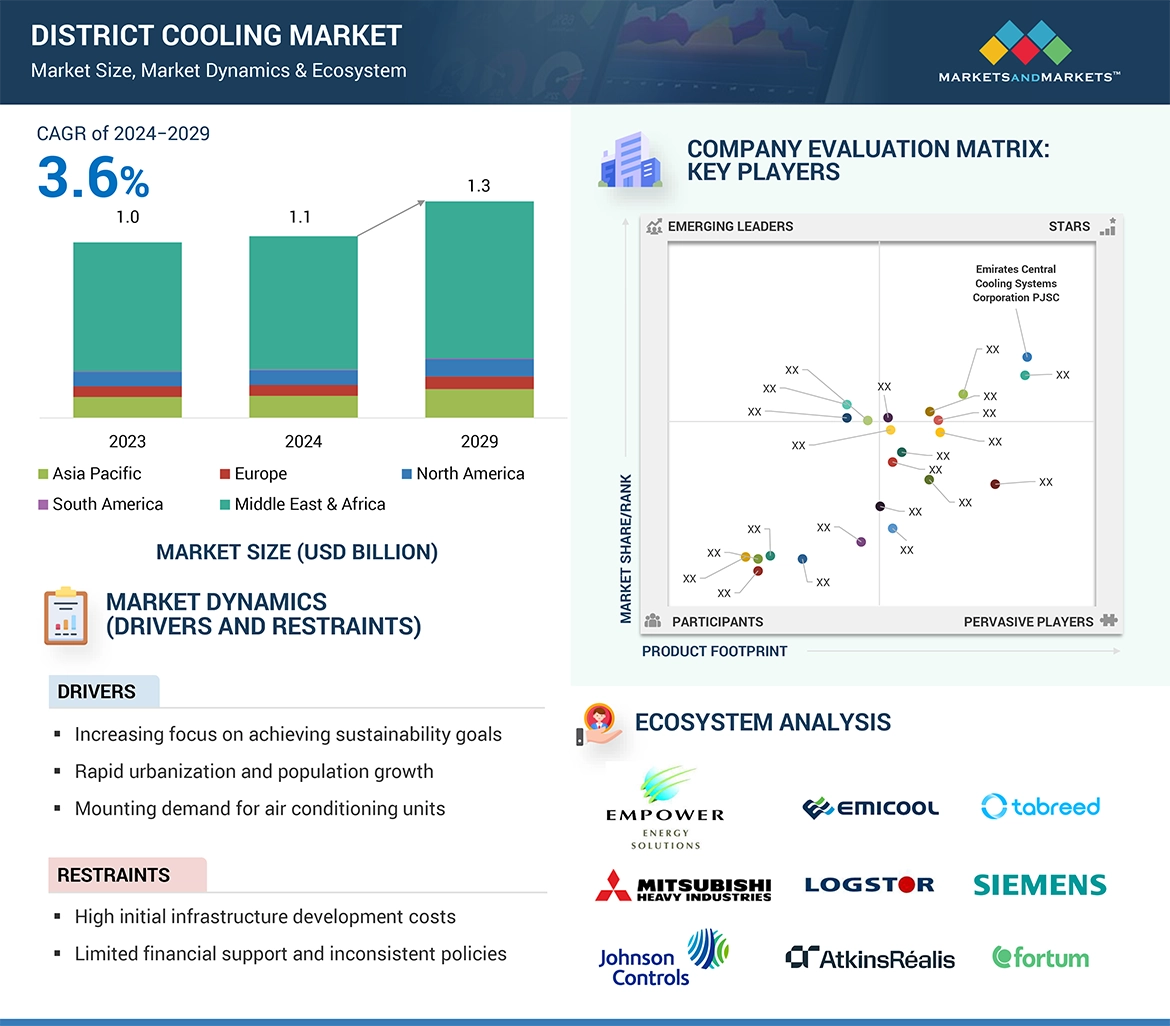
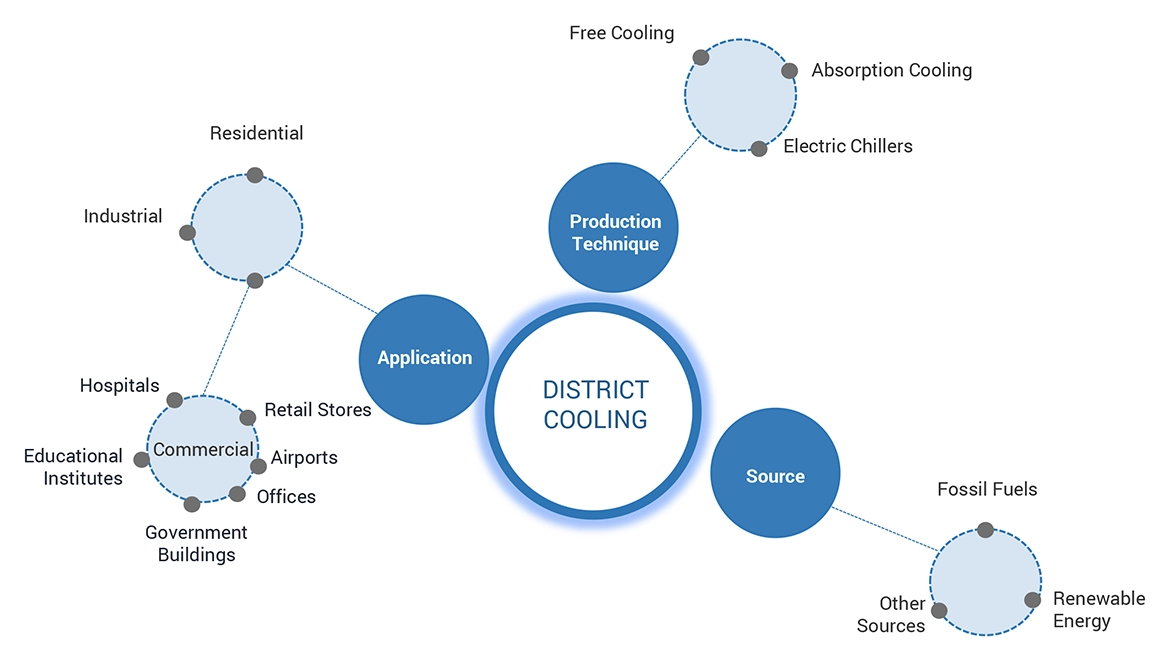
District cooling market encompasses the district cooling system that centralizes cooling energy production and distribution via chilled water from a central plant to multiple buildings through underground pipelines. It eliminates individual building cooling systems, enhancing efficiency and sustainability. Serving diverse sectors like commercial, residential, and industrial, district cooling reduces energy consumption and greenhouse gas emissions. Users purchase cooling services from providers, benefiting from shared infrastructure and operational cost savings. Scalable and adaptable, these systems support urban development with efficient cooling solutions, making them pivotal in modern urban planning for energy efficiency and environmental sustainability.
Key Stakeholders
-
District cooling equipment manufacturers
-
District cooling manufacturers
-
District cooling distributors and suppliers
-
Consumers and Building Owners
-
Research institutes and companies.
-
Industry, energy, and environmental associations
-
Renewable energy advocates
-
Government and research organizations
Report Objectives
-
To describe and forecast the district cooling market based on source, production technique, and application in terms of value
-
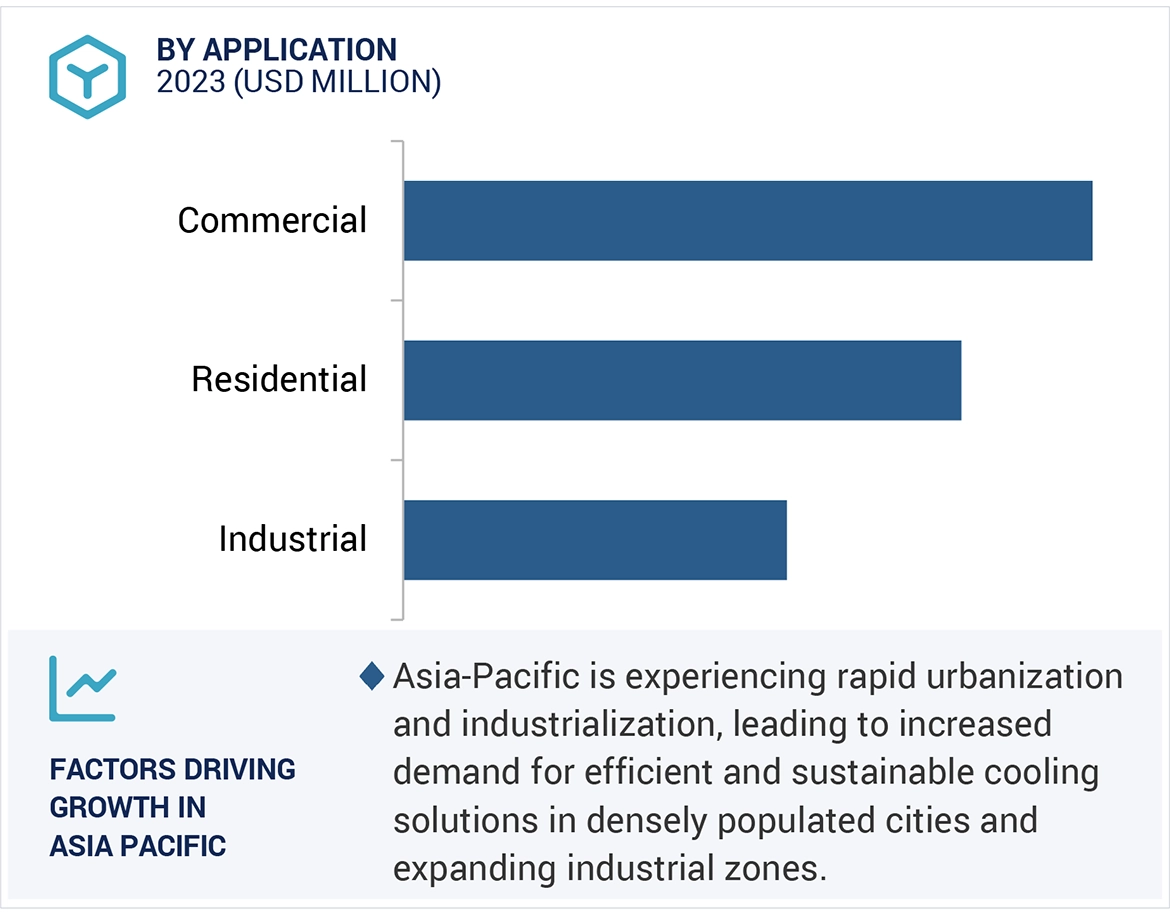
To describe and forecast the market based on application and region in terms of volume
-
To describe and forecast the market size of various segments across five key regions: North America, South America, Europe, Asia Pacific, and the Middle East & Africa
-
To provide detailed information regarding the drivers, restraints, opportunities, and challenges influencing the market growth
-
To strategically analyze the micromarkets1 with respect to individual growth trends, prospects, and contributions to the overall market size
-
To analyze market opportunities for stakeholders and provide a detailed competitive landscape for market leaders
-
To study the trends and disruptions impacting customers’ businesses, value chain analysis, ecosystem analysis, case study analysis, technology analysis, trade analysis, patent analysis, key conferences and events, investment and funding scenario, regulatory landscape, tariff, standards, Porter’s five forces, and key stakeholders and buying criteria, pertaining to the market
-
To strategically profile the key players and comprehensively analyze their market ranking and core competencies2
-
To analyze competitive developments in the market, such as product launches, contracts, expansions, and mergers & acquisitions.
Note: 1. Micromarkets are defined as the further segments and subsegments of the market included in the report.
2. Core competencies of companies are captured in terms of their key developments and product portfolios, as well as key strategies adopted to sustain their position in the market.
Available Customizations
MarketsandMarkets offers customizations according to the specific needs of the companies with the given market data.
The following customization options are available for the report:
Product Analysis
-
Product matrix, which gives a detailed comparison of the product portfolio of each company
Regional Analysis
-
Further breakdown of the district cooling market, by country
Company Information
-
Detailed analysis and profiling of additional market players (up to five)


Malik
Apr, 2019
Interested in details of pre-commissioning of district cooling plants in UAE. .
Birendra
Feb, 2019
Market estimation and forecast, list of key manufacturers, current global trends present in the market .
Felipe
Feb, 2019
information on efficient cooling solutions for DC application..
Ashish
May, 2017
District cooling market in India and Top 5 metro cities.
Sherif
Jul, 2019
Information on District cooling market.
Mokuv
May, 2022
We are looking for District Cooling Market Size with Global Industry Forecast to 2028.
Ivo
Dec, 2015
Disctict Cooling in Mexico: 1. Market Potential 2. Policy/regulatory framework 3. Business cases .
Anna
Mar, 2016
Interested in DC current related market with MEQuery not Clear region coverage.
Anna
Mar, 2016
Middle East DC market overview, trends and forecast up until 2019; competitive landscape including that in the Middle East ; company profiles..
Lijun
Mar, 2019
District cooling market analysis for P.R. China.
Chadi
Nov, 2016
Information and analysis on District Cooling market in GCC with a focus on Saudi Arabia along with assets, owners, value and capacity, etc..
Teemu
Sep, 2019
Global district cooling market trends and insights on IT business and software vendors related to district cooling.
Danny
Aug, 2019
District Energy systems market insights.
Juan
Jun, 2016
Require colombia market of district cooling and heating market with estimates by cities in colombia .
Tom
Jun, 2019
Information on the OUCs over district cooling, and players active in the US and North American Market.
Elton
Jan, 2019
Detailed information on energy saving industry, forecast, and trends.