ELISpot and FluoroSpot Assay Market by Product (Assay Kit (T Cell and B Cell assay), Analyzer, Ancillary Products), Application (Transplants, Vaccine Development), End User (Hospitals & Clinical Labs, Research Institutes) - Global Forecast to 2027
The global ELISpot and FluoroSpot Assays Market boasts a total value of $274 million in 2022 and is projected to register a growth rate of 7.3% to reach a value of $390 million by 2027. The expansion of this market is majorly due to upsurging cases of chronic diseases such as cancer as well as growing Growth in biotechnology and biopharmaceutical industries. However, availability of other detection technologies is one of the challenge for which may inhibit the growth of this market.
Attractive Opportunities in the ELISpot and FluoroSpot Assays Market
To know about the assumptions considered for the study, Request for Free Sample Report
Global ELISpot and FluoroSpot Assays Market Dynamics
Driver: Increasing Incidence of Chronic and Infectious Diseases and Growing Awareness About Early Disease Diagnosis
The WHO and several other health agencies have highlighted the havoc caused by chronic and infectious diseases:
- Globally, the number of diabetics is expected to grow from 643 million in 2030 to 783 million by 2045. Diabetes resulted in 6.7 million deaths worldwide in 2021, while 541 million people are estimated to be at risk of developing diabetes (Source: International Diabetes Federation).
- According to the WHO, 17.9 million people die of CVDs every year.
- The WHO estimated CVD to be the leading cause of death worldwide; it claimed over 17.9 million lives in 2008. The disease is predicted to claim 23.6 million lives by 2030, mainly due to strokes and heart attacks.
- The WHO underlined the global concern of HIV, which has claimed over 33 million lives; an estimated 38 million people have HIV infections. Due to the efforts of international organizations and the WHO, the disease has been managed with antiviral therapies. Diagnosis has substantially helped disease management—rapid tests and self-tests have become accessible to patients and offer same-day results. The increasing demand for the early-stage diagnosis of disease conditions using ELISpot and FluoroSpot assay products is another major factor driving the market growth. Early disease diagnostics can help to identify disease progression rapidly and effectively. The clinical application of diagnostics is expanding due to growing research in disease diagnostics and initiatives to develop advanced products.
Opportunity: Growth Opportunities in Emerging Economies
To meet the increasing demand for ELISpot and FluoroSpot assay diagnostics in emerging markets, manufacturers are increasingly focusing on acquiring or entering into agreements and partnerships with regional/domestic players for product distribution and manufacturing. For instance, in February 2022, Siemens Healthineers (Germany) and UNICEF (US) entered a partnership to help strengthen fragile health systems in Sub-Saharan Africa by improving access to diagnostics and linkage to treatment. Regulatory policies in the Asia Pacific are more adaptive and business-friendly due to less stringent regulations and data requirements than in the North American and European markets. Also, the increasing competition in mature markets will compel ELISpot and FluoroSpot assay manufacturers to shift focus to emerging markets across the Asia Pacific and Latin America.
Challenge: Availability of Alternative Detection Technologies
Intracellular cytokine staining (ICS), followed by flow cytometry, is the most widely used technology for the measurement of cytokine co-expressing cells. This presents a challenge for FluoroSpot assays, which are relatively new but also used for the same purpose. While FluoroSpot assays provide better sensitivity compared to ICS, the latter is more intensive in terms of performance, which is a key advantage since analyzers need to detect fluorescent spots accurately. This is particularly challenging given the overlapping detection wavelengths of the available fluorescent dyes. To overcome this challenge, many companies in the market are focusing on updating their existing detection technologies. For example, Mabtech AB launched the IRIS analyzer, which is based on the RawSpot technology for the accurate detection of spots.
China is anticipated to account the largest share of APAC ELISpot and FluoroSpot Assays Market
Based on the Apac region, the ELISpot and FluoroSpot Assays Market is divided into China, Japan, and India. China is expected to account the largest share of ELISpot and FluoroSpot Assays Market. The increasing incidence of chronic diseases, including cancer, in the country and the rising focus on vaccine development and cancer research are the major factors supporting the growth of the ELISpot and FluoroSpot assays market in China.
Germany is forecasted as the fastest growing country of ELISpot and FluoroSpot Assays Market in Europe.
Based on the Europe region, the ELISpot and FluoroSpot Assays Market is divided into Germany, UK, Italy, Spain, France, and RoE. Germany is forecasted to the fastest growing market of ELISpot and FluoroSpot Assays Market in Europe. The presence of quality research infrastructure, and increasing collaborations between the government, companies, and research institutions, as well as presence of strong base for biotechnology research are the crucial factor thriving the market growth in Germany.
T cell-based kits in the analytes kit segment to witness the highest shares during the forecast period.”
Based on the Analyte, the ELISpot and FluoroSpot Assays Market is classified into T-Cell-based Kits, B-cell-based Kits, Other analyte Kits. The T-Cell-based Kits segment is expected to dominate. The growth of this market is driven by the rising incidence of severe diseases and continued research into vaccine development and cancer therapy.
North America dominates the global ELISpot and FluoroSpot Assays Market
Based on the region, the ELISpot and FluoroSpot Assays Market is segmented into North America, Europe, Asia Pacific, and the Rest of the World (RoW). North America is expected to dominate the ELISpot and FluoroSpot Assays Market. Growth in the North American market is mainly driven by rising healthcare spending, increasing cases of chronic diseases and availability of favourable healthcare reforms such as the Affordable Care Act and Medicare.
To know about the assumptions considered for the study, download the pdf brochure
Some of the players operating in North American market are Cellular Technology Limited (US), Becton, Dickinson and Company (US), Bio-Techne. (US), Jackson ImmunoResearch Inc (US), and Anogen-Yes Biotech Laboratories Ltd (Canada).
Get online access to the report on the World's First Market Intelligence Cloud
- Easy to Download Historical Data & Forecast Numbers
- Company Analysis Dashboard for high growth potential opportunities
- Research Analyst Access for customization & queries
- Competitor Analysis with Interactive dashboard
- Latest News, Updates & Trend analysis
Request Sample Scope of the Report
Get online access to the report on the World's First Market Intelligence Cloud
- Easy to Download Historical Data & Forecast Numbers
- Company Analysis Dashboard for high growth potential opportunities
- Research Analyst Access for customization & queries
- Competitor Analysis with Interactive dashboard
- Latest News, Updates & Trend analysis
Report Metric |
Details |
Market Size Available for Years |
2017–2027 |
Base Year Considered |
2021 |
Forecast Period |
2022–2027 |
Forecast Units |
Value (USD) |
Segments Covered |
Product, Application, End User, and Region. |
Geographies Covered |
North America (US, Canada), Europe (Germany, France, UK, Spain, Italy, and RoE), APAC (China, India, Japan, and the RoAPAC), and Rest of the World. |
Companies Covered |
Oxford Immunotec (UK), Cellular Technology Limited (US), Mabtech (Sweden), Becton, Dickinson and Company (US), Abcam plc. (UK), Bio-Techne.(US), Mikrogen Diagnostik (Germany), Autoimmun Diagnostika GmbH (Germany), U-CyTech (Netherland), Medix Biochemica (Finland), Merck KGaA (Germany), Bio-Sys GmbH (Germany), Anogen-Yes Biotech Laboratories Ltd (Canada), Abnova Corporation. (Taiwan) |
This research report categorizes the ELISpot and FluoroSpot Assays Market into the following segments and subsegments:
Regional split
- North America
- Europe
- Asia Pacific
- Rest of the World
By product
- Assay Kits
-
Assay Kits Market, by Technique
- ELISpot Assay Kits
- FluoroSpot Assay Kits
-
Assay Kits Market, by Utility
- Diagnostic Kits
- Research Kits
-
Assay Kits Market, by Analyte
- T-cell-based Kits
- B-cell-based Kits
- Other Analyte Kits
- Analyzers
- Ancillary Products
Application
-
Diagnostic Applications
- Infectious Diseases
- Transplants
-
Research Applications
- Vaccine Development
- Clinical Trials
- Cancer Research
End User
- Hospitals and Clinical Laboratories
- Research Institutes
- Biopharmaceutical Companies and CROs
Recent Developments
- In 2021, PerkinElmer acquired Oxford Immunotec Global plc, a company based in Abingdon, UK, for a total consideration of USD 590.9 million.
- In 2022, The company Mabtech has made ELISpot kits available in a 100-plate format. Pre-coated plates are also included to save time and reduce assay variability.
Frequently Asked Questions (FAQs):
What is the size of ELISpot and FluoroSpot Assay Market ?
The global ELISpot and FluoroSpot Assays Market boasts a total value of $274 million in 2022 and is projected to register a growth rate of 7.3% to reach a value of $390 million by 2027.
What are the major growth factors of ELISpot and FluoroSpot Assay Market ?
The expansion of this market is majorly due to upsurging cases of chronic diseases such as cancer as well as growing Growth in biotechnology and biopharmaceutical industries. However, availability of other detection technologies is one of the challenge for which may inhibit the growth of this market.
Who all are the prominent players of ELISpot and FluoroSpot Assay Market ?
Some of the players operating in North American market are Cellular Technology Limited (US), Becton, Dickinson and Company (US), Bio-Techne. (US), Jackson ImmunoResearch Inc (US), and Anogen-Yes Biotech Laboratories Ltd (Canada). .
To speak to our analyst for a discussion on the above findings, click Speak to Analyst
TABLE OF CONTENTS
1 INTRODUCTION (Page No. - 26)
1.1 STUDY OBJECTIVES
1.2 MARKET DEFINITION
1.2.1 INCLUSIONS AND EXCLUSIONS
1.3 MARKET SCOPE
1.3.1 GEOGRAPHIC SCOPE
1.3.2 YEARS CONSIDERED
1.4 CURRENCY
1.5 LIMITATIONS
1.6 MARKET STAKEHOLDERS
1.7 SUMMARY OF CHANGES
2 RESEARCH METHODOLOGY (Page No. - 31)
2.1 RESEARCH DATA
FIGURE 1 RESEARCH DESIGN
2.1.1 SECONDARY DATA
2.1.1.1 Secondary sources
2.1.2 PRIMARY DATA
FIGURE 2 PRIMARY SOURCES
2.1.2.1 Key data from primary sources
2.1.2.2 Key industry insights
2.1.2.3 Breakdown of primary interviews
FIGURE 3 BREAKDOWN OF PRIMARY INTERVIEWS: SUPPLY-SIDE AND DEMAND-SIDE PARTICIPANTS
FIGURE 4 BREAKDOWN OF PRIMARY INTERVIEWS: BY COMPANY TYPE, DESIGNATION, AND REGION
2.2 MARKET SIZE ESTIMATION
FIGURE 5 REVENUE SHARE ANALYSIS ILLUSTRATION: OXFORD IMMUNOTEC (US)
FIGURE 6 MARKET SIZE ESTIMATION: BOTTOM-UP APPROACH
2.2.1 GROWTH FORECAST
FIGURE 7 CAGR PROJECTIONS: SUPPLY-SIDE ANALYSIS
FIGURE 8 TOP-DOWN APPROACH
2.3 MARKET BREAKDOWN AND DATA TRIANGULATION
FIGURE 9 DATA TRIANGULATION METHODOLOGY
2.4 MARKET SHARE ANALYSIS
2.5 STUDY ASSUMPTIONS
2.6 RISK ASSESSMENT
TABLE 1 RISK ASSESSMENT
3 EXECUTIVE SUMMARY (Page No. - 42)
FIGURE 10 ELISPOT AND FLUOROSPOT ASSAYS MARKET, BY PRODUCT, 2022 VS. 2027 (USD MILLION)
FIGURE 11 ELISPOT AND FLUOROSPOT ASSAYS MARKET, BY APPLICATION, 2022 VS. 2027 (USD MILLION)
FIGURE 12 ELISPOT AND FLUOROSPOT ASSAYS MARKET, BY END USER, 2022 VS. 2027 (USD MILLION)
FIGURE 13 ELISPOT AND FLUOROSPOT ASSAYS MARKET, BY REGION, 2022 VS. 2027 (USD MILLION)
4 PREMIUM INSIGHTS (Page No. - 45)
4.1 ELISPOT AND FLUOROSPOT ASSAYS MARKET OVERVIEW
FIGURE 14 RISING INCIDENCE OF CHRONIC AND INFECTIOUS DISEASES TO DRIVE MARKET
4.2 ELISPOT AND FLUOROSPOT ASSAY KITS MARKET, BY TECHNIQUE, 2022–2027
FIGURE 15 ELISPOT ASSAY KITS SEGMENT TO REGISTER HIGHEST GROWTH DURING FORECAST PERIOD
4.3 NORTH AMERICA: ELISPOT AND FLUOROSPOT ASSAYS MARKET, BY PRODUCT AND COUNTRY (2022)
FIGURE 16 ASSAYS KITS SEGMENT TO DOMINATE NORTH AMERICAN ELISPOT AND FLUOROSPOT ASSAYS MARKET IN 2022
4.4 ELISPOT AND FLUOROSPOT ASSAYS MARKET: GEOGRAPHIC GROWTH OPPORTUNITIES
FIGURE 17 ASIA PACIFIC COUNTRIES TO REGISTER HIGHER GROWTH FROM 2022 TO 2027
5 MARKET OVERVIEW (Page No. - 48)
5.1 INTRODUCTION
5.2 MARKET DYNAMICS
FIGURE 18 ELISPOT AND FLUOROSPOT ASSAYS MARKET: DRIVERS, RESTRAINTS, OPPORTUNITIES, AND CHALLENGES
5.2.1 DRIVERS
5.2.1.1 Increasing incidence of chronic and infectious diseases and growing awareness about early disease diagnosis
FIGURE 19 INCIDENCE OF DIABETES, BY REGION, 2019 VS. 2030 VS. 2045 (MILLION)
TABLE 2 GLOBAL INCIDENCE OF INFECTIOUS DISEASES
5.2.1.2 Increasing vaccine development to address challenges of antimicrobial resistance
5.2.1.3 Increasing use of ELISpot and FluoroSpot assays in oncology
TABLE 3 INCIDENCE OF CANCER IN MEN, 2020
TABLE 4 INCIDENCE OF CANCER IN WOMEN, 2020
5.2.1.4 ELISpot assays as diagnostic tool in drug hypersensitivity reaction
TABLE 5 EXAMPLES OF ELISPOT ASSAYS IN DRUG HYPERSENSITIVITY REACTIONS
5.2.1.5 Growth in biotechnology and biopharmaceutical industries
5.2.2 OPPORTUNITIES
5.2.2.1 Use of FluoroSpot assays for multiple-analyte detection in single well
5.2.2.2 Growth opportunities in emerging economies
FIGURE 20 HEALTHCARE EXPENDITURE PER CAPITA IN BRIC COUNTRIES, 2012–2019
5.2.3 CHALLENGES
5.2.3.1 Availability of alternative detection technologies
5.2.3.2 Dearth of skilled professionals
5.2.4 RESTRAINTS
5.2.4.1 Stringent requirements for approval of ELISpot and FluoroSpot assay instruments and consumables
5.3 RANGES/SCENARIOS
FIGURE 21 PESSIMISTIC SCENARIO
FIGURE 22 OPTIMISTIC SCENARIO
FIGURE 23 REALISTIC SCENARIO
5.4 VALUE CHAIN ANALYSIS
FIGURE 24 VALUE CHAIN ANALYSIS: MAJOR VALUE ADDED DURING MANUFACTURING AND ASSEMBLY PHASES
5.5 SUPPLY CHAIN ANALYSIS
FIGURE 25 DIRECT DISTRIBUTION—PREFERRED STRATEGY FOR PROMINENT COMPANIES
5.6 TECHNOLOGY ANALYSIS
5.7 PORTER’S FIVE FORCES ANALYSIS
5.7.1 THREAT OF NEW ENTRANTS
5.7.2 INTENSITY OF COMPETITIVE RIVALRY
5.7.3 BARGAINING POWER OF BUYERS
5.7.4 BARGAINING POWER OF SUPPLIERS
5.7.5 THREAT OF SUBSTITUTES
5.8 KEY STAKEHOLDERS AND BUYING CRITERIA
5.8.1 KEY STAKEHOLDERS IN BUYING PROCESS
FIGURE 26 INFLUENCE OF STAKEHOLDERS ON BUYING PROCESS FOR TOP THREE END USERS
TABLE 6 INFLUENCE OF STAKEHOLDERS ON BUYING PROCESS FOR TOP THREE END USERS (%)
5.8.2 BUYING CRITERIA
FIGURE 27 KEY BUYING CRITERIA FOR TOP THREE END USERS
TABLE 7 KEY BUYING CRITERIA FOR TOP THREE END USERS
5.9 REGULATORY LANDSCAPE
TABLE 8 REGULATORY AUTHORITIES GOVERNING ELISPOT AND FLUOROSPOT ASSAYS MARKET
5.9.1 US
TABLE 9 US: CLASSIFICATION OF ELISPOT AND FLUOROSPOT ASSAY PRODUCTS
FIGURE 28 US: REGULATORY PROCESS FOR IVD DEVICES
5.9.2 CANADA
FIGURE 29 CANADA: REGULATORY PROCESS FOR IVD DEVICES
5.9.3 EUROPE
TABLE 10 EUROPE: CLASSIFICATION OF IVD DEVICES
5.9.4 JAPAN
FIGURE 30 JAPAN: REGULATORY PROCESS FOR IVD DEVICES
TABLE 11 JAPAN: TIME, COST, AND COMPLEXITY OF REGISTRATION PROCESS
5.9.5 CHINA
TABLE 12 CHINA: TIME, COST, AND COMPLEXITY OF REGISTRATION PROCESS
5.9.6 INDIA
FIGURE 31 INDIA: REGULATORY PROCESS FOR IVD DEVICES
5.9.7 RUSSIA
TABLE 13 RUSSIA: CLASSIFICATION OF IVD DEVICES
5.9.8 SAUDI ARABIA
TABLE 14 SAUDI ARABIA: TIME, COST, AND COMPLEXITY OF REGISTRATION PROCESS
5.9.9 MEXICO
FIGURE 32 MEXICO: REGULATORY PROCESS FOR IVD DEVICES
TABLE 15 MEXICO: TIME, COST, AND COMPLEXITY OF REGISTRATION PROCESS
5.9.10 BRAZIL
FIGURE 33 BRAZIL: REGULATORY PROCESS FOR IVD DEVICES
5.9.11 SOUTH KOREA
TABLE 16 SOUTH KOREA: TIME, COST, AND COMPLEXITY OF REGISTRATION PROCESS
5.9.12 MIDDLE EAST
5.9.13 AFRICA
5.10 KEY CONFERENCES AND EVENTS IN 2022 AND 2023
TABLE 17 LIST OF CONFERENCES AND EVENTS
5.11 PATENT ANALYSIS
5.12 PRICING ANALYSIS
TABLE 18 ELISPOT AND FLUOROSPOT ASSAYS MARKET: PRICE RANGE FOR ELISPOT AND FLUOROSPOT ASSAY PRODUCTS
5.13 TRADE ANALYSIS
5.13.1 TRADE ANALYSIS FOR ELISPOT AND FLUOROSPOT ASSAYS
TABLE 19 IMPORT DATA FOR HS CODE 382200, BY COUNTRY, 2017–2021 (USD MILLION)
TABLE 20 EXPORT DATA FOR HS CODE 382200, BY COUNTRY, 2017–2021 (USD MILLION)
5.14 ECOSYSTEM ANALYSIS
5.14.1 ROLE IN ECOSYSTEM
FIGURE 34 KEY PLAYERS OPERATING IN ELISPOT AND FLUOROSPOT ASSAYS MARKET
5.15 TRENDS/DISRUPTIONS IMPACTING CUSTOMERS’ BUSINESSES
6 ELISPOT AND FLUOROSPOT ASSAYS MARKET, BY PRODUCT (Page No. - 81)
6.1 INTRODUCTION
TABLE 21 ELISPOT AND FLUOROSPOT ASSAYS MARKET, BY PRODUCT, 2020–2027 (USD MILLION)
6.2 ASSAY KITS
TABLE 22 ELISPOT AND FLUOROSPOT ASSAY KITS MARKET, BY REGION, 2020–2027 (USD MILLION)
6.2.1 ASSAY KITS MARKET, BY TECHNIQUE
TABLE 23 ELISPOT AND FLUOROSPOT ASSAY KITS MARKET, BY TECHNIQUE, 2020–2027 (USD MILLION)
6.2.1.1 ELISpot assay kits
6.2.1.1.1 Need for highly sensitive immune monitoring requirements in clinical trials to drive market
TABLE 24 ELISPOT ASSAY KITS MARKET, BY REGION, 2020–2027 (USD MILLION)
6.2.1.2 FluoroSpot assay kits
6.2.1.2.1 Increasing demand for multiple analyte detection and technological advancements to support market growth
TABLE 25 FLUOROSPOT ASSAY KITS MARKET, BY REGION, 2020–2027 (USD MILLION)
6.2.2 ASSAY KITS MARKET, BY UTILITY
TABLE 26 ELISPOT AND FLUOROSPOT ASSAY KITS MARKET, BY UTILITY, 2020–2027 (USD MILLION)
6.2.2.1 Diagnostic kits
6.2.2.1.1 Used for detection of infectious and autoimmune diseases
TABLE 27 DIAGNOSTIC KITS MARKET, BY REGION, 2020–2027 (USD MILLION)
6.2.2.2 Research kits
6.2.2.2.1 Continued investment in vaccine research, clinical trials, and cancer research to drive market
TABLE 28 RESEARCH KITS MARKET, BY REGION, 2020–2027 (USD MILLION)
6.2.3 ASSAY KITS MARKET, BY ANALYTE
TABLE 29 ELISPOT AND FLUOROSPOT ASSAY KITS MARKET, BY ANALYTE, 2020–2027 (USD MILLION)
6.2.3.1 T-cell-based kits
6.2.3.1.1 Low concentrations of infection-released analytes necessitate use of T-cell-based kits
TABLE 30 T-CELL-BASED KITS MARKET, BY REGION, 2020–2027 (USD MILLION)
6.2.3.2 B-cell-based kits
6.2.3.2.1 Detection of B-cell-based antibodies useful to study cell response post-infection/vaccination
TABLE 31 B-CELL-BASED KITS MARKET, BY REGION, 2020–2027 (USD MILLION)
6.2.3.3 Other analyte kits
TABLE 32 OTHER ANALYTE KITS MARKET, BY REGION, 2020–2027 (USD MILLION)
6.3 ANALYZERS
6.3.1 ADOPTION OF ASSAY KITS TO DRIVE USE OF ANALYZERS
TABLE 33 ELISPOT AND FLUOROSPOT ANALYZERS MARKET, BY REGION, 2020–2027 (USD MILLION)
6.4 ANCILLARY PRODUCTS
6.4.1 MARKET PLAYERS SUCH AS THERMO FISHER SCIENTIFIC PROVIDE ANCILLARY PRODUCTS
TABLE 34 ELISPOT AND FLUOROSPOT ANCILLARY PRODUCTS MARKET, BY REGION, 2020–2027 (USD MILLION)
7 ELISPOT AND FLUOROSPOT ASSAYS MARKET, BY APPLICATION (Page No. - 90)
7.1 INTRODUCTION
TABLE 35 ELISPOT AND FLUOROSPOT ASSAYS MARKET, BY APPLICATION, 2020–2027 (USD MILLION)
7.2 DIAGNOSTIC APPLICATIONS
TABLE 36 ELISPOT AND FLUOROSPOT ASSAYS MARKET FOR DIAGNOSTIC APPLICATIONS, BY TYPE, 2020–2027 (USD MILLION)
TABLE 37 ELISPOT AND FLUOROSPOT ASSAYS MARKET FOR DIAGNOSTIC APPLICATIONS, BY REGION, 2020–2027 (USD MILLION)
7.2.1 INFECTIOUS DISEASES
7.2.1.1 Infectious diseases segment dominates diagnostic applications market
FIGURE 35 US: TOTAL CASES OF TICKBORNE DISEASES, 2004–2019
TABLE 38 ELISPOT AND FLUOROSPOT ASSAYS MARKET FOR INFECTIOUS DISEASES, BY REGION, 2020–2027 (USD MILLION)
7.2.2 TRANSPLANTS
7.2.2.1 Growing incidence of infections caused during transplant procedures to drive demand for ELISpot and FluoroSpot assays
TABLE 39 ELISPOT AND FLUOROSPOT ASSAYS MARKET FOR TRANSPLANTS, BY REGION, 2020–2027 (USD MILLION)
7.3 RESEARCH APPLICATIONS
TABLE 40 ELISPOT AND FLUOROSPOT ASSAYS MARKET FOR RESEARCH APPLICATIONS, BY TYPE, 2020–2027 (USD MILLION)
TABLE 41 ELISPOT AND FLUOROSPOT ASSAYS MARKET FOR RESEARCH APPLICATIONS, BY REGION, 2020–2027 (USD MILLION)
7.3.1 VACCINE DEVELOPMENT
7.3.1.1 Largest and fastest-growing segment of market
TABLE 42 ELISPOT AND FLUOROSPOT ASSAYS MARKET FOR VACCINE DEVELOPMENT, BY REGION, 2020–2027 (USD MILLION)
7.3.2 CLINICAL TRIALS
7.3.2.1 Growing number of clinical trials to drive demand for ELISpot and FluoroSpot assays
FIGURE 36 NUMBER OF CLINICAL TRIALS, BY REGION, 2010–2021
TABLE 43 ELISPOT AND FLUOROSPOT ASSAYS MARKET FOR CLINICAL TRIALS, BY REGION, 2020–2027 (USD MILLION)
7.3.3 CANCER RESEARCH
7.3.3.1 Rising prevalence of cancer to support market growth
TABLE 44 ELISPOT AND FLUOROSPOT ASSAYS MARKET FOR CANCER RESEARCH, BY REGION, 2020–2027 (USD MILLION)
8 ELISPOT AND FLUOROSPOT ASSAYS MARKET, BY END USER (Page No. - 98)
8.1 INTRODUCTION
TABLE 45 ELISPOT AND FLUOROSPOT ASSAYS MARKET, BY END USER, 2020–2027 (USD MILLION)
8.2 HOSPITAL AND CLINICAL LABORATORIES
8.2.1 LARGEST END USERS OF ELISPOT AND FLUOROSPOT ASSAYS
TABLE 46 ELISPOT AND FLUOROSPOT ASSAYS MARKET FOR HOSPITAL AND CLINICAL LABORATORIES, BY REGION, 2020–2027 (USD MILLION)
8.3 RESEARCH INSTITUTES
8.3.1 FASTEST-GROWING END USERS OF ELISPOT AND FLUOROSPOT ASSAYS
TABLE 47 ELISPOT AND FLUOROSPOT ASSAYS MARKET FOR RESEARCH INSTITUTES, BY REGION, 2020–2027 (USD MILLION)
8.4 BIOPHARMACEUTICAL COMPANIES AND CONTRACT RESEARCH ORGANIZATIONS
8.4.1 BIOPHARMACEUTICAL COMPANIES AND CROS USE ELISPOT AND FLUOROSPOT ASSAYS FOR VACCINE DEVELOPMENT, CLINICAL TRIALS, AND CANCER RESEARCH
TABLE 48 ELISPOT AND FLUOROSPOT ASSAYS MARKET FOR BIOPHARMACEUTICAL COMPANIES AND CROS, BY REGION, 2020–2027 (USD MILLION)
9 ELISPOT AND FLUOROSPOT ASSAYS MARKET, BY REGION (Page No. - 103)
9.1 INTRODUCTION
TABLE 49 ELISPOT AND FLUOROSPOT ASSAYS MARKET, BY REGION, 2020–2027 (USD MILLION)
9.2 NORTH AMERICA
FIGURE 37 NORTH AMERICA: ELISPOT AND FLUOROSPOT ASSAYS MARKET SNAPSHOT
TABLE 50 NORTH AMERICA: ELISPOT AND FLUOROSPOT ASSAYS MARKET, BY COUNTRY, 2020–2027 (USD MILLION)
TABLE 51 NORTH AMERICA: ELISPOT AND FLUOROSPOT ASSAYS MARKET, BY PRODUCT, 2020–2027 (USD MILLION)
TABLE 52 NORTH AMERICA: ELISPOT AND FLUOROSPOT ASSAYS MARKET, BY APPLICATION, 2020–2027 (USD MILLION)
TABLE 53 NORTH AMERICA: ELISPOT AND FLUOROSPOT ASSAYS MARKET, BY END USER, 2020–2027 (USD MILLION)
9.2.1 US
9.2.1.1 US dominates North American ELISpot and FluoroSpot assays market
TABLE 54 US: ELISPOT AND FLUOROSPOT ASSAYS MARKET, BY PRODUCT, 2020–2027 (USD MILLION)
TABLE 55 US: ELISPOT AND FLUOROSPOT ASSAYS MARKET, BY APPLICATION, 2020–2027 (USD MILLION)
TABLE 56 US: ELISPOT AND FLUOROSPOT ASSAYS MARKET, BY END USER, 2020–2027 (USD MILLION)
9.2.2 CANADA
9.2.2.1 High burden of chronic diseases and rising healthcare expenditure to drive adoption of ELISpot and FluoroSpot assays
TABLE 57 CANADA: ELISPOT AND FLUOROSPOT ASSAYS MARKET, BY PRODUCT, 2020–2027 (USD MILLION)
TABLE 58 CANADA: ELISPOT AND FLUOROSPOT ASSAYS MARKET, BY APPLICATION, 2020–2027 (USD MILLION)
TABLE 59 CANADA: ELISPOT AND FLUOROSPOT ASSAYS MARKET, BY END USER, 2020–2027 (USD MILLION)
9.3 EUROPE
FIGURE 38 GLOBAL VACCINE PRODUCTION
TABLE 60 EUROPE: ELISPOT AND FLUOROSPOT ASSAYS MARKET, BY COUNTRY, 2020–2027 (USD MILLION)
TABLE 61 EUROPE: ELISPOT AND FLUOROSPOT ASSAYS MARKET, BY PRODUCT, 2020–2027 (USD MILLION)
TABLE 62 EUROPE: ELISPOT AND FLUOROSPOT ASSAYS MARKET, BY APPLICATION, 2020–2027 (USD MILLION)
TABLE 63 EUROPE: ELISPOT AND FLUOROSPOT ASSAYS MARKET, BY END USER, 2020–2027 (USD MILLION)
9.3.1 GERMANY
9.3.1.1 Fastest-growing country in European ELISpot and FluoroSpot assays market
TABLE 64 GERMANY: ELISPOT AND FLUOROSPOT ASSAYS MARKET, BY PRODUCT, 2020–2027 (USD MILLION)
TABLE 65 GERMANY: ELISPOT AND FLUOROSPOT ASSAYS MARKET, BY APPLICATION, 2020–2027 (USD MILLION)
TABLE 66 GERMANY: ELISPOT AND FLUOROSPOT ASSAYS MARKET, BY END USER, 2020–2027 (USD MILLION)
9.3.2 UK
9.3.2.1 Rising prevalence of NCDs to drive market
TABLE 67 UK: ELISPOT AND FLUOROSPOT ASSAYS MARKET, BY PRODUCT, 2020–2027 (USD MILLION)
TABLE 68 UK: ELISPOT AND FLUOROSPOT ASSAYS MARKET, BY APPLICATION, 2020–2027 (USD MILLION)
TABLE 69 UK: ELISPOT AND FLUOROSPOT ASSAYS MARKET, BY END USER, 2020–2027 (USD MILLION)
9.3.3 FRANCE
9.3.3.1 Need for early disease diagnosis to support market growth
TABLE 70 FRANCE: ELISPOT AND FLUOROSPOT ASSAYS MARKET, BY PRODUCT, 2020–2027 (USD MILLION)
TABLE 71 FRANCE: ELISPOT AND FLUOROSPOT ASSAYS MARKET, BY APPLICATION, 2020–2027 (USD MILLION)
TABLE 72 FRANCE: ELISPOT AND FLUOROSPOT ASSAYS MARKET, BY END USER, 2020–2027 (USD MILLION)
9.3.4 ITALY
9.3.4.1 Growing geriatric population and increasing support for research to support market
TABLE 73 ITALY: ELISPOT AND FLUOROSPOT ASSAYS MARKET, BY PRODUCT, 2020–2027 (USD MILLION)
TABLE 74 ITALY: ELISPOT AND FLUOROSPOT ASSAYS MARKET, BY APPLICATION, 2020–2027 (USD MILLION)
TABLE 75 ITALY: ELISPOT AND FLUOROSPOT ASSAYS MARKET, BY END USER, 2020–2027 (USD MILLION)
9.3.5 SPAIN
9.3.5.1 High incidence of chronic diseases to drive market
TABLE 76 SPAIN: ELISPOT AND FLUOROSPOT ASSAYS MARKET, BY PRODUCT, 2020–2027 (USD MILLION)
TABLE 77 SPAIN: ELISPOT AND FLUOROSPOT ASSAYS MARKET, BY APPLICATION, 2020–2027 (USD MILLION)
TABLE 78 SPAIN: ELISPOT AND FLUOROSPOT ASSAYS MARKET, BY END USER, 2020–2027 (USD MILLION)
9.3.6 REST OF EUROPE
TABLE 79 REST OF EUROPE: ELISPOT AND FLUOROSPOT ASSAYS MARKET, BY PRODUCT, 2020–2027 (USD MILLION)
TABLE 80 REST OF EUROPE: ELISPOT AND FLUOROSPOT ASSAYS MARKET, BY APPLICATION, 2020–2027 (USD MILLION)
TABLE 81 REST OF EUROPE: ELISPOT AND FLUOROSPOT ASSAYS MARKET, BY END USER, 2020–2027 (USD MILLION)
9.4 ASIA PACIFIC
FIGURE 39 ASIA PACIFIC: ELISPOT AND FLUOROSPOT ASSAYS MARKET SNAPSHOT
TABLE 82 ASIA PACIFIC: ELISPOT AND FLUOROSPOT ASSAYS MARKET, BY COUNTRY, 2020–2027 (USD MILLION)
TABLE 83 ASIA PACIFIC: ELISPOT AND FLUOROSPOT ASSAYS MARKET, BY PRODUCT, 2020–2027 (USD MILLION)
TABLE 84 ASIA PACIFIC: ELISPOT AND FLUOROSPOT ASSAYS MARKET, BY APPLICATION, 2020–2027 (USD MILLION)
TABLE 85 ASIA PACIFIC: ELISPOT AND FLUOROSPOT ASSAYS MARKET, BY END USER, 2020–2027 (USD MILLION)
9.4.1 CHINA
9.4.1.1 Rising focus on vaccine development and cancer research to drive market
TABLE 86 CHINA: ELISPOT AND FLUOROSPOT ASSAYS MARKET, BY PRODUCT, 2020–2027 (USD MILLION)
TABLE 87 CHINA: ELISPOT AND FLUOROSPOT ASSAYS MARKET, BY APPLICATION, 2020–2027 (USD MILLION)
TABLE 88 CHINA: ELISPOT AND FLUOROSPOT ASSAYS MARKET, BY END USER, 2020–2027 (USD MILLION)
9.4.2 JAPAN
9.4.2.1 Increased focus on vaccine research and rising prevalence of chronic diseases to drive market
TABLE 89 JAPAN: ELISPOT AND FLUOROSPOT ASSAYS MARKET, BY PRODUCT, 2020–2027 (USD MILLION)
TABLE 90 JAPAN: ELISPOT AND FLUOROSPOT ASSAYS MARKET, BY APPLICATION, 2020–2027 (USD MILLION)
TABLE 91 JAPAN: ELISPOT AND FLUOROSPOT ASSAYS MARKET, BY END USER, 2020–2027 (USD MILLION)
9.4.3 INDIA
9.4.3.1 High incidence of chronic diseases and growing vaccine R&D activity to drive market
TABLE 92 INDIA: ELISPOT AND FLUOROSPOT ASSAYS MARKET, BY PRODUCT, 2020–2027 (USD MILLION)
TABLE 93 INDIA: ELISPOT AND FLUOROSPOT ASSAYS MARKET, BY APPLICATION, 2020–2027 (USD MILLION)
TABLE 94 INDIA: ELISPOT AND FLUOROSPOT ASSAYS MARKET, BY END USER, 2020–2027 (USD MILLION)
9.4.4 REST OF ASIA PACIFIC
TABLE 95 REST OF ASIA PACIFIC: ELISPOT AND FLUOROSPOT ASSAYS MARKET, BY PRODUCT, 2020–2027 (USD MILLION)
TABLE 96 REST OF ASIA PACIFIC: ELISPOT AND FLUOROSPOT ASSAYS MARKET, BY APPLICATION, 2020–2027 (USD MILLION)
TABLE 97 REST OF ASIA PACIFIC: ELISPOT AND FLUOROSPOT ASSAYS MARKET, BY END USER, 2020–2027 (USD MILLION)
9.5 REST OF THE WORLD
TABLE 98 REST OF THE WORLD: ELISPOT AND FLUOROSPOT ASSAYS MARKET, BY PRODUCT, 2020–2027 (USD MILLION)
TABLE 99 REST OF THE WORLD: ELISPOT AND FLUOROSPOT ASSAYS MARKET, BY APPLICATION, 2020–2027 (USD MILLION)
TABLE 100 REST OF THE WORLD: ELISPOT AND FLUOROSPOT ASSAYS MARKET, BY END USER, 2020–2027 (USD MILLION)
10 COMPETITIVE LANDSCAPE (Page No. - 132)
10.1 OVERVIEW
10.2 STRATEGIES ADOPTED BY KEY PLAYERS/RIGHT TO WIN
TABLE 101 OVERVIEW OF STRATEGIES ADOPTED BY KEY PLAYERS IN ELISPOT AND FLUOROSPOT ASSAYS MARKET
10.3 REVENUE SHARE ANALYSIS
FIGURE 40 REVENUE ANALYSIS OF KEY PUBLIC PLAYERS IN ELISPOT AND FLUOROSPOT ASSAYS MARKET
10.4 MARKET SHARE ANALYSIS
TABLE 102 ELISPOT AND FLUOROSPOT ASSAYS MARKET: DEGREE OF COMPETITION
10.5 COMPANY EVALUATION QUADRANT
10.5.1 STARS
10.5.2 EMERGING LEADERS
10.5.3 PERVASIVE PLAYERS
10.5.4 PARTICIPANTS
FIGURE 41 COMPANY EVALUATION QUADRANT: ELISPOT AND FLUOROSPOT ASSAYS MARKET, 2021
10.6 COMPANY EVALUATION QUADRANT FOR SMES/STARTUPS
10.6.1 PROGRESSIVE COMPANIES
10.6.2 STARTING BLOCKS
10.6.3 RESPONSIVE COMPANIES
10.6.4 DYNAMIC COMPANIES
FIGURE 42 COMPANY EVALUATION MATRIX FOR SMES/STARTUPS: ELISPOT AND FLUOROSPOT ASSAYS MARKET, 2021
10.7 FOOTPRINT ANALYSIS OF COMPANIES
TABLE 103 FOOTPRINT ANALYSIS OF COMPANIES
TABLE 104 PRODUCT FOOTPRINT OF COMPANIES
TABLE 105 REGIONAL FOOTPRINT OF COMPANIES
10.8 COMPETITIVE BENCHMARKING
TABLE 106 ELISPOT AND FLUOROSPOT ASSAYS MARKET: DETAILED LIST OF KEY STARTUPS/SMES
10.9 COMPETITIVE SCENARIO
10.9.1 PRODUCT LAUNCHES
TABLE 107 KEY PRODUCT LAUNCHES
10.9.2 DEALS
TABLE 108 KEY DEALS
10.9.3 OTHER DEVELOPMENTS
TABLE 109 OTHER KEY DEVELOPMENTS
11 COMPANY PROFILES (Page No. - 144)
11.1 KEY PLAYERS
(Business Overview, Products Offered, Recent Developments, and MnM View)*
11.1.1 OXFORD IMMUNOTEC LTD. (SUBSIDIARY OF PERKINELMER, INC.)
TABLE 110 OXFORD IMMUNOTEC LTD.: BUSINESS OVERVIEW
FIGURE 43 OXFORD IMMUNOTEC LTD. (SUBSIDIARY OF PERKINELMER, INC.): COMPANY SNAPSHOT (2022)
11.1.2 BECTON, DICKINSON AND COMPANY
TABLE 111 BECTON, DICKINSON AND COMPANY: BUSINESS OVERVIEW
FIGURE 44 BECTON, DICKINSON AND COMPANY: COMPANY SNAPSHOT (2021)
11.1.3 CELLULAR TECHNOLOGY LIMITED
TABLE 112 CELLULAR TECHNOLOGY LIMITED: BUSINESS OVERVIEW
11.1.4 MABTECH
TABLE 113 MABTECH: BUSINESS OVERVIEW
11.1.5 ABCAM PLC
TABLE 114 ABCAM PLC: BUSINESS OVERVIEW
FIGURE 45 ABCAM PLC: COMPANY SNAPSHOT (2021)
11.1.6 BIO-TECHNE
TABLE 115 BIO-TECHNE: BUSINESS OVERVIEW
FIGURE 46 BIO-TECHNE: COMPANY SNAPSHOT (2022)
11.1.7 MERCK KGAA
TABLE 116 MERCK KGAA: BUSINESS OVERVIEW
FIGURE 47 MERCK KGAA: COMPANY SNAPSHOT (2021)
11.1.8 AUTOIMMUN DIAGNOSTIKA GMBH
TABLE 117 AUTOIMMUN DIAGNOSTIKA GMBH: BUSINESS OVERVIEW
11.1.9 U-CYTECH
TABLE 118 U-CYTECH: BUSINESS OVERVIEW
11.1.10 MIKROGEN DIAGNOSTIK
TABLE 119 MIKROGEN DIAGNOSTIK: BUSINESS OVERVIEW
11.1.11 MEDIX BIOCHEMICA
TABLE 120 MEDIX BIOCHEMICA: BUSINESS OVERVIEW
11.1.12 ABNOVA CORPORATION
TABLE 121 ABNOVA CORPORATION: BUSINESS OVERVIEW
11.1.13 ANOGEN-YES BIOTECH LABORATORIES LTD.
TABLE 122 ANOGEN-YES BIOTECH LABORATORIES LTD.: BUSINESS OVERVIEW
11.1.14 BIORBYT LTD.
TABLE 123 BIORBYT LTD.: BUSINESS OVERVIEW
11.1.15 BIO-SYS GMBH
TABLE 124 BIO-SYS GMBH: BUSINESS OVERVIEW
11.2 OTHER PLAYERS
11.2.1 JACKSON IMMUNORESEARCH INC.
TABLE 125 JACKSON IMMUNORESEARCH INC.: BUSINESS OVERVIEW
11.2.2 IST SCIENTIFIC LTD.
TABLE 126 IST SCIENTIFIC LTD.: BUSINESS OVERVIEW
11.2.3 SERVA ELECTROPHORESIS GMBH
TABLE 127 SERVA ELECTROPHORESIS GMBH: BUSINESS OVERVIEW
11.2.4 KRISHGEN BIOSYSTEMS
TABLE 128 KRISHGEN BIOSYSTEMS: BUSINESS OVERVIEW
11.2.5 NATIONAL ANALYTICAL CORPORATION
TABLE 129 NATIONAL ANALYTICAL CORPORATION: BUSINESS OVERVIEW
11.2.6 STEMCELL TECHNOLOGIES INC.
TABLE 130 STEMCELL TECHNOLOGIES INC.: BUSINESS OVERVIEW
11.2.7 ZENBIO, INC.
TABLE 131 ZENBIO, INC.: BUSINESS OVERVIEW
11.2.8 BOC SCIENCES
TABLE 132 BOC SCIENCES: BUSINESS OVERVIEW
11.2.9 TOKYO CHEMICAL INDUSTRY CO., LTD.
TABLE 133 TOKYO CHEMICAL INDUSTRY CO., LTD.: BUSINESS OVERVIEW
11.2.10 MP BIOMEDICALS
TABLE 134 MP BIOMEDICALS: BUSINESS OVERVIEW
* Business Overview, Products Offered, Recent Developments, and MnM View might not be captured in case of unlisted companies.
12 APPENDIX (Page No. - 184)
12.1 INDUSTRY INSIGHTS
12.2 DISCUSSION GUIDE
12.3 KNOWLEDGESTORE: MARKETSANDMARKETS’ SUBSCRIPTION PORTAL
12.4 CUSTOMIZATION OPTIONS
12.5 RELATED REPORTS
12.6 AUTHOR DETAILS
The study involved four major activities in estimating the current size of the ELISpot and FluoroSpot Assays Market. Exhaustive secondary research was done to collect information on the market and its different subsegments. The next step was to validate these findings, assumptions, and sizing with industry experts across the value chain through primary research. Both top-down and bottom-up approaches were employed to estimate the complete market size. After that, market breakdown and data triangulation procedures were used to eastimate the market size of the segments and subsegments.
Secondary Research
In the secondary research process, various secondary sources such as annual reports, press releases & investor presentations of companies, white papers, certified publications, articles by recognized authors, gold-standard & silver-standard websites, regulatory bodies, and databases (such as D&B Hoovers, Bloomberg Business, and Factiva) were referred to identify and collect information for this study.
Primary Research
Extensive primary research was conducted after acquiring knowledge about the global market scenario through secondary research. Primary interviews were conducted from both the demand (Doctors, Surgeons) and supply sides (ELISpot and FluoroSpot manufacturers and distributors).
The following is a breakdown of the primary respondents:
Breakdown of Primary Participants:
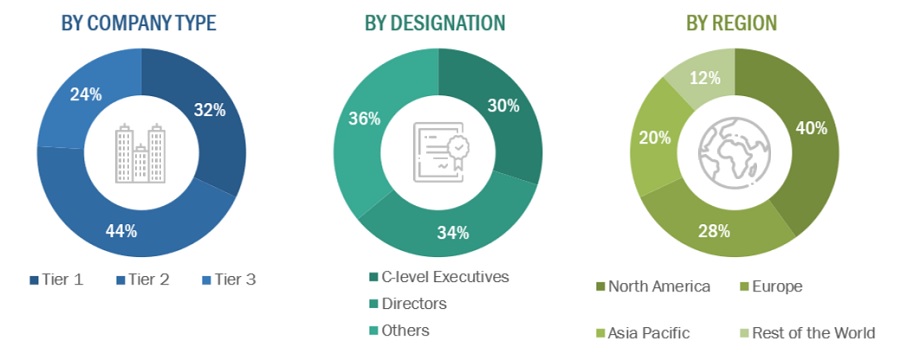
Note 1: Others include sales managers, marketing managers, and product managers.
Note 2. Tiers of companies are defined based on their total revenue. As of 2021: Tier 1 = >USD 5 billion, Tier 2 = USD 500 million to USD 5 billion, and Tier 3 =
To know about the assumptions considered for the study, download the pdf brochure
Market Size Estimation
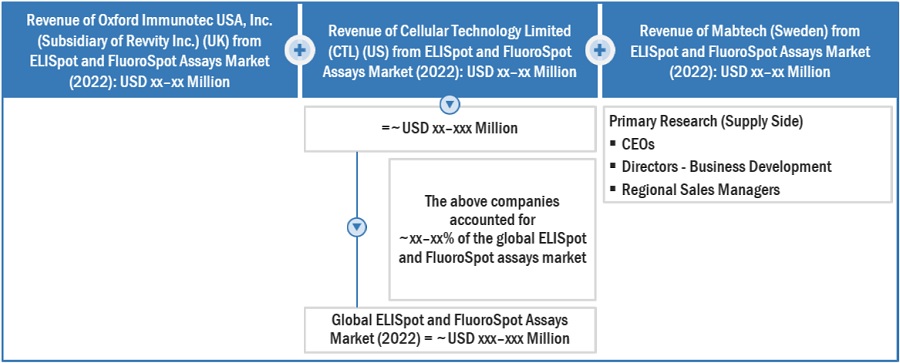
Both top-down and bottom-up approaches were used to estimate and validate the total size of the ELISpot and FluoroSpot Assays Market. These methods were also used extensively to estimate the size of various subsegments in the market. The research methodology used to estimate the market size includes the following:
- The key players in the industry and markets have been identified through extensive secondary research
- The industry’s supply chain and market size, in terms of value, have been determined through primary and secondary research processes
- All percentage shares, splits, and breakdowns have been determined using secondary sources and verified through primary sources
Data Triangulation
After arriving at the overall market size—using the market size estimation processes—the market was split into several segments and subsegments. To complete the overall market engineering process and arrive at the exact statistics of each market segment and subsegment, the data triangulation, and market breakdown procedures were employed, wherever applicable. The data was triangulated by studying various factors and trends from both the demand and supply sides in the ELISpot and FluoroSpot Assays Market industry.
Report Objectives
- To define, describe, and forecast the global ELISpot and FluoroSpot Assays Market based on product, Application, End User and Region.
- To provide detailed information regarding the major factors influencing the growth of the market (drivers, opportunities, and industry-specific challenges)
- To strategically analyze micromarkets1 with respect to individual growth trends, future prospects, and contributions to the total market
- To analyze opportunities in the market for stakeholders and provide details of the competitive landscape for market leaders
- To forecast the size of market segments with respect to four main regions—North America, Europe, Asia Pacific and the Rest of the World (RoW)2
- To strategically profile key players and comprehensively analyze their product portfolios, market shares, and core competencies3
- To track and analyze competitive developments such as acquisitions, expansions, new product launches, and partnerships in the ELISpot and FluoroSpot Assays Market.
Available Customizations:
With the given market data, MarketsandMarkets offers customizations as per the company’s specific needs. The following customization options are available for the report:
- Product Analysis: Product matrix, which gives a detailed comparison of the product portfolios of each company
- Geographic Analysis: Further breakdown of the European ELISpot and FluoroSpot Assays Market into specific countries.
Growth opportunities and latent adjacency in ELISpot and FluoroSpot Assay Market