
Endodontics Market Size, Growth, Share & Trends Analysis

Endodontics Market by Procedural Instruments (Scalers, Apex Locators, Motors, Handpieces, Lasers), Access Preparation Equipment & Consumables (Burs, Drills, lubricants, Obturation Filling Materials), End User (Dental Clinics) - Global Forecast to 2030


OVERVIEW
Source: Secondary Research, Interviews with Experts, MarketsandMarkets Analysis
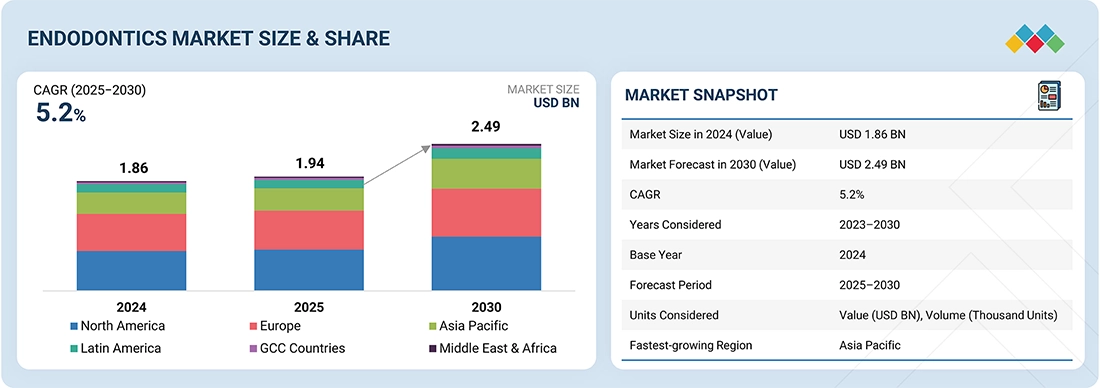
The global endodontics market is projected to reach 2.49 billion in 2030 from USD 1.94 billion in 2025, at a CAGR of 5.2% during the forecast period. New endodontic consumables and instruments achieve higher accuracy, improved antimicrobial action, and better retention of tooth structure than traditional methods. These developments improve canal shaping and effective disinfection, minimize treatment failures, and enhance clinical results. Increased awareness of oral health, combined with the increasing burden of dental caries and lifestyle dental conditions, is driving endodontic treatment demands worldwide.
KEY TAKEAWAYS
-
BY TYPEBased on type, endodontic instruments are categorized as apex locators, apex motors, endodontic scalers, machine-assisted obturation systems, handpieces, and endodontic lasers. The handpieces segment accounted for the largest share of the endodontic instruments market in 2024. This is due to their critical role in nearly every procedure, ranging from access preparation to canal shaping. They are indispensable in both routine and complex cases, ensuring consistent demand.
-
BY ACCESS PREPARATIONThe access preparation segment is divided into burs, drills, and other access preparation consumables. Burs are in demand among dental professionals for their accuracy in accessing the pulp chamber without compromising neighbouring tooth structure. They provide reliable cutting performance and save procedure time. Burs are highly compatible with all types of handpieces, making them a convenient option in clinical procedures.
-
BY END USERThe endodontics market can be divided by end user into three main categories: Dental Clinics, Dental Hospitals, and Academic & Research Institutes. Of these, the largest proportion was dental clinics due to the wide volume of routine endodontic treatments and more patient flow. Clinics are favored for their convenience, individualized treatment, and affordable cost.
-
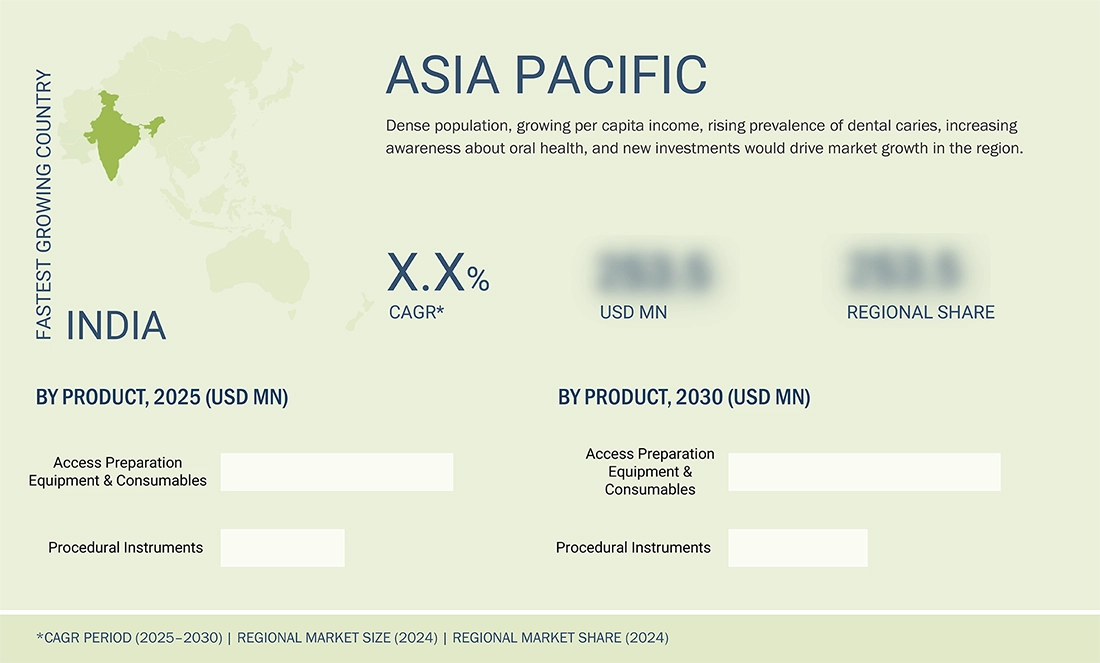
BY REGIONThe endodontics market is segmented by region into North America, Europe, Asia Pacific, Latin America, GCC Countries, and the Middle East & Africa. The Asia Pacific is anticipated to be the fastest-growing market due to the rising prevalence of dental caries and pulp-related diseases, an expanding middle-class population with improved access to dental care, and the rapid development of healthcare infrastructure in countries such as China, India, and South Korea.
-
COMPETITIVE LANDSCAPEThe major market players have adopted both organic and inorganic strategies, including product launches, partnerships, and acquisitions. For example, in June 2025, Septodont Holding (France) entered a commercial partnership with Micro-Mega (France) to distribute their endodontics product range across Europe, the Middle East, Africa, and the UK.
The endodontics market is experiencing consistent growth due to several key factors. The rising global burden of dental diseases, driven by an aging population and the increasing prevalence of caries and pulp-related conditions, is fueling demand for advanced root canal treatments. In addition, the growing adoption of rotary instrumentation and biocompatible filling materials for enhanced treatment outcomes, along with ongoing innovations in imaging, irrigants, and regenerative techniques, is expanding their clinical use.
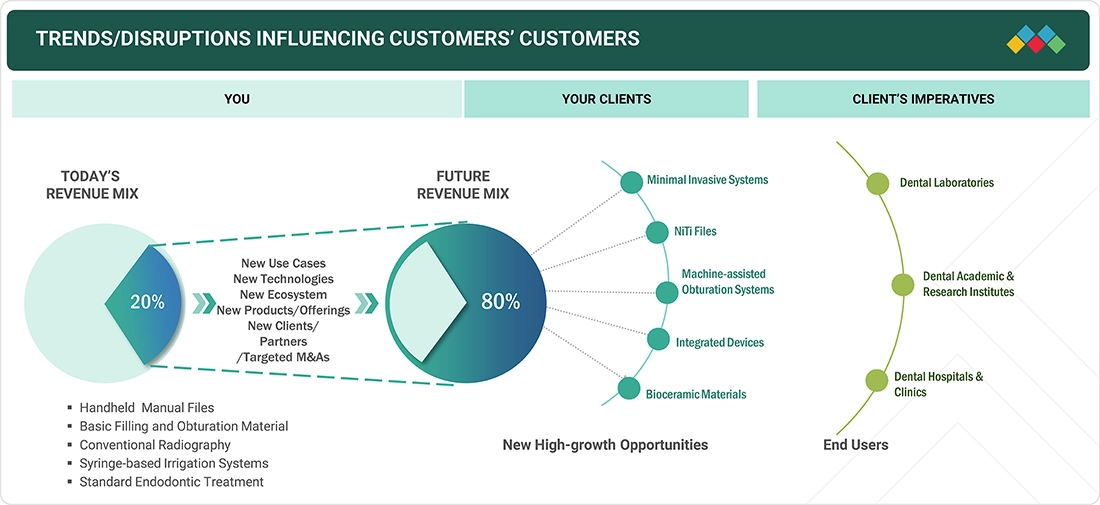
TRENDS & DISRUPTIONS IMPACTING CUSTOMERS' CUSTOMERS
The endodontics market is witnessing a shift from traditional revenue sources such as manual files, conventional radiography, and syringe-based irrigation systems toward advanced, technology-driven solutions. Emerging trends include the adoption of NiTi files, machine-assisted obturation systems, minimally invasive systems, integrated digital devices, and bioceramic materials. These innovations are creating new high-growth opportunities, driven by demand for greater precision, efficiency, and improved patient outcomes. End users such as dental hospitals and clinics, academic institutes, and laboratories are increasingly adopting these disruptive technologies, reshaping the future of endodontic care.
Source: Secondary Research, Interviews with Experts, MarketsandMarkets Analysis
MARKET DYNAMICS
Level
-
Growing incidence of dental caries and pulpal disease

-
Technological advancements in endodontics

Level
-
High cost of advanced endodontic treatments

-
Shift toward tooth extraction over root canal

Level
-
Growth potential in emerging economies

-
Consolidation of dental practices

Level
-
Shortage of skilled workforce

Source: Secondary Research, Interviews with Experts, MarketsandMarkets Analysis
Driver: Growing incidences of dental caries and pulpal disease
High prevalence of oral diseases is one of the key drivers of the global endodontics market. The WHO Global Oral Health Status Report (2022) highlighted that an estimated 3.5 billion individuals suffer from oral diseases, three-quarters of whom live in middle-income countries. The Global Burden of Disease Study (2022) also reported that 2.37 billion individuals have cavities in their permanent teeth and that over 530 million children have decay in their primary teeth. The American Association of Endodontists reports that over 25 million root canal treatments are done annually in the US and that nearly 23 million endodontic treatments occur yearly in Europe. These estimates represent the high demand for endodontic treatments in developed areas. As the global prevalence of dental caries is seen, the demand for early diagnosis and high-end endodontic treatment will likely continue fueling market growth.
Restraint: High cost of advanced endodontic treatments.
The premium price of advanced endodontic treatments continues to be the main limiting factor for market growth. Though technologies such as nickel-titanium (NiTi) rotary file systems, cone-beam computed tomography (CBCT), dental operating microscopes, and ultrasonic irrigation systems have improved treatment accuracy and clinical success, they contribute to overall procedural costs. In countries with poor or no dental insurance coverage, patients may have to pay the full amount out of pocket, as much as USD 300 to more than USD 2,000 for a single root canal, depending on the complexity of the case and location. Even in developed nations, where dental insurance is prevalent, endodontic care is usually partially covered at best, requiring significant out-of-pocket costs from patients. This cost burden is still restricting patient access and retarding the broader adoption of advanced endodontic care, especially in price-sensitive markets.
Opportunity: Consolidation of dental practices
There is a significant opportunity presented by the growing number of dental service organizations (DSOs). Large corporate groupings are quickly being supplanted by individual dental clinics, particularly in the US, UK, Spain, and several Southeast Asian countries. Due to economies of scale, increased purchasing power, and access to private equity funding, DSOs can invest more in state-of-the-art dental technologies, including cone-beam computed tomography (CBCT), nickel-titanium rotary systems, and dental operating microscopes. Another factor propelling market expansion is the increased desire among young dentists to work for DSOs, which streamline operations and increase accessibility to high-quality care. US legal developments that let non-dentists own dental practices have facilitated the adoption of high-end dental endodontic solutions in a more structured and profitable environment, spurring DSO expansion.
Challenge:Shortage of Skilled workforce.
The endodontics market is generally confronted with the immense challenge of insufficiently trained specialists globally. Sophisticated interventions such as rotary instrumentation, microscopic endodontics, and regenerative therapy require high technical skills, which are lacking in many general practitioners. The World Health Organization recommends 3–5 endodontists per 100,000 population as the ideal ratio; however, in practice, availability is mostly less than that. In 2024, the US was estimated to have approximately 6,500 active endodontists among nearly 200,000 dentists, representing only two endodontists per 100,000 population—short of the recommended standard. More importantly, specialists' distribution is highly concentrated in urban areas, so rural and underserved areas receive very limited access to care. The problem is even more urgent in developing countries, where specialist-to-population ratios are low, and general dentists may be the main providers of endodontic treatment despite a lack of advanced qualifications. The worldwide shortage limits patient access to prompt and high-quality treatment and presents a long-term threat to the endodontics market.
Endodontics Market: COMMERCIAL USE CASES ACROSS INDUSTRIES
| COMPANY | USE CASE DESCRIPTION | BENEFITS |
|---|---|---|
 |
NiTi rotary file system with enhanced metallurgy for root canal shaping, featuring progressive taper design and gold heat treatment | Provides superior flexibility and fatigue resistance, reduces risk of file separation, ensures efficient cleaning and shaping of complex canals, and shortens procedure time |
 |
Heat-treated nickel-titanium rotary file systems for shaping and cleaning root canals | Cost-effective solution with high cyclic fatigue resistance, consistent performance across multiple canal anatomies, and improves access for general dentists through wide availability |
 |
Carrier-based obturation device coated with gutta-percha used for three-dimensional root canal filling | Ensures dense and homogeneous canal filling, reduces voids, simplifies obturation workflow, enhances sealing ability, and long-term treatment success |
 |
NiTi rotary file system with asymmetrical cross-section and continuous rotation for shaping canals | Provides efficient debris removal, reduces torsional stress on files, maintains canal anatomy integrity, improves safety and operator control |
 |
Fiber-reinforced composite posts for post-endodontic restorations to reinforce and retain coronal restorations after root canal therapy | Delivers high esthetics (tooth-colored), optimal bond strength with resin cements, preserves tooth structure due to minimal preparation, and reduces risk of root fracture |
Logos and trademarks shown above are the property of their respective owners. Their use here is for informational and illustrative purposes only.
MARKET ECOSYSTEM
The endodontics market operates within a dynamic ecosystem shaped by technological innovation, evolving clinical needs, and regulatory frameworks. Established players and emerging manufacturers are continuously introducing advanced instruments and consumables, intensifying competition and creating pricing pressures across product categories. At the same time, rising costs of raw materials, stringent sterilization requirements, and the need for biocompatible materials challenge companies to maintain a balance between affordability and profitability. Consolidation among dental service organizations (DSOs), group purchasing organizations (GPOs), and large distributors is further shifting buyer power, enabling bulk procurement and placing pressure on smaller manufacturers. In addition, evolving health regulations, quality certifications, and device approval standards across regions are influencing product development and market entry strategies, prompting companies to reevaluate pricing, positioning, and long-term investment priorities.
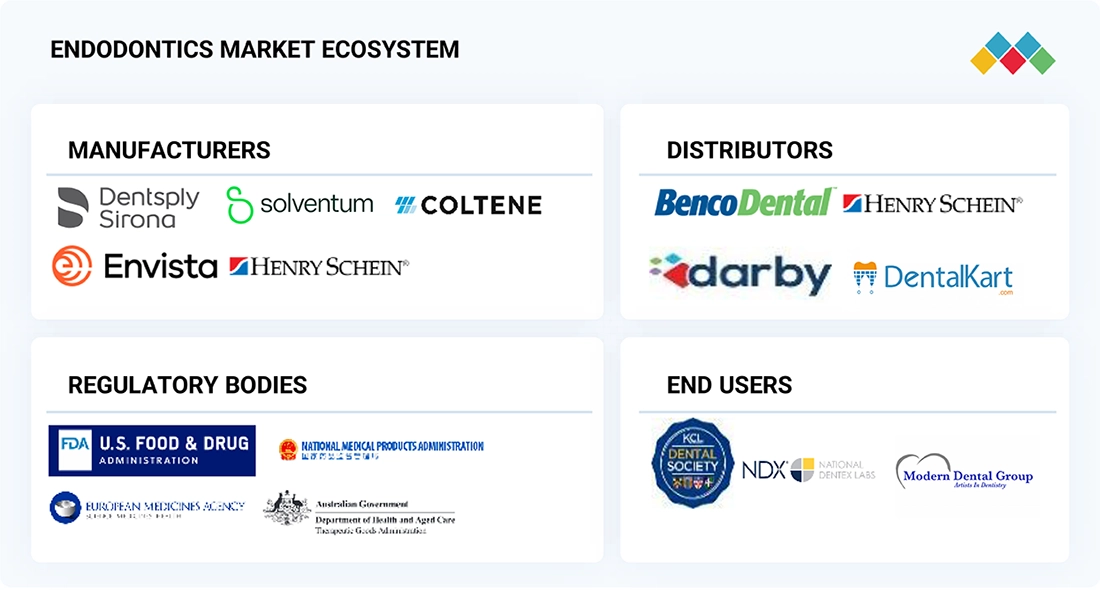
Logos and trademarks shown above are the property of their respective owners. Their use here is for informational and illustrative purposes only.
MARKET SEGMENTS
Source: Secondary Research, Interviews with Experts, MarketsandMarkets Analysis
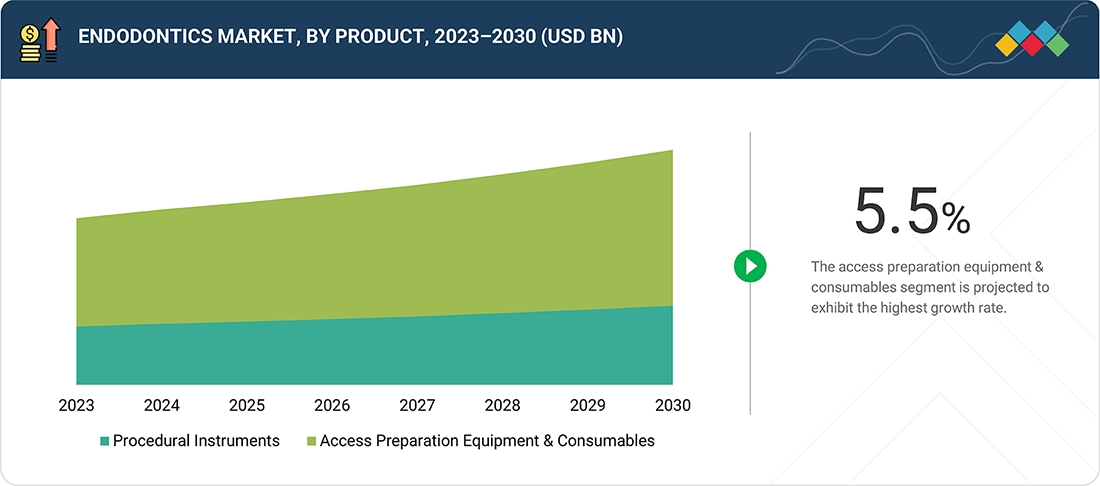
Endodontics Market, By Product Type
The consumables segment is expected to have the highest CAGR due to increased usage of single-use products and increased awareness of infection control among dental professionals. Frequent replacement, cost-effectiveness, and simplicity are some of the main reasons driving demand for consumables. Files, sealers, obturation materials, and irrigants are seeing robust adoption in both clinics and hospitals. Ongoing advances in material strength and design are also improving procedural safety and treatment success even more. The transition to minimally invasive procedures and patient preference for faster recovery are aiding the increased use of advanced consumables. Worldwide expansion in dental tourism as well as the growing incidence of dental caries, are also accelerating procedural volume, especially in emerging markets. In addition, companies are launching eco-compatible and biocompatible products, following trends in sustainability and patient safety.
Endodontics Market, By Endodontic Consumables
The cleaning and shaping segment comprised the largest percentage of the consumables market in 2024. This is because these products are essential in removing infected tissue, opening up the canal, and shaping the root canal system to enable effective obturation. Increased use of advanced files, irrigants, and associated consumables has also fueled growth in this segment. In addition, continuous developments in file constructions, such as rotary and reciprocating systems, have greatly improved procedural efficiency, accuracy, and outcomes of treatment.
Endodontics Market, By End User
The dental clinics segment is expected to dominate due to its wide volume of routine endodontic treatments and more patient flow. Clinics are favored for their convenience, individualized treatment, and affordable cost. Growing awareness of oral health and the need for minimally invasive treatments keep driving patients towards clinic-based treatment. Dentists operating from clinics also embrace newer endodontic instruments and consumables to provide precision, efficiency, and better patient outcomes. The increasing number of freestanding specialty practices and chain-based dental service organizations (DSOs) is increasing the number of endodontic services available in clinics. Clinics have the capacity to deliver quicker treatment turnarounds and flexible scheduling.
REGION
Asia Pacific to be fastest-growing region in global endodontics market during forecast period
The endodontics market in the Asia Pacific is anticipated to expand at the highest CAGR. The growing prevalence of dental infections and increased awareness of non-invasive drug delivery methods have led to an increase in the use of endodontic products. The region's large and ageing population is a significant contributor to the increasing expenditure on healthcare, which is raising demand for easily accessible and patient-friendly treatment options. Improvements in healthcare infrastructure, increased disposable incomes, and advances in pharmaceutical research & development are also anticipated to drive growth in the Asia Pacific endodontics market.
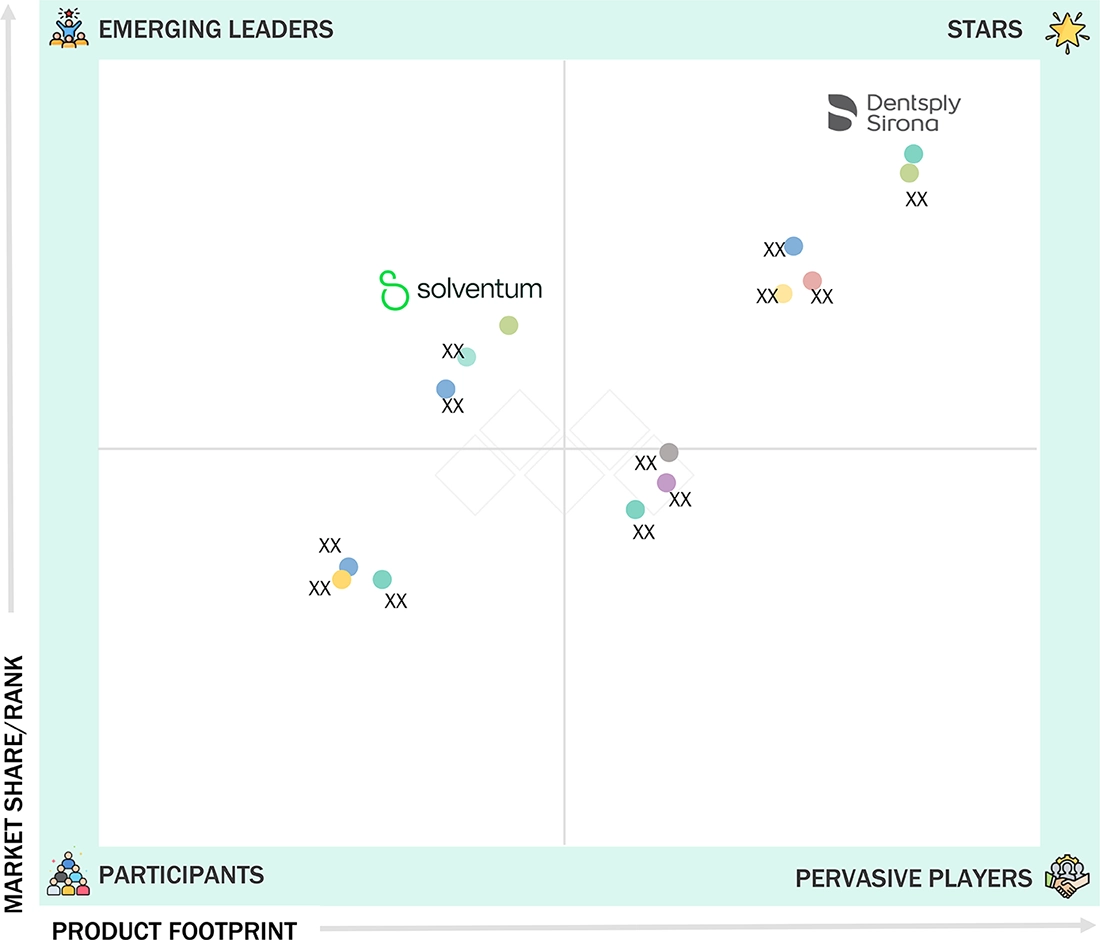
Endodontics Market: COMPANY EVALUATION MATRIX
In the endodontics market matrix, Dentsply Sirona (Star) leads with a strong market share and an extensive product portfolio, supported by its global presence, robust distribution network, and continuous innovations in endodontic instruments and consumables. Solventum (Emerging Leader) is gaining visibility through its expanding product offerings and growing emphasis on advanced endodontic solutions, positioning itself as a key innovator in niche segments. While Dentsply Sirona dominates through scale, breadth, and market reach, Solventum demonstrates strong potential to advance toward the leaders’ quadrant as demand for technologically advanced and efficient endodontic solutions continues to accelerate.
Source: Secondary Research, Interviews with Experts, MarketsandMarkets Analysis
KEY MARKET PLAYERS
MARKET SCOPE
| REPORT METRIC | DETAILS |
|---|---|
| Market Size Value in 2024 (Value) | USD 1.86 BN |
| Revenue Forecast in 2030 (Value) | USD 2.49 BN |
| Growth Rate | CAGR of 5.2% from 2025–2030 |
| Years Considered | 2023–2030 |
| Base Year | 2024 |
| Forecast Period | 2025-2030 |
| Units Considered | Value (USD BN), Volume (Thousands Units) |
| Report Coverage | Revenue Forecast, Company Ranking, Competitive Landscape, Growth Factors, and Trends |
| Segments Covered | BY PRODUCT: PROCEDURAL INSTRUMENTS, and ACCESS PREPEARATION EQUIPMENT & CONSUMABLES I BY END USER: DENTAL CLINICS, DENTAL HOSPITALS, and DENTAL ACADEMIC & RESEARCH INSTITUTIONS |
| Regions Covered | North America, Europe, Asia Pacific, Latin America, GCC Countries, and the Middle East & Africa |
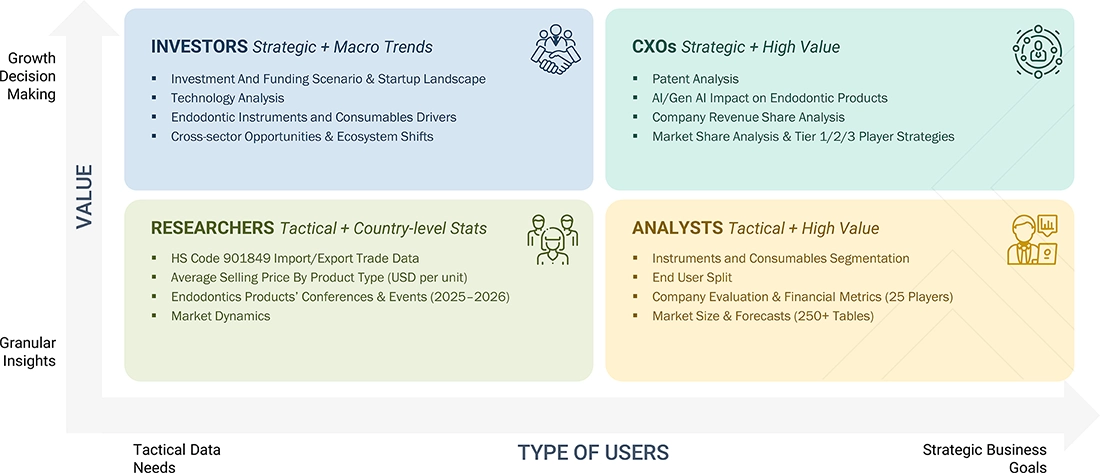
WHAT IS IN IT FOR YOU: Endodontics Market REPORT CONTENT GUIDE
DELIVERED CUSTOMIZATIONS
We have successfully delivered the following deep-dive customizations:
| CLIENT REQUEST | CUSTOMIZATION DELIVERED | VALUE ADDS |
|---|---|---|
| Product Analysis | Comparison of procedural instruments: apex locators, endodontic motors, endodontic scalers, machine assisted obturation systems, handpieces, & endodontic lasers | Identify interconnections and potential supply chain blind spots within the dental ecosystem |
| Company Information | Key players: Dentsply Sirona (US), Envista (US), COLTENE Group (Switzerland), Henry Schein, Inc. (US), Solventum (US). Top 3-5 players market share analysis at Asia Pacific and European country-level | Insights on revenue shifts towards emerging innovations |
| Geographic Analysis | Detailed analysis on Rest of Asia Pacific for one of the top players | Country-level demand mapping for new product launches and localization strategy planning |
RECENT DEVELOPMENTS
- July 2025 : Dentsply Sirona (US) launched the VDW.ROTATE file system for rotary root canal preparation in India.
- June 2025 : Septodont Holding (France) entered a commercial partnership with Micro-Mega (France) to distribute their endodontic product range across Europe, the Middle East, Africa, and the UK.
- October 2024 : Henry Schein, Inc. (US) partnered with its subsidiary Optident (UK) to introduce FKG Dentaire’s (Switzerland) endodontic product portfolio in the UK.
- October 2024 : Through its Kerr brand, Envista (US) introduced a heat-treated nickel-titanium rotary file (ZenFlex CM) engineered for enhanced flexibility and durability during root canal shaping.
Table of Contents
 Exclusive indicates content/data unique to MarketsandMarkets and not available with any competitors.
Methodology
The study comprised four key activities aimed at estimating the current size of the endodontics market. First, extensive secondary research was conducted to gather information on the market, including related and parent markets. The next step involved validating these findings, assumptions, and market size estimates through primary research with industry experts across the value chain. Top-down and bottom-up approaches were used to arrive at a comprehensive estimate of the overall market size. Finally, market breakdown and data triangulation techniques were utilized to determine the sizes of segments and subsegments within the market.
Secondary Research
The secondary research process involved extensive use of various secondary sources, including directories, databases like Bloomberg Business, Factiva, and D&B Hoovers, as well as white papers, annual reports, company house documents, investor presentations, and SEC filings. This research was conducted to gather information valuable for a comprehensive, technical, market-oriented, and commercial study of the endodontics market. It also helped obtain critical insights about key players in the industry, market classification, and segmentation based on current industry trends, down to the finest details. Additionally, a database of leading industry players was created through this secondary research.
Primary Research
In the primary research process, we conducted interviews with various sources from both the supply and demand sides to gather qualitative and quantitative information for this report. On the supply side, we interviewed industry experts, including CEOs, vice presidents, marketing & sales directors, technology & innovation directors, and other key executives from prominent companies and organizations involved in the endodontics market. For the demand side, we engaged with industry experts, purchase and sales managers, doctors, and personnel from research organizations. This primary research was essential to validate market segmentation, identify key players in the industry, and gather insights on important industry trends and market dynamics.
A breakdown of the primary respondents for the endodontics market is provided below:

Note 1: C-level executives include CEOs, COOs, CTOs, and VPs.
Note 2: Others include sales, marketing, and product managers.
Note 3: Companies are classified into tiers based on their total revenue. As of 2024: Tier 1=>USD 1 billion, Tier 2 = USD 500 million to USD 1 billion, and Tier 3 = < USD 500 million.
To know about the assumptions considered for the study, download the pdf brochure
Market Size Estimation
The research methodology used to estimate the size of the endodontics market includes the following details. The market sizing was undertaken from the global side.
Country-level Analysis: The size of the endodontics market was obtained from the annual presentations of leading players and secondary data available in the public domain. The share of products in the overall endodontics market was obtained from secondary data and validated by primary participants to arrive at the total endodontics market. Primary participants further validated the numbers.
Geographic Market Assessment (By Region and Country): The geographic assessment was done using the following approaches:
Approach 1: Geographic revenue contributions/splits of leading players in the market (wherever available) and respective growth trends
Approach 2: Geographic adoption trends for individual product segments by end users and growth prospects for each of the segments (assumptions and indicative estimates validated from primary interviews)
At each point, the assumptions and approaches were validated by industry experts who were contacted during primary research. Considering the limitations of data available from secondary research, revenue estimates for individual companies (for the overall endodontics market and geographic market assessment) were ascertained based on a detailed analysis of their respective product offerings, geographic reach/strength (direct or through distributors or suppliers), and the shares of the leading players in a particular region or country.
Global Endodontics Market Size: Bottom-up Approach and Top-down Approach

Data Triangulation
After arriving at the overall size from the market size estimation process explained above, the total market was split into several segments and subsegments. The data triangulation and market breakdown procedures explained below were implemented, wherever applicable, to complete the overall market engineering process and arrive at the exact statistics for various market segments and subsegments. The data was triangulated by studying various factors and trends from the demand and supply sides. Along with this, the market size was validated using both the top-down and bottom-up approaches.
Market Definition
The endodontics encompasses the economic ecosystem involving products and technologies related to the diagnosis, prevention, and treatment of conditions affecting the dental pulp and surrounding root tissues. This includes everything from instruments (rotary files, apex locators, endodontic motors, lasers) to consumables (such as endodontic files, gutta-percha points, sealers, burs, irrigation solutions) used in root canal therapy, retreatments, and other endodontic procedures. It also includes professional services provided by endodontists and qualified general dentists performing these procedures.
Stakeholders
- Endodontic Products’ Manufacturers
- Suppliers and Distributors of Endodontic Products
- Senior Management
- Finance Department
- Dental Research Institutes
- Dental Laboratories
- Healthcare Services Providers (Hospitals and Public & Private Clinics)
- Academic & Research Institutes
- Trade Associations and Industry Bodies
- Regulatory Bodies and Government Agencies
- Business Research and Consulting Service Providers
- Market Research and Consulting Firms
- Venture Capitalists and Investors
Report Objectives
- To define, describe, segment, analyze, and forecast the global endodontics market by product, end user, and region
- To provide detailed information about the factors influencing market growth (drivers, restraints, opportunities, and challenges)
- To analyze micromarkets concerning individual growth trends, prospects, and contributions to the overall market
- To analyze market opportunities for stakeholders and provide details of the competitive landscape for key players
- To forecast the size of the endodontics market in North America, Europe, the Asia Pacific, Latin America, the Middle East & Africa, and GCC countries.
- To profile the key players in the endodontics market and comprehensively analyze their core competencies
- To track and analyze competitive developments such as agreements, collaborations, and partnerships; acquisitions; and product launches in the endodontics market.
Need a Tailored Report?
Customize this report to your needs
Get 10% FREE Customization
Customize This ReportPersonalize This Research
- Triangulate with your Own Data
- Get Data as per your Format and Definition
- Gain a Deeper Dive on a Specific Application, Geography, Customer or Competitor
- Any level of Personalization
Let Us Help You
- What are the Known and Unknown Adjacencies Impacting the Endodontics Market
- What will your New Revenue Sources be?
- Who will be your Top Customer; what will make them switch?
- Defend your Market Share or Win Competitors
- Get a Scorecard for Target Partners

Custom Market Research Services
We Will Customise The Research For You, In Case The Report Listed Above Does Not Meet With Your Requirements
Get 10% Free CustomisationTESTIMONIALS

JAYANT RAJPUROHIT
Director of Market Insights, Data and Analytics
SFI Health,
Leading Pharmaceutical Companywww.sfihealth.com/

We at SFI Health approached MarketsandMarkets for an Opportunity Assessment on "Incidence and Prevalence of Focus Indications" as we wanted to know the most attractive HCPs like Physician, Functional MD, Naturopath and Pharmacist. The project was critical for us to ensure our focus on the right target which would enable sustainable growth and profitability for SFI Health. The business insights provided exceeded our expectations and we were extremely impressed. The team at MarketsandMarkets is highly professional and detail oriented and very well understood our business needs. MarketsandMarkets offers a unique combination of expertise and dedicated engagement model. We identified 2 new products to be launched in coming months, based on the research findings provided by MarketsandMarkets. We are happy with the services and would strongly recommend MarketsandMarkets to my peers in the industry.

BEATRIZ DE LA CALLE
Head of Commercial Analytics
Qualicaps,
Leading Pharmaceutical Companywww.qualicaps.com/

We partnered with MarketsandMarkets for an assessment study on hard empty capsules. The team was extremely professional in understanding our business requirements and we received timely responses to all our queries. The market intelligence and the recommendations has met our business requirements. We were extremely impressed to see the final study results; it really exceeded our expectations. The market intelligence offered by MarketsandMarkets, and clarity on next steps will help us achieve our business objective for the Year 2021. We are happy with the services and would strongly recommend MarketsandMarkets to my peers in the industry.

Bob Williams,
Senior Director Business Development & Innovation
Bracco Diagnostics Inc.,
Italian Multinational in life sciences sector and a World Leader in imaging diagnosticsimaging.bracco.com/us-en
We were pleased with targeted insights that MarketsandMarkets identified from a custom study on the 'Radiation Dose Management Solutions Market'. Your team identified and characterized the market participants as well as underlying trends accurately. This study was useful to Bracco in formulating business strategies for our dose monitoring product lines and we thank MarketsandMarkets for the job well done.
Cody Coonradt,
Market Development and Strategy Manager
3M Health Information Systems,
Leader in Health care Coding, Payment & Analytics Solutions.www.3m.com/3M/en_US/health-information-systems-us
The value for our organization comes from three things: depth of research, specificity of segments and being easy to work with. As important as the first two are, the third can't be underestimated. MarketsandMarkets, maybe more than any other research vendor, wants to know what is top of mind for our team and what big questions we are grappling to answer.
Their customer first approach and high value engagement model, have given us great analysis and excellent value for money


Growth opportunities and latent adjacency in Endodontics Market