
Flexible Packaging Market

Flexible Packaging Market by Material (Plastic, Paper, Metal), Packaging Type, Printing Technology (Flexography, Rotogravure, Digital), Application (Food, Beverage, Pharmaceutical & Healthcare, Personal Care & Cosmetics), Region - Global Forecast to 2030


FLEXIBLE PACKAGING MARKET OVERVIEW
Source: Secondary Research, Interviews with Experts, MarketsandMarkets Analysis
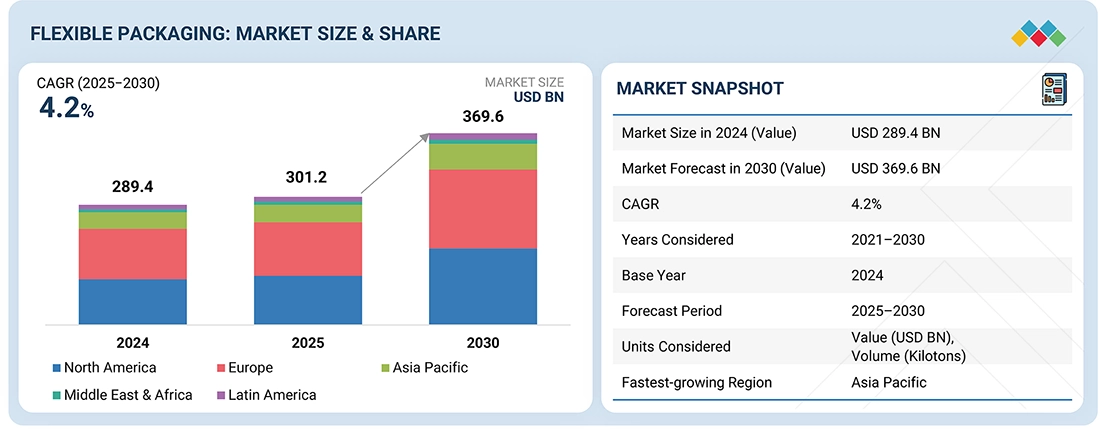
The global flexible packaging market was valued at USD 301.2 billion in 2025 and is projected to reach USD 369.6 billion by 2030, growing at 4.2% cagr from 2025 to 2030. Growth is driven mainly by increasing demand from end-use segments such as food and beverages, pharmaceuticals, and personal care. Consumers’ growing preference for convenience, on-the-go consumption, and longer product shelf life is boosting demand for pouches, films, and sachets. Additionally, the development of innovative, lightweight, sustainable, and high-barrier materials is encouraging adoption by manufacturers seeking cost-effective and environmentally compliant solutions. Urbanization, e-commerce, and food delivery further contribute to the global increase in flexible packaging usage.
KEY TAKEAWAYS
-
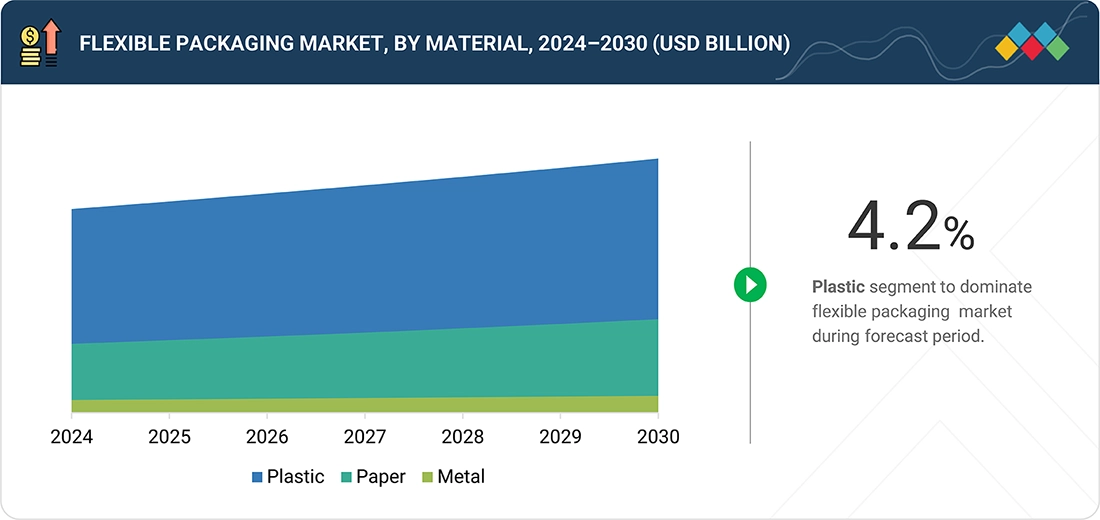
BY MATERIALThe flexible packaging market by material includes plastic, paper, and metal. Plastic is the largest segment, and paper is the fastest-growing segment in the market.
-
BY PACKAGING TYPEThe flexible packaging market, categorized by packaging type, includes pouches, bags, rollstock, films & wraps, and other packaging types. Pouches are the largest and fastest-growing segment in the market.
-
BY PRINTING TECHNOLOGYThe flexible packaging market based on printing technology includes flexography, rotogravure, digital printing, and other printing technologies. Flexography is the largest segment, and digital printing is the fastest-growing segment in the market.
-
BY APPLICATIONThe flexible packaging market based on application includes food, beverages, pharmaceutical & healthcare, personal care & cosmetics, other applications. Food is the largest segment, and personal care & cosmetics is the fastest-growing segment in the market.
-
BY REGIONThe flexible packaging market, based on region, includes North America, Asia Pacific, Europe, the Middle East & Africa, and South America. Pouches is the largest and fastest-growing segment in the market and is also the largest and fastest-growing region in the market.
-
COMPETITIVE LANDSCAPEThe market is driven by strategic acquisitions and product launches from leading players such as Amcor plc (Switzerland), Smurfit Westrock (Ireland), Mondi (UK), TOPPAN Holdings Inc. (Japan), Sealed Air (US)
Flexible packaging is an adaptable, lightweight type of packaging that consists of films, foils, plastics, and paper designed to conform to the shape of the product. It provides barrier protection and strength while occupying less space and using less material than rigid formats. This makes it better for storage, shipping, and merchandising. It is also increasingly popular in food, beverage, pharmaceutical, and personal care packaging because it enhances convenience, extends shelf life, promotes sustainability, and supports advanced printing, sealing, and functional features.
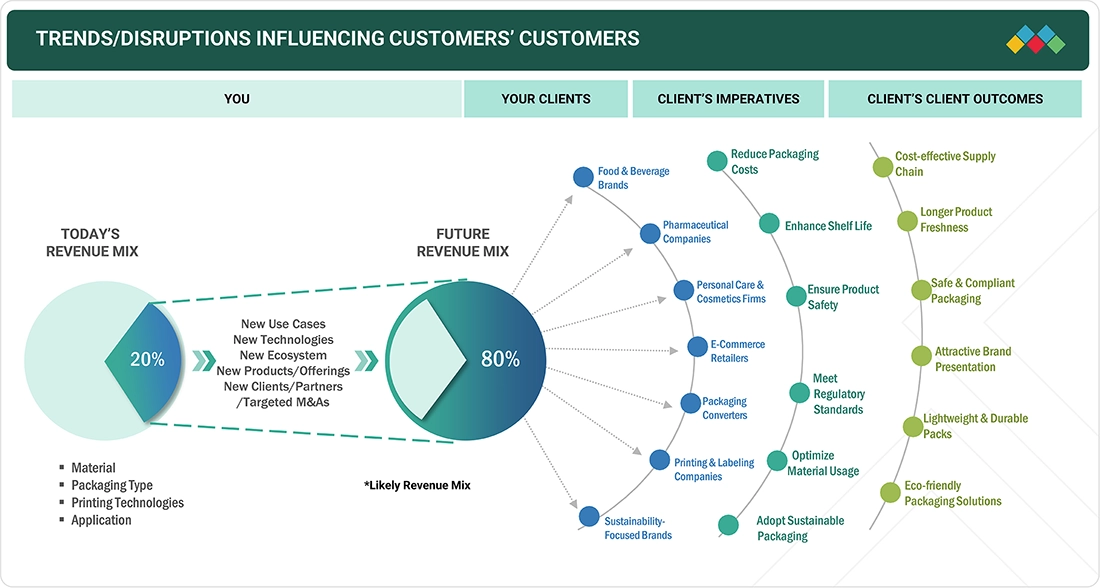
TRENDS & DISRUPTIONS IMPACTING CUSTOMERS' CUSTOMERS
Changes in customer trends or disruptions affect consumers’ businesses. These shifts influence the revenue of end users. As a result, the revenue impact on end users is likely to affect the revenue of flexible packaging suppliers, which, in turn, influences the revenue of flexible packaging manufacturers. Clients' imperatives represent the direct end-users of flexible packaging, and clients’ client outcomes are the benefits provided to them through the use of flexible packaging.
Source: Secondary Research, Interviews with Experts, MarketsandMarkets Analysis
FLEXIBLE PACKAGING MARKET DYNAMICS
Level
-
Growth of E-commerce platform

-
Rising demand for disposable packaging from end-use industries

Level
-
•Non-availability of efficient recycling infrastructure

-
Surge in raw material price

Level
-
Commercialization of mono-material high-barrier films

-
Expansion of refill, reuse, and concentrate-compatible formats

Level
-
•High dependence on petrochemical-based resins

-
Rapidly evolving sustainability standards and certification requirements

Source: Secondary Research, Interviews with Experts, MarketsandMarkets Analysis
Driver: Growth of E-commerce platform
One of the primary factors contributing to the expansion of the flexible packaging market is the remarkable growth of e-commerce platforms driven by the ongoing COVID-19 pandemic, which has resulted in increased demand for online retail. Unlike traditional retail channels, e-commerce channels necessitate packaging solutions that are lightweight, durable, and space-efficient. Flexible packaging formats such as pouches, films, and sachets facilitate reductions in weight and shipping costs while ensuring protection against product damage during transit. The surge in online sales of groceries, food delivery, and personal care products has heightened the demand for flexible packaging solutions that guarantee product integrity, longevity, and consumer convenience. Current trends in e-commerce emphasize the development of innovative packaging designs that are aesthetically appealing and easy for consumers to handle, thereby differentiating the product and brand from competitors. This transition has compelled manufacturers to adopt flexible, sustainable, and cost-effective packaging solutions to meet the escalating demands of digital retail markets for all consumer goods.
Restraint: Non-availability of efficient recycling infrastructure
The absence of an adequate recycling framework significantly constrains the flexible packaging market. Flexible packaging predominantly consists of multilayer films, pouches, and sachets, which are less conducive to recycling compared to rigid materials due to their composite nature involving foils, plastics, and paper. The scarcity of recycling facilities and technological capabilities remains a critical gap, hindering the effective processing of these products. Consequently, this situation presents escalating environmental concerns and regulatory pressures. Consumers are increasingly demanding more sustainable packaging solutions; however, the inability to recycle flexible packaging hampers its acceptance across various markets, thereby impeding ongoing growth. Manufacturers are consequently compelled to invest in alternative materials, design-for-recyclability, or take-back schemes. Nonetheless, progress remains sluggish, thus restricting the broader expansion of the flexible packaging industry worldwide.
Opportunity: Commercialization of mono-material high-barrier films
The advent of mono-material high-barrier films presents a substantial opportunity within the flexible packaging industry. These films are more readily recyclable than conventional multi-layer composites and continue to deliver superior barriers against moisture, oxygen, and light, thereby extending product shelf life. This development aligns with escalating regulatory requirements and consumer expectations concerning sustainability. Leading manufacturers are currently investing in mono-material technologies to produce flexible pouches, films, and wraps that combine recyclability with high-performance characteristics, ultimately reducing environmental impact. Additionally, mono-material high-barrier films are expected to promote cost efficiencies and streamline supply chains through simplified material handling. As sustainability increasingly influences purchasing decisions, these films offer a strategic advantage across sectors such as food, beverages, personal care, and pharmaceuticals on a global scale.
Challenge: High dependence on petrochemical-based resins
The flexible packaging industry faces a major challenge because it depends heavily on petrochemical resins. Most flexible packaging materials, like polyethylene, polypropylene, and polyester films, mainly consist of resins made from fossil fuels, which makes them vulnerable to volatile prices and potential supply disruptions. Additionally, this dependence creates environmental concerns, especially regarding carbon emissions and plastic pollution linked to petrochemical-based materials. Increasingly, consumers expect sustainable alternatives, and regulators are paying more attention to rules, pushing manufacturers to consider bio-based or recyclable options. However, marketing sustainable choices often involves higher costs and technological challenges that hinder widespread use and scaling. Therefore, reliance on petrochemical resins brings economic and environmental pressures that limit the long-term growth and sustainability of the flexible packaging sector worldwide.
Flexible Packaging Market: COMMERCIAL USE CASES ACROSS INDUSTRIES
| COMPANY | USE CASE DESCRIPTION | BENEFITS |
|---|---|---|
 |
AI tools to assist packaging design: rapid generation of design options, trend/material suggestions, consumer insights, balancing sustainability + aesthetics | Enables faster design iterations, improves aesthetic appeal, balances sustainability with functionality |
 |
AI-powered waste analytics via collaboration with startup Greyparrot; computer vision to detect/classify waste in recycling/resource recovery facilities; helps in upstream packaging design/sustainability decision-making | Enhances recycling efficiency, supports sustainable packaging decisions, reduces material waste and environmental impact |
 |
AI in packaging automation and right-sizing systems (eCommerce fulfillment, automated cartoning, reducing voids, optimizing corrugated or flexible pack usage) to use less material and improve throughput | Reduces material usage, lowers shipping costs, improves throughput, and optimizes packaging for eCommerce fulfillment |
Logos and trademarks shown above are the property of their respective owners. Their use here is for informational and illustrative purposes only.
FLEXIBLE PACKAGING MARKET ECOSYSTEM
The analysis of the flexible packaging ecosystem entails identifying and examining the interconnected relationships among various stakeholders, including raw material suppliers, manufacturers, distributors, and end users. The process encompasses activities such as raw material management, coordination with manufacturers, optimization of communication channels and technologies, and the final delivery of the finished product. Distributors and suppliers facilitate contact between manufacturing companies and end users to streamline the supply chain, thereby enhancing operational efficiency and profitability.
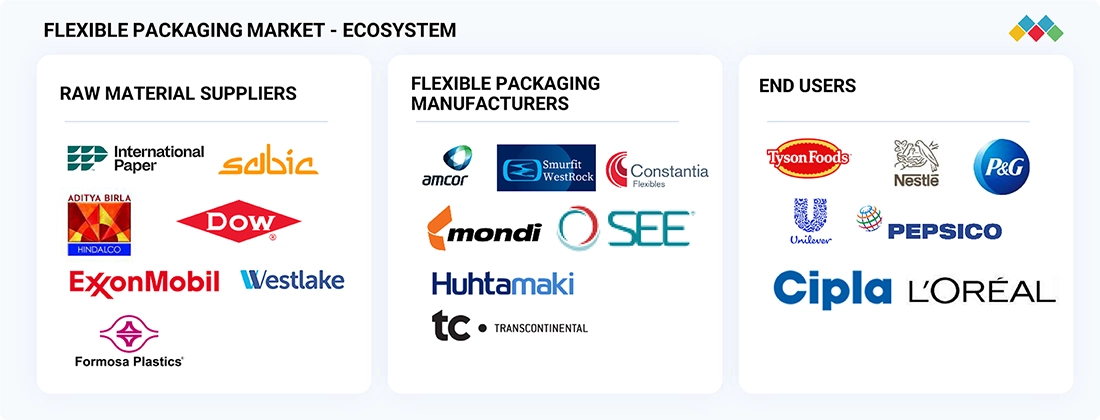
Logos and trademarks shown above are the property of their respective owners. Their use here is for informational and illustrative purposes only.
FLEXIBLE PACKAGING MARKET SEGMENTS
Source: Secondary Research, Interviews with Experts, MarketsandMarkets Analysis
Flexible Packaging Market, By Material
Plastic is the main material used in the flexible packaging market because of its flexibility, affordability, and versatility across different industries. Common materials like polyethylene (PE), polypropylene (PP), and biaxially oriented polypropylene (BOPP) are used in films, pouches, sachets, and wraps. The food and beverage industries use plastic to extend shelf life and enhance convenience, while the pharmaceuticals and personal care sectors rely on plastic for barriers, conditions, and protection. Additionally, plastic is lightweight, which helps reduce transportation costs. With recent advancements in recyclable and multilayer films, plastic continues to maintain its global dominance.
Flexible Packaging Market, By Packaging Type
Pouches dominate the flexible packaging market owing to their convenience, versatility, and efficiency. They are extensively utilized across the food, beverage, pharmaceutical, and personal care sectors for applications such as snacks, ready-to-eat meal combinations, liquid detergents, and health supplements. Pouches possess advantageous attributes including lightweight design, extended shelf life, ease of portability, and customizable sizing, which align with the evolving needs of contemporary consumers. Innovative adaptations, such as resealable and stand-up pouches, further augment demand for pouches as a flexible packaging solution. In summary, pouches are anticipated to remain the preferred flexible packaging option for manufacturers seeking cost-effective, sustainable, and consumer-oriented solutions.
Flexible Packaging Market, By Printing Technology
Due to its rapid production capabilities, ability to print on various substrates (film, foil, paper), and efficient operation, flexography currently dominates the flexible packaging market share. Besides being the main printing method used in flexible packaging, flexography is widely chosen for producing printed materials for food and beverage packaging, pharmaceutical packaging, and personal care packaging because of its ability to create vibrant, high-quality prints. It is efficient for large-volume runs at a lower cost compared to other printing methods, and the process benefits from court plate changes and eco-friendly inks, enabling conservation to meet modern flexible packaging demands while also supporting aesthetic and practical considerations.
Flexible Packaging Market, By Application
The largest application segment in the flexible packaging market is the food sector, driven by a continuing demand for convenience, shelf life, and safety of processed food. Flexible packaging formats such as pouches, films, and sachets are increasingly used for snacks, baked goods, frozen foods, and ready-to-eat meals. New packaging formats like resealable flexible packaging and portion-controlled packaging reflect changing consumer lifestyles. The lightweight, durable, and barrier properties of flexible packaging contribute to reducing food waste and transportation costs, furthering its growth as the leading market in the global food industry.
REGION
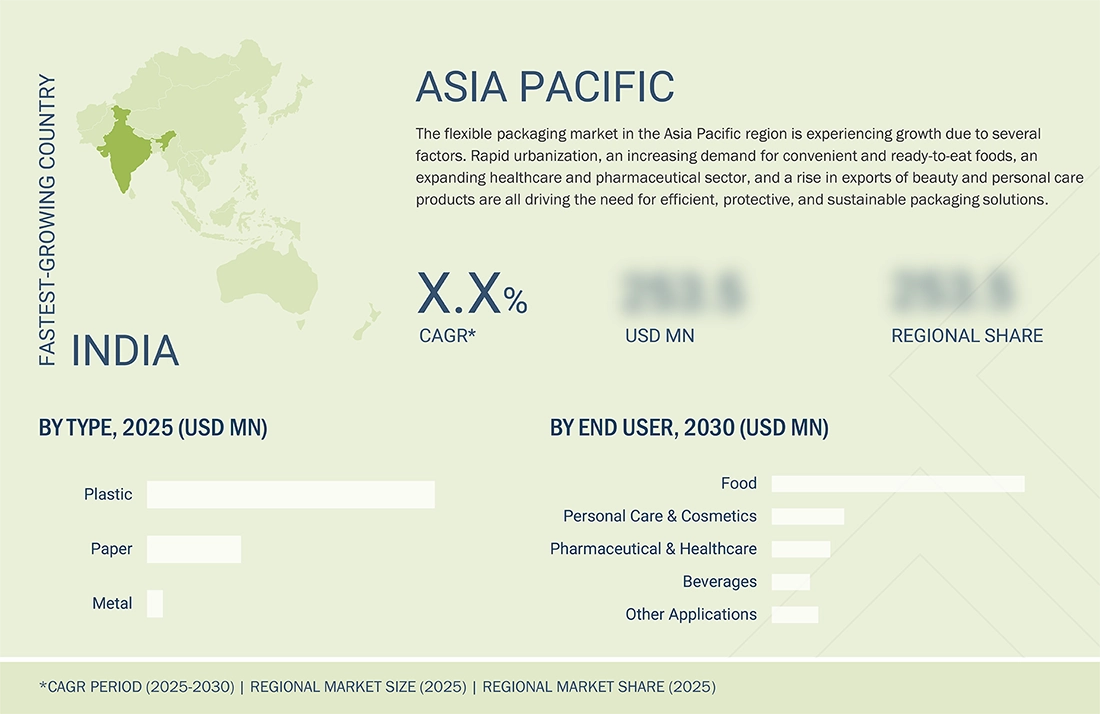
Asia Pacific to be fastest-growing region in global flexible packaging market during forecast period
The Asia Pacific region is anticipated to emerge as the fastest-growing market for flexible packaging throughout the forecast period. This growth is primarily driven by rapid urbanization, increasing disposable incomes, and evolving consumer lifestyles. Countries such as China, India, and Southeast Asian nations possess burgeoning food and beverage, pharmaceutical, and personal care industries, which serve as key end-use sectors for flexible packaging. The rising demand for convenience foods, e-commerce packaging, and sustainable packaging solutions is propelling market adoption. Furthermore, the expansion of modern retail chains, the proliferation of online food delivery services, and heightened awareness concerning hygiene and product safety further bolster the market. Investments aimed at advancing manufacturing technology and increasing local production capacities are expected to enhance the region's global competitiveness, thereby consolidating Asia-Pacific's position as a prominent growth hub.
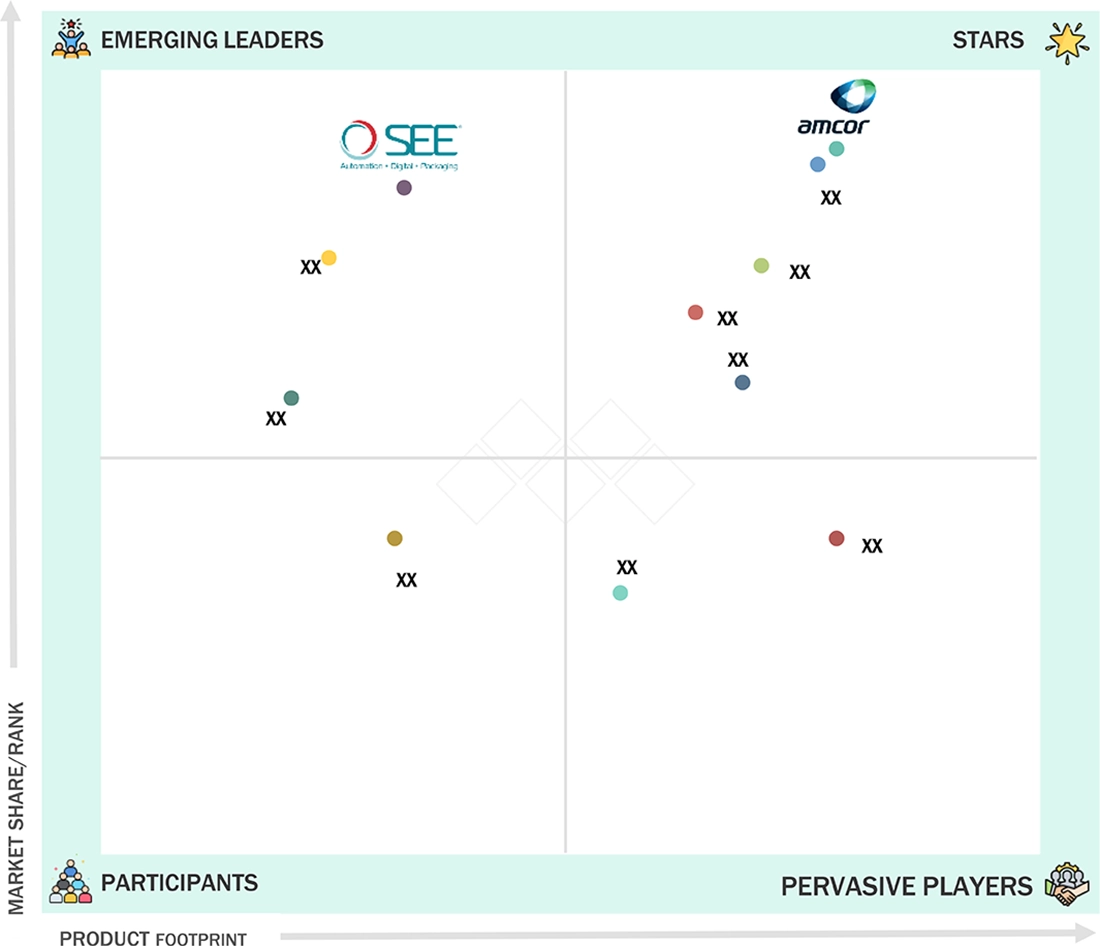
Flexible Packaging Market: COMPANY EVALUATION MATRIX
The flexible packaging market matrix positions Amcor (Star) as a dominant player, leveraging extensive production capacities, a broad portfolio of flexible packaging solutions including films, pouches, wraps, and bags, and a strong global distribution network. This allows the company to effectively serve major end-use industries such as food and beverages, pharmaceuticals, and personal care. Sealed Air (Emerging Leader) is gaining momentum with innovative packaging solutions, a focus on sustainable and high-performance products, and strategic collaborations to improve technological capabilities and supply reliability. While Amcor maintains its leadership through established manufacturing infrastructure, wide geographical reach, and comprehensive product offerings, Sealed Air shows significant growth potential and operational differentiation, positioning it to move toward the leaders’ quadrant. Other competitors in the pervasive and participant segments mainly focus on niche solutions, such as specialized packaging formats or regional supply, which could influence competitive dynamics and market share distribution in the coming years.
Source: Secondary Research, Interviews with Experts, MarketsandMarkets Analysis
FLEXIBLE PACKAGING MARKET PLAYERS
FLEXIBLE PACKAGING MARKET SCOPE
| REPORT METRIC | DETAILS |
|---|---|
| Market Size in 2024 (Value) | USD 289.4 BN |
| Market Forecast in 2030 (value) | USD 369.6 BN |
| Growth Rate | CAGR of 4.2% from 2025-2030 |
| Years Considered | 2021-2030 |
| Base Year | 2024 |
| Forecast Period | 2025-2030 |
| Units Considered | Value (USD Million/Billion), Volume (Kiloton) |
| Report Coverage | Revenue forecast, company ranking, competitive landscape, growth factors, and trends |
| Segments Covered |
|
| Regions Covered | North America, Asia Pacific, Europe, South America, Middle East & Africa |
WHAT IS IN IT FOR YOU: Flexible Packaging Market REPORT CONTENT GUIDE

DELIVERED CUSTOMIZATIONS
We have successfully delivered the following deep-dive customizations:
| CLIENT REQUEST | CUSTOMIZATION DELIVERED | VALUE ADDS |
|---|---|---|
| Client wanted to understand the market for flexible packaging in Egypt | Detailed company profiles of flexible packaging manufacturers in Egypt and the competitive landscape | Created a holistic view of potential market by mapping supply and demand to identify revenue pockets by different applications |
RECENT DEVELOPMENTS
- September 2025 : Mondi collaborated with Ekornes, a premier Nordic furniture manufacturer, to replace traditional plastic packaging with Mondi’s paper-based CompressWrap solution for mattresses. This recyclable, fiber-based packaging guarantees durability during compression and facilitates easier unwrapping by consumers, thereby supporting sustainability objectives and circular economy principles.
- July 2025 : Amcor and Mediacor introduced a recycle-ready, mono-material 2-liter refill pouch for Nana cleaning products, compatible with recycling in multiple European countries. The package achieves up to 80% reduction in plastic use and a 64% decrease in carbon footprint compared to traditional PET bottles.
- April 2025 : TOPPAN Holdings Inc. has finalized the purchase of Sonoco Products Company's Thermoformed & Flexibles Packaging (TFP) business, a global leader in high-value sustainable packaging. The acquisition merges Sonoco’s TFP operations, including its extensive sales network, customer base, and solution development capabilities, with TOPPAN Group’s technical expertise and worldwide manufacturing strengths in packaging.
- January 2025 : Smurfit Westrock introduced a 100% paper-based pallet wrap made from recyclable Nertop® Stretch Kraft paper as an eco-friendly alternative to polyethylene stretch wrap. Produced at the Nervión paper mill in Spain, it provides high energy absorption, strong moisture resistance, and helps significantly reduce CO2 emissions in supply chains. The product is part of the Better Planet Packaging portfolio and was first adopted by UK glass maker Encirc, which named Smurfit Westrock its Sustainability Champion for this innovation. The wrap cuts down on single-use plastic and promotes circular economy goals.
- September 2024 : Sealed Air helped Best Buy introduce packaging solutions that increased the use of recycled content for shipping products across North America. Best Buy, the electronics, computer, appliances, and technology retailer, used the packaging to protect products while supporting the circular economy through recycled materials
Table of Contents
 Exclusive indicates content/data unique to MarketsandMarkets and not available with any competitors.
Methodology
The study involved four major activities to estimate the current size of the global flexible packaging market. Extensive secondary research was conducted to gather information on the market, related product markets, and the parent product group market. The next step was to validate these findings, assumptions, and sizes with industry experts across the flexible packaging value chain through primary research. Both top-down and bottom-up approaches were used to estimate the overall market size. Subsequently, market segmentation and data triangulation procedures were employed to determine the sizes of different market segments.
Secondary Research
The market for companies offering flexible packaging is assessed using secondary data from both paid and free sources. This includes analyzing the product portfolios of leading companies in the industry and rating them based on their performance and quality. Various secondary sources such as Business Standard, Bloomberg, World Bank, and Factiva were used to gather information for this study on the flexible packaging market. During the secondary research process, multiple sources were consulted to collect relevant data. These sources included annual reports, press releases, and investor presentations from flexible packaging vendors, as well as forums, reputable publications, and whitepapers. This research provided essential insights into the industry’s value chain, the key players, market classification, and segmentation from both market and technology perspectives.
Primary Research
During the primary research process, various sources from both the supply and demand sides were interviewed to gather qualitative and quantitative information for this report. Supply-side sources included industry experts such as Chief Executive Officers (CEOs), Vice Presidents (VPs), marketing directors, technology and innovation directors, and other key executives from several major companies and organizations in the flexible packaging market. After completing market engineering— which involved calculations for market statistics, market breakdowns, market size estimates, market forecasting, and data triangulation— extensive primary research was conducted to verify and validate the critical figures. Additional primary research was also carried out to identify segmentation types, industry trends, the competitive landscape of flexible packaging from various market players, and key market dynamics, including drivers, restraints, opportunities, challenges, industry trends, and strategies employed by key players. Throughout the market engineering process, top-down and bottom-up approaches, along with several data triangulation techniques, were extensively used to perform market estimation and forecasting for all market segments and subsegments included in this report. Both qualitative and quantitative analyses were thoroughly performed throughout the entire market engineering process to extract key insights and information for the report.
Following is the breakdown of primary respondents:

Notes: Other designations include sales, marketing, and product managers.
Tier 1: >USD 1 Billion; Tier 2: USD 500 million–1 Billion; and Tier 3: < USD 500 million
To know about the assumptions considered for the study, download the pdf brochure
Market Size Estimation
The top-down and bottom-up methods were used to estimate and verify the size of the global flexible packaging market. These methods were also extensively employed to estimate the size of various related market segments. The research approach used to determine the market size included the following.

Data Triangulation
After estimating the overall market size using the specified processes, the market was divided into several segments and subsegments. Data triangulation and market breakup methods were used, where applicable, to complete the overall market analysis and determine precise statistics for each segment and subsegment. The data was triangulated by examining various factors and trends from both the demand and supply sides.
Market Definition
The flexible packaging market encompasses the production, distribution, and use of packaging solutions made from flexible materials such as plastics, paper, aluminum, and laminates that can be easily shaped, folded, or molded without damaging the product. These packaging formats, including pouches, bags, rollstock, films, and wraps, provide lightweight, cost-effective, and space-saving alternatives to rigid packaging, while also offering protection, longer shelf life, and convenience. Flexible packaging serves a variety of end-use industries such as food and beverages, pharmaceuticals, personal care, and industrial products, delivering better barrier properties, portability, and visual appeal. Growing demand is fueled by trends toward sustainability, the growth of e-commerce, and consumer preferences for innovative, resealable, and eco-friendly packaging options.
Stakeholders
- Raw material suppliers
- Flexible packaging manufacturers
- Manufacturing technology providers
- Industry associations
- Traders, distributors, and suppliers
- Non-governmental organizations (NGOs), government and regional agencies, and research organizations
Report Objectives
- To define, describe, and forecast the size of the global flexible packaging market by material, packaging type, printing technology, application, and region in terms of value and volume
- To provide detailed information on the significant drivers, restraints, opportunities, and challenges influencing the market
- To strategically analyze micromarkets concerning individual growth trends, prospects, and their contribution to the market
- To assess the growth opportunities in the market for stakeholders and provide details on the competitive landscape for market leaders
- To forecast the market size of segments for North America, Europe, Asia Pacific, South America, and the Middle East & Africa
- To strategically profile key players and comprehensively analyze their market shares and core competencies
- To analyze competitive developments such as product launches, expansions, and acquisitions in the flexible packaging market
- To provide the impact of AI on the market
Key Questions Addressed by the Report
Which are the major companies in the flexible packaging market?
Major companies in the flexible packaging market are Amcor Plc (Switzerland), Berry Global Inc. (US), Sealed Air Corporation (US), Mondi Group (UK), and Huhtamaki Oyj (Finland), among others.
Which end-use industries in the flexible packaging market are likely to exhibit the highest CAGR during the forecast period?
The food & beverage and healthcare industries are expected to witness the highest CAGR due to increasing demand for convenient, lightweight, and sustainable packaging solutions.
Which packaging types in the flexible packaging market are likely to drive growth over the coming years?
Pouches, bags, and films, among offerings of the flexible packaging market, are likely to drive market growth during the forecast period.
What are the drivers and opportunities for the flexible packaging market?
Increasing demand for sustainable packaging solutions, rising consumption of packaged food, and growth in e-commerce and retail industries are the major drivers and opportunities of the flexible packaging market.
What are the restraints and challenges for the players in the flexible packaging market?
Environmental concerns regarding plastic waste, recycling challenges, and regulatory restrictions on single-use plastics are the major challenges faced by market players.
Need a Tailored Report?
Customize this report to your needs
Get 10% FREE Customization
Customize This ReportPersonalize This Research
- Triangulate with your Own Data
- Get Data as per your Format and Definition
- Gain a Deeper Dive on a Specific Application, Geography, Customer or Competitor
- Any level of Personalization
Let Us Help You
- What are the Known and Unknown Adjacencies Impacting the Flexible Packaging Market
- What will your New Revenue Sources be?
- Who will be your Top Customer; what will make them switch?
- Defend your Market Share or Win Competitors
- Get a Scorecard for Target Partners

Custom Market Research Services
We Will Customise The Research For You, In Case The Report Listed Above Does Not Meet With Your Requirements
Get 10% Free CustomisationTESTIMONIALS

We at Nissan Chemicals Corporation have been clients of MarketsandMarkets for more than a year now. We recently consulted MarketsandMarkets for a study, the team at MarketsandMarkets was extremely professional and organized. The business insights were very detailed and aligned well with our expectations that really helped us formulate the Business Plans and device new strategies for development themes. MarketsandMarkets offers a unique combination of expertise and dedicated engagement model. Their research findings have helped us in designing our Pricing Strategy which will make it easier for us to predict the future sales and profits for the next ten years. We look forward to working with MarketsandMarkets in the future.
VP of Strategy & New Business Development
Leading Specialty Chemical Company
The MarketsandMarkets Engagement Model, composed of both the Knowledge Store and advisory custom research, has greatly helped us in understanding our markets and making strategic decisions. The Knowledge Store is a fast way to allow everyone in our organization to understand more about most any market they are interested in. The ability to then get custom research done and get answers to specific strategic questions and market insight has been spectacular. The Markets and Markets team feel more like colleagues than vendors and their services have helped us change our culture where statements of things like growth opportunities and competitive position are always backed by industry research.

Rich Gibson,
Director, Corporate Strategy
Milliken & Company,
Leading Industrial Manufacturer of specialty chemical, floor covering, performance and protective textile materials, and healthcaremilliken.com
MarketsandMarkets is a trusted resource that helps us to better understand markets that are near-adjacencies-whether its technology, value chain or geography. Their Knowledge Store platform provides a dashboard of markets and their characteristics which is easy to use and saves us time.
Adam Shaw,
Market Development and Strategy Manager
AdvanSix Inc. USA,
An American Leader in Chemicalswww.advansix.com
The Knowledge Store from MarketsandMarkets is a valuable tool which has helped my team acquire greater insight in to the end markets that our business serves. This has enabled us to help our company build stronger strategies throughout our planning process.
TOSHIO KINOSHITA
Senior Chif Consultion Research & Consulting Division
Mitsubishi Chemical Research Corporation,
Leading Manufacturer of Chemical Productswww.mitsubishichem-res.co.jp/en/

We recently engaged with MarketsandMarkets for a study, the team not only clearly understood our business objectives but was also extremely professional in the way they handled the entire project. The study was efficiently conducted in a phase-wise manner, and the engagement model furnished us with high-quality business insights that far exceeded our expectations at each phase. We were especially happy that MarketsandMarkets could provide us with both, an English as well as a Japanese version of the study. A special thanks to the Analyst Team and Client Services Team, whose fluency in Japanese enhanced our comfort level, as we could converse with them in our preferred language.
Independent entrepreneurs
Arrow Precision
We approached MarketsandMarkets for study on Proppants Market, and their work exceeded our expectations. The study conducted was comprehensive and enabled us to view the market through the various dimensions. In addition, the team was extraordinarily responsive throughout the process and resolved our queries on time. I strongly recommend MarketsandMarkets and will certainly consider them for additional market assessments we will need in the future.
Global engineering company, Japan
Deputy Manager,
Strategic Planning OfficeThe high-quality insights shared by the MarketsandMarkets team helped us understand the pharmaceutical plant designers in a specific geography. It also captured the risks that we may likely face in communicating with our potential partners. The study would enable us identify partners, which would impact our future growth.


Growth opportunities and latent adjacency in Flexible Packaging Market