Fuel Gas System Market for Combined-Cycle Power Plants, By Fuel Type (Natural Gas, Hydrogen Blends), Supplier Type (Integrated-skid Suppliers, System & Component Integrators), End User, Capacity and Region - Global Forecast to 2031

icon1
USD 1,837.7 MN
MARKET SIZE, 2031
icon2
CAGR 5.4%
(2026-2031)
icon3
255
REPORT PAGES
icon4
150
MARKET TABLES

OVERVIEW

fuel-gas-system-market Overview

Source: Secondary Research, Interviews with Experts, MarketsandMarkets Analysis

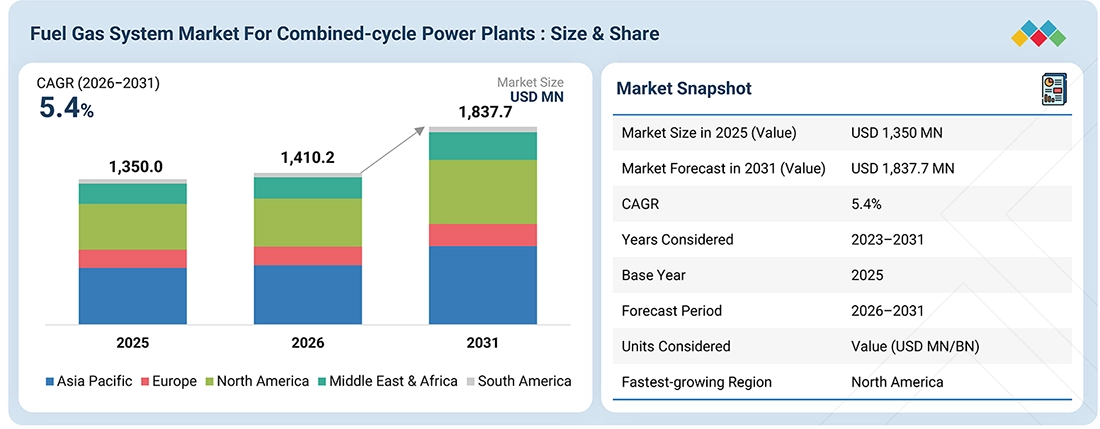
The fuel gas system market for combined-cycle power plants is projected to grow from USD 1,410.2 million in 2026 to USD 1,837.7 million by 2031, at a CAGR of 5.4%. Market growth is supported by continued investment in CCGT power-generation capacity and increasing electricity demand across regions. The expansion of LNG supply and gas infrastructure is improving fuel availability for CCGT plants, particularly in markets with growing reliance on gas-fired generation. In addition, the growing development of high-capacity CCGT projects is creating demand for larger, more integrated fuel gas systems.

KEY TAKEAWAYS

  • BY REGION
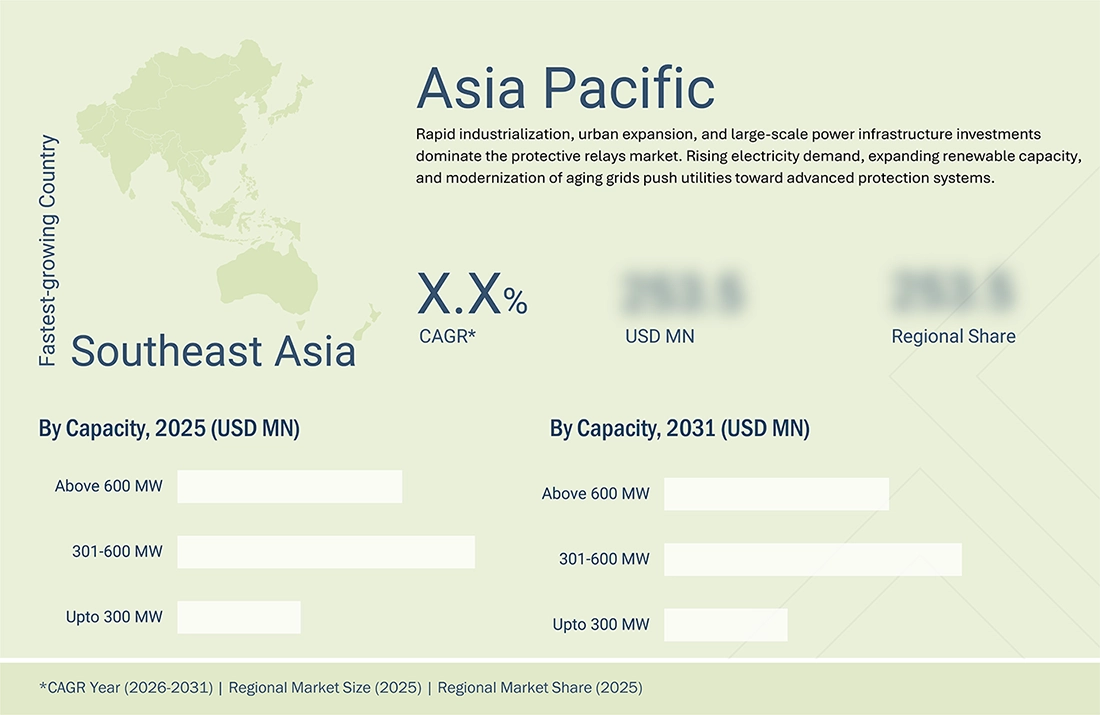
    Asia Pacific is expected to account for the largest share of the fuel gas system market for combined-cycle power plants during the forecast period, with a CAGR of 5.8%, supported by industrial automation, electrification, and power infrastructure investments across the region.
  • BY CAPACITY
    The above-600 MW segment is expected to register a CAGR of 5.9% during the forecast period, supported by the increasing development of large-capacity CCGT plants and the growing requirement for high-volume, reliable fuel-gas supply systems. Larger combined-cycle plants require fuel gas systems designed to accommodate higher gas flow rates and more demanding operating conditions, increasing the value and technical complexity of associated fuel gas conditioning packages
  • BY FUEL TYPE
    Natural gas is expected to account for the largest share of the fuel gas system market for combined-cycle power plants during the forecast period.
  • BY SUPPLIER TYPE
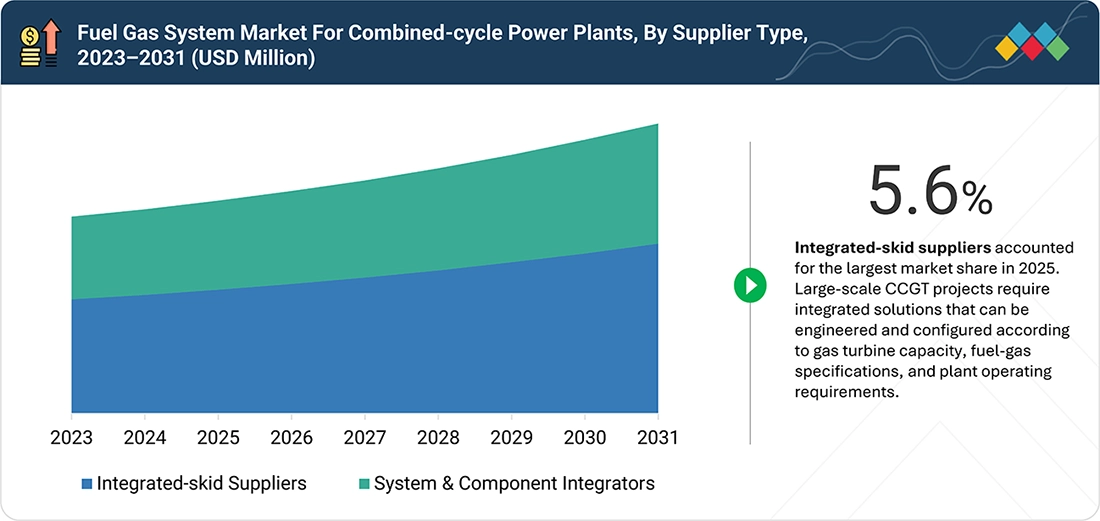
    Integrated-skid Suppliers is expected to account for the largest share of the fuel gas system market for combined-cycle power plants.
  • BY END USER
    Industrial(Captive) is expected to register the highest CAGR during the forecast period.
  • COMPETITIVE LANDSCAPE
    KROHNE Group (Germany), Emersen Electric Co. (US), Gaumer Process (US), Multitex Group (India), and GENERON (US) have been identified as leading players in the global fuel gas system market. These companies are strengthening their market positions through broad product portfolios, technological innovation, manufacturing capabilities, and strategic expansion across key regional markets.
  • COMPETITIVE LANDSCAPE
    EML Manufacturing, LLC (US), Sungov Engineering (India), Petrogas Gas-systems (Netherlands), Process Systems (France) and Kilburn (India) are emerging/specialized players in the fuel gas system market for combined-cycle power plant. These companies are expanding their market presence through customized skids.

The Fuel Gas System market for combined-cycle power plants is expected to grow during 2026–2031, supported by increasing requirements for reliable fuel delivery, tighter fuel-quality management, and greater flexibility in CCGT plant operations. The increasing availability of LNG and expansion of gas-import infrastructure are improving fuel accessibility for CCGT projects in emerging markets, enabling the development of plants in locations with limited domestic gas availability. In parallel, the replacement of aging coal- and oil-fired power plants is creating opportunities for new CCGT installations and associated fuel gas infrastructure

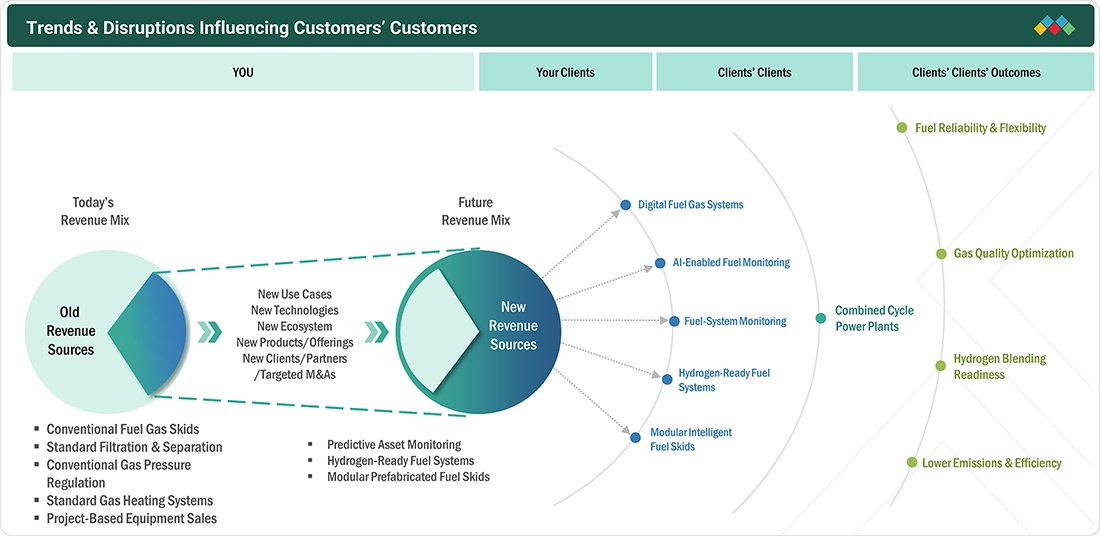
TRENDS & DISRUPTIONS IMPACTING CUSTOMERS' CUSTOMERS

The fuel gas system market for combined-cycle power plants is expected to grow at a CAGR of 5.4% during the forecast period, with KROHNE, Emerson Electric Co., Gaumer Process, Multitex Group, and GENERON strengthening their positions across the market. They are expanding their capabilities through product development, customized system engineering, strategic collaborations, and integration of hydrogen-ready technologies. The growing deployment of high-capacity CCGT plants and increasing requirements for reliable and flexible fuel-gas management are further creating opportunities for suppliers to expand their presence across global power-generation markets

fuel-gas-system-market Disruptions

Source: Secondary Research, Interviews with Experts, MarketsandMarkets Analysis

MARKET DYNAMICS

Drivers
Impact
Level
  • Growing CCGT capacity additions are driving demand for reliable, high-performance fuel gas conditioning systems
  • Accelerating Hydrogen Integration in Gas-Fired Power Plants Expands Advanced Fuel-Gas System Requirements
RESTRAINTS
Impact
Level
  • High Equipment Reliability Requirements Increase Maintenance Burden for CCGT Fuel Gas Systems
  • Long Operating Life of Installed CCGTs Limits Replacement Demand for Fuel Gas Systems
OPPORTUNITIES
Impact
Level
  • Brownfield Modernization Creates Replacement Demand for Aging CCGT Fuel-Gas Conditioning Equipment
  • Expanding Natural Gas Demand and Infrastructure for Power Generation Creates Opportunities for Fuel Gas Systems
CHALLENGES
Impact
Level
  • Stringent Emission Standards Increase Technical Integration Requirements for CCGT Fuel Gas Systems

Source: Secondary Research, Interviews with Experts, MarketsandMarkets Analysis

Driver: Growing CCGT capacity additions are driving demand for reliable, high-performance fuel gas conditioning systems

The expansion of combined cycle gas turbine (CCGT) capacity is directly increasing the addressable demand for fuel gas systems, as every new gas-fired generation project requires reliable fuel preparation, filtration, pressure regulation, metering, heating, and gas-quality management before fuel reaches the gas turbine. This creates recurring equipment demand across new-build power plants, capacity additions, and plant modernization projects. The requirement becomes particularly important for large-scale CCGTs because fuel-gas conditioning directly influences turbine protection, combustion stability, availability, and overall plant operating reliability. The US Energy Information Administration (EIA) reported in June 2025 that developers planned to add 18.7 GW of CCGT capacity by 2028, including 4.3 GW already under construction. EIA also identified 10.6 GW potentially coming online in 2028, which, if realized, would represent the largest annual addition of CCGT capacity since 2018. These projects translate into incremental requirements for engineered fuel-gas conditioning skids and associated gas-treatment equipment, particularly during EPC execution and equipment procurement. U.S. Energy Information Administration Beyond new capacity, CCGT operators are increasingly prioritizing fuel flexibility and operational adaptability, creating additional technical requirements for fuel-gas systems. EIA notes that two planned plants, totaling 1.5 GW, are designed to co-fire hydrogen, demonstrating movement toward gas turbines capable of handling changing fuel compositions. This increases the importance of fuel-gas systems capable of maintaining controlled pressure, temperature, cleanliness, and fuel quality under varying operating conditions. Consequently, the market opportunity extends beyond conventional natural-gas skids toward flexible, higher-specification conditioning systems supporting hydrogen blending, changing gas quality, and long-term turbine reliability.

Restraint: Long Operating Life of Installed CCGTs Limits Replacement Demand for Fuel Gas Systems

Fuel gas conditioning systems are associated with long-life power-generation assets, which limits recurring replacement demand once a CCGT plant has been commissioned. Unlike equipment with frequent replacement cycles, fuel gas skids, filtration assemblies, pressure-control equipment, and associated piping can remain integrated with the plant for extended operating periods, with maintenance and component replacement generally occurring without replacing the complete system. This creates a structural limitation on aftermarket demand for complete fuel gas systems. The installed CCGT fleet therefore provides a relatively durable equipment base. EIA data indicates that a substantial portion of U.S. CCGT capacity was built during the early 2000s, with many of these plants now operating for around two decades. EIA also notes that about half of current U.S. CCGT capacity was built between 2000 and 2006. For fuel gas system manufacturers, this means that new system sales are more dependent on new CCGT projects than on frequent replacement of existing complete systems. Maintenance, refurbishment, and individual component replacement can generate aftermarket opportunities, but these do not necessarily translate into equivalent demand for complete fuel gas conditioning skids. The long asset life of CCGT plants therefore structurally limits the replacement-driven portion of the market.

Opportunity: Expanding Natural Gas Demand and Infrastructure for Power Generation Creates Opportunities for Fuel Gas Systems

The IEA’s Gas 2025 outlook projects global natural gas demand to increase by approximately 9% between 2024 and 2030, representing around 380 bcm of additional demand. The power sector is expected to account for more than one-third of the net increase in natural gas demand, while around 300 bcm/year of new LNG export capacity is expected globally by 2030. The increasing availability of natural gas, supported by additional LNG supply, is expected to strengthen fuel availability for gas-fired power generation and support the development of new CCGT capacity. In parallel, continued expansion of natural gas transportation infrastructure is improving connectivity between gas supply sources and power-generation facilities. Canada Action reports more than 233,440 km of planned and announced large-diameter oil and gas pipelines expected to come online globally between 2024 and 2030. Major pipeline developments across the U.S.–Mexico corridor, China, Russia–China, West Africa, the Middle East–India corridor, and Southeast Asia demonstrate continued investment in long-distance natural gas transportation infrastructure. The combination of rising natural gas demand from the power sector and expanding gas transportation infrastructure creates opportunities for fuel gas systems used in CCGT power plants. Gas received from transmission pipelines must meet turbine-specific requirements for pressure, temperature, cleanliness, moisture content, and gas quality before combustion. Fuel gas systems address these requirements through processes such as filtration and separation, pressure regulation, gas heating, metering, and gas-quality monitoring. Consequently, increasing natural gas availability and improved pipeline connectivity to gas-fired power plants are expected to support demand for packaged fuel gas systems in new CCGT installations.

Challenge: Stringent Emission Standards Increase Technical Integration Requirements for CCGT Fuel Gas Systems

Increasingly stringent emissions requirements create a technical challenge for fuel gas system suppliers because CCGT operators must maintain precise fuel delivery conditions to support low-emission turbine operation. Requirements around fuel pressure, flow, temperature, gas quality, and combustion stability become more demanding as turbine combustion systems are optimized for lower NOx emissions. For fuel gas system suppliers, this increases the need for precise pressure regulation, filtration, metering, heating, instrumentation, and control-system integration. The fuel gas package must operate within the turbine OEM’s specified fuel envelope while maintaining stable combustion conditions and supporting the plant’s emissions-control configuration. EPA requirements for stationary combustion turbines establish emissions limits and associated compliance requirements, while project-specific permitting can impose additional controls. This creates greater engineering complexity, validation requirements, OEM coordination, and commissioning risk for suppliers. As emission performance becomes increasingly integrated with turbine and fuel-system design, suppliers must demonstrate that their equipment can maintain the required fuel conditions throughout varying operating loads. Consequently, stringent emission standards increase the technical qualification burden and reduce the scope for standardized fuel gas system configurations across CCGT projects.

FUEL GAS SYSTEMS MARKET: COMMERCIAL USE CASES ACROSS INDUSTRIES

COMPANY USE CASE DESCRIPTION BENEFITS
company logo
Gas-turbine and compressor applications require consistent fuel quality, pressure, temperature and moisture control | Multitex identifies challenges including black-powder contamination, water and hydrocarbon dew-point control, fine filtration, gas heating, pressure regulation, metering, ESD protection and integration with turbine/OEM control systems | Its documented projects include fuel gas conditioning for GE and Siemens machines and the 2,000-MW F2 power plant in the UAE Multitex supplied integrated fuel-gas conditioning packages incorporating filtration, separation, dehydration, heating, pressure regulation, metering, automation and safety systems | Its documented experience includes natural-gas conditioning skids for 16 GE Frame 9FA and two Siemens V94.3 machines, as well as fuel-gas conditioning skids for the 2,000-MW F2 power plant in the UAE
company logo
Saline Water Conversion Corporation (SWCC) required a fuel gas conditioning system for its large-scale power and desalination facility to provide a reliable and continuous fuel supply to 12 gas turbines | Petrogas was contracted to supply a 1 million Nm³/h fuel gas conditioning station, together with a backup fuel-oil system | In cooperation with the owner’s engineer Pöyry, Petrogas designed six identical blocks, each comprising two mirrored gas-conditioning systems | The overall installation included 12 complete 12-inch gas-conditioning systems with 100% redundancy, along with ESD valves, filters, flow meters, heaters, pressure-reduction systems, pressure-boosting compressors, and a high-pressure gas buffer system The 100% redundant configuration enhanced fuel-gas supply continuity and reduced the risk of disruption to gas-turbine operations | The mirrored system architecture provided operational flexibility and facilitated maintenance without requiring a complete shutdown of the fuel-gas supply | The integrated configuration combined multiple conditioning and safety functions within a standardized package, supporting consistent system performance across the installation | Prefabrication of the skid systems also helped streamline transportation, site installation, and project execution for the large-scale gas-turbine application

Logos and trademarks shown above are the property of their respective owners. Their use here is for informational and illustrative purposes only.

MARKET ECOSYSTEM

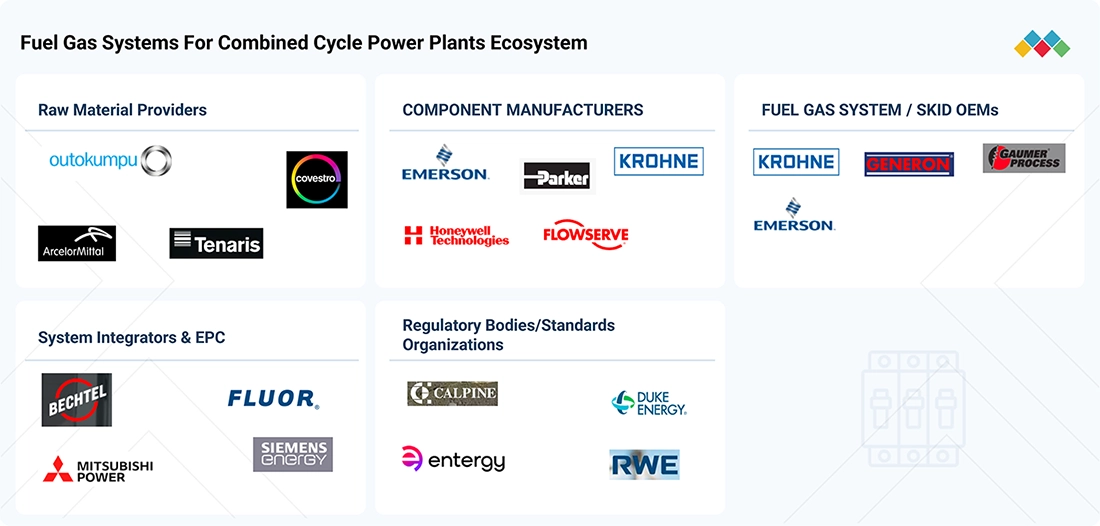
The fuel gas systems ecosystem for combined-cycle power plants comprises multiple participants, including raw material suppliers, component manufacturers, fuel gas system and skid manufacturers, system integrators and EPCs, and end-users. Raw material suppliers provide key materials for fabricating fuel gas system equipment, while component manufacturers supply critical equipment such as valves, filtration and separation equipment, control systems, metering equipment, and related gas-handling components. Fuel gas system and skid OEMs integrate these components into application-specific fuel gas conditioning packages for CCGT plants. System integrators and EPC contractors undertake system engineering, project integration, installation, and commissioning, often working closely with turbine OEMs and plant developers. Sometimes they procure components from component manufacturers and do the Engineering, procurement, and construction by themselves. At the downstream end, utilities, independent power producers, and industrial (captive) users operate CCGT facilities and represent the primary demand base for fuel gas systems.

fuel-gas-system-market Ecosystem

Logos and trademarks shown above are the property of their respective owners. Their use here is for informational and illustrative purposes only.

MARKET SEGMENTS

fuel-gas-system-market Segments

Source: Secondary Research, Interviews with Experts, MarketsandMarkets Analysis

Fuel Gas System Market for Combined-Cycle Power Plants, By Fuel Type

Natural gas is expected to dominate the Fuel Gas System market for combined-cycle power plants in 2025, driven by its widespread availability, well-established gas transmission and distribution infrastructure, and mature supply networks. The extensive development of natural gas infrastructure provides reliable fuel access and supports the continued deployment of CCGT projects across established and emerging power markets.

Fuel Gas System Market for Combined-Cycle Power Plants, By Supplier Type

The integrated-skid suppliers segment is expected to register the highest growth in the Fuel Gas System market for combined-cycle power plants. Growth is supported by increasing demand for complete, pre-engineered fuel gas packages that simplify system integration, installation, and commissioning for CCGT projects. The segment is also benefiting from the growing complexity of fuel gas requirements in larger-capacity plants and increasing demand for customized skid solutions.

Fuel Gas System Market for Combined-Cycle Power Plants, By Capacity

The 301–600 MW capacity segment is expected to account for the second-largest share of the Fuel Gas System market for combined-cycle power plants in 2025, supported by the widespread deployment of mid-sized CCGT plants across utility-scale power projects. This capacity range represents a significant portion of new and existing CCGT installations, creating steady demand for fuel gas conditioning systems.

Fuel Gas System Market for Combined-Cycle Power Plants, By End User

The Industrial (Captive) segment is expected to register the highest CAGR in the Fuel Gas System market for combined-cycle power plants during the forecast period. Growth is supported by increasing adoption of captive CCGT plants by industrial facilities seeking greater control over power supply, energy costs, and operational reliability. The development of dedicated power-generation facilities for large industrial operations is creating demand for fuel gas systems tailored to specific plant requirements and operating conditions.

REGION

Asia Pacific is expected to account for the largest market share during the forecast period

The Asia Pacific fuel gas systems market for combined-cycle power plants holds the largest share, driven by rising investments in combined-cycle power generation, growing electricity demand, and the expansion and modernization of gas-fired power infrastructure across the region. Southeast Asia is emerging as a key growth area, supported by the development of gas-fired power projects in Vietnam, Indonesia, Thailand, and the Philippines, alongside expanding LNG import infrastructure and efforts to improve power supply reliability. Increasing investments in gas-to-power projects and the replacement of aging thermal power generation assets with more efficient combined-cycle facilities are further supporting demand for integrated fuel gas systems. Leading regional and global players are strengthening their presence through project-specific system integration, localized manufacturing, technology upgrades, and strategic partnerships to capitalize on the region's expanding gas-fired power generation infrastructure.

fuel-gas-system-market Region

FUEL GAS SYSTEMS MARKET: COMPANY EVALUATION MATRIX

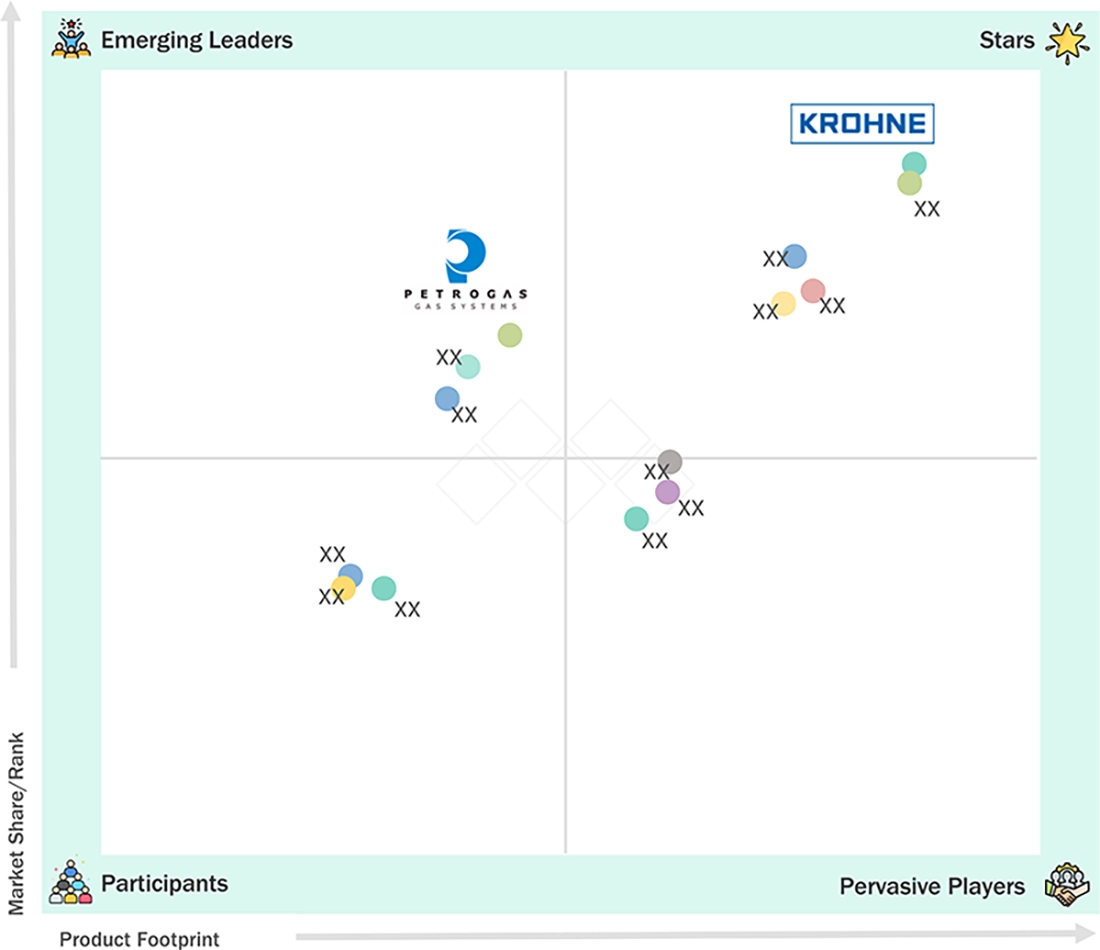
KROHNE Group, a leading fuel gas system manufacturer, falls into the “Star” category because of its strong product portfolio and rapid global expansion. The company benefits from large-scale manufacturing capabilities and consistent innovation. Continuous investment in R&D, reliable quality standards, and an expanding international presence position KROHNE as a high-growth, high-potential player in the global fuel gas system market for combined-cycle power plants.

fuel-gas-system-market Evaluation Metrics

Source: Secondary Research, Interviews with Experts, MarketsandMarkets Analysis

KEY MARKET PLAYERS

  • KROHNE Group (Germany)
  • Emerson Electric Co. (US)
  • Gaumer Process (US)
  • Multitex Group (India)
  • GENERON (US)
  • EML Manufacturing, LLC (Ireland)
  • Sungov Engineering (India)
  • Petrogas Gas Systems (Netherlands)
  • Process Systems (France)
  • Kilburn (India)
  • ERGIL (Turkey)
  • E&CO (South Korea)
  • DAIPem Integrated Limited (India)
  • Integrated Flow Solutions (US)
  • Fisher Energy (US)
  • UNITBIRWELCO (UK)
  • Delta Filters & Separators (India)
  • En-Fab (US)
  • GROUP ATP (Italy)
  • Petrogas Industry (Türkiye)
  • Campitelli (Italy)
  • Best Wide Engineering (Malaysia)
  • HEAT gas technologies (Austria)
  • BGR Tech Ltd. (India)
  • Equicor Technologies Pvt. Ltd. (India)
  • Croft Production Systems (US)

MARKET SCOPE

REPORT METRIC DETAILS
Market Size in 2025 (Value) USD 1,350.0 Million
Market Size in 2026 (Value) USD 1,410.2 Million
Market Forecast in 2031 (Value) USD 1,837.7 Million
Growth Rate CAGR of 5.4% from 2026-2031
Years Considered 2023–2031
Base Year 2025
Forecast Period 2026–2031
Units Considered Value (USD Million/Billion)
Report Coverage Market size and forecast, company profiling, competitive landscape, market dynamics (drivers, restraints, opportunities, and challenges), technology trends, ecosystem analysis, commercial use cases, and regional analysis
Segments Covered
  • By Fuel Type:
    • Natural Gas
    • Blended Hydrogen
    • and Other Gaseous Fuels
  • By Supplier Type:
    • Integrated-skid Suppliers
    • System & component Integrators
  • By Capacity:
    • Upto 300 MW
    • 301-600 MW
    • Above 600 MW
  • End User:
    • Utilities
    • Industrial (Captive)
Regions Covered North America,Europe, Asia Pacific, Middle East & Africa, and South America

WHAT IS IN IT FOR YOU: FUEL GAS SYSTEMS MARKET REPORT CONTENT GUIDE

fuel-gas-system-market Content Guide

DELIVERED CUSTOMIZATIONS

We have successfully delivered the following deep-dive customizations:

CLIENT REQUEST CUSTOMIZATION DELIVERED VALUE ADDS
Fuel Gas Systems For Turbines, Boilers, and Industrial Applications
  • Market sizing and forecasting of the global fuel gas systems market across turbines, industrial boilers, and industrial applications
  • The study was customized to provide detailed analysis by application, fuel type, and region, along with an assessment of key market drivers, investment trends, and competitive developments
  • Provided application-specific market insights to help assess growth opportunities across different applications
  • The analysis quantified demand for fuel gas systems for turbines, industrial boilers, and industrial applications, while identifying high-growth applications, regional investment opportunities, and key companies participating across the fuel gas systems value chain

RECENT DEVELOPMENTS

  • September 2026 : KROHNE Group introduced the OPTIMASS 5400, a compact Coriolis mass flowmeter for standard gas and liquid applications. It combines measurement performance, reliability, and cost efficiency, supporting chemical processing, oil and gas, marine, utility measurement, and fuel consumption monitoring applications.
  • July 2026 : KROHNE Group introduced PipePatrol NEO, an AI-enhanced pipeline monitoring platform. The system supports safe, efficient, and sustainable pipeline operations through advanced leak detection and monitoring capabilities, strengthening digital pipeline integrity management for operators across energy and industrial infrastructure applications.
  • May 2025 : WIKA and KROHNE Group expanded their strategic cooperation in temperature measurement. WIKA became KROHNE’s exclusive partner for temperature products, enabling access to a broader portfolio, application expertise, certifications, and services. The agreement also involved WIKA’s acquisition of INOR Process AB.
  • March 2025 : Emerson completed its acquisition of the remaining outstanding shares of AspenTech, making it a wholly owned subsidiary. AspenTech's industrial software and process optimization capabilities can complement Emerson's automation portfolio in energy and process industries. For fuel gas systems, the combination may support digital monitoring, process modeling, and optimization alongside physical gas regulation and conditioning equipment.

Table of Contents

checkmarkExclusive indicates content/data unique to MarketsandMarkets and not available with any competitors.

TITLE
PAGE NO
1
INTRODUCTION


27
2
EXECUTIVE SUMMARY


31
3
PREMIUM INSIGHTS


36
4
MARKET OVERVIEW
Explore dynamic shifts and strategic opportunities in evolving fuel gas systems markets.


40
 
4.1
INTRODUCTION


4.2
MARKET DYNAMICS


4.2.1
DRIVERS


4.2.1.1
GROWING CCGT CAPACITY AND CHANGING FUEL COMPOSITIONS


4.2.1.2
GOVERNMENT-BACKED HYDROGEN CO-FIRING INITIATIVES


4.2.2
RESTRAINTS


4.2.2.1
HIGH MAINTENANCE COSTS DUE TO STRINGENT RELIABILITY REQUIREMENTS


4.2.2.2
LIMITED AFTER-MARKET DEMAND DUE TO LONG CCGT ASSET LIFE


4.2.3
OPPORTUNITIES


4.2.3.1
AGING FUEL GAS INFRASTRUCTURE CREATING BROWNFIELD MODERNIZATION OPPORTUNITIES


4.2.3.2
EXPANDING NATURAL GAS DEMAND AND INFRASTRUCTURE FOR POWER GENERATION CREATING OPPORTUNITIES FOR FUEL GAS SYSTEMS


4.2.4
CHALLENGES


4.2.4.1
STRINGENT EMISSION STANDARDS INCREASING TECHNICAL INTEGRATION REQUIREMENTS FOR FUEL GAS SYSTEMS


4.3
UNMET NEEDS AND WHITE SPACES


4.4
INTERCONNECTED MARKETS AND CROSS-SECTOR OPPORTUNITIES


4.5
EMERGING BUSINESS MODELS AND ECOSYSTEM SHIFTS


4.6
STRATEGIC MOVES BY TIER 1/2/3 PLAYERS


5
INDUSTRY TRENDS
Navigate competitive pressures and capitalize on emerging modular and digital fuel system trends.


52
 
5.1
PORTER’S FIVE FORCES ANALYSIS


5.1.1
INTENSITY OF COMPETITIVE RIVALRY


5.1.2
THREAT OF NEW ENTRANTS


5.1.3
BARGAINING POWER OF SUPPLIERS


5.1.4
BARGAINING POWER OF BUYERS


5.1.5
THREATS OF SUBSTITUTES


5.2
MACROECONOMIC OUTLOOK


5.2.1
INTRODUCTION


5.2.1.1
NATURAL GAS SUPPLY, PRICING, AND MARKET LIQUIDITY


5.2.1.2
POWER SECTOR FINANCING AND INFRASTRUCTURE CAPITAL ALLOCATION


5.2.1.3
INDUSTRIAL COST PRESSURES AND POWER GENERATION EFFICIENCY


5.2.2
GDP TRENDS AND FORECAST


5.2.3
TRENDS IN HYDROGEN-READY AND MULTI-FUEL CCGT INFRASTRUCTURE


5.2.4
TRENDS IN DIGITAL FUEL QUALITY MONITORING AND CONDITIONING AUTOMATION


5.2.5
TRENDS IN MODULARIZATION AND INTEGRATED FUEL GAS SKID ARCHITECTURES


5.3
SUPPLY CHAIN ANALYSIS


5.4
ECOSYSTEM ANALYSIS


5.5
PRICING ANALYSIS


5.5.1
PRICING RANGE OF FUEL GAS SYSTEMS, BY EQUIPMENT, 2025


5.5.2
AVERAGE COST OF COMBINED CYCLE POWER PLANTS, BY REGION, 2025


5.6
TRADE ANALYSIS


5.6.1
IMPORT SCENARIO (HS CODE 842139)


5.6.2
EXPORT SCENARIO (HS CODE 842139)


5.7
KEY CONFERENCES AND EVENTS, 2026–2027


5.8
TRENDS/DISRUPTIONS IMPACTING CUSTOMER BUSINESS


5.9
INVESTMENT AND FUNDING SCENARIO


5.10
CASE STUDY ANALYSIS


5.10.1
MULTITEX GROUP OFFERS FUEL GAS CONDITIONING SKIDS SUPPORTING RELIABLE GAS TURBINE OPERATION


5.10.2
PETROGAS SUPPLIES FUEL GAS CONDITIONING STATION TO RAS AL-KHAIR POWER PLANT FOR RELIABLE FUEL SUPPLY


5.11
IMPACT OF 2025–2026 US TARIFF – FUEL GAS SYSTEMS MARKET FOR COMBINED CYCLE POWER PLANTS


5.11.1
INTRODUCTION


5.11.2
KEY TARIFF RATES


5.11.3
PRICE IMPACT ANALYSIS


5.11.4
IMPACT ON REGIONS


5.11.4.1
NORTH AMERICA


5.11.4.2
ASIA PACIFIC


5.11.4.3
EUROPE


5.11.4.4
MIDDLE EAST & AFRICA


5.11.4.5
SOUTH AMERICA


5.11.5
IMPACT ON END USERS


6
TECHNOLOGICAL ADVANCES, AI-DRIVEN IMPACT, PATENTS, INNOVATIONS, AND FUTURE APPLICATIONS
AI-driven hydrogen-ready systems revolutionize fuel gas markets with autonomous, low-carbon, multi-fuel innovations.


77
 
6.1
KEY EMERGING TECHNOLOGIES


6.1.1
HYDROGEN-READY FUEL GAS BLENDING AND CONDITIONING SYSTEMS


6.1.2
INTELLIGENT DIGITAL FUEL GAS QUALITY AND CONDITIONING SYSTEMS


6.2
COMPLEMENTARY TECHNOLOGIES


6.2.1
ADVANCED LOW-NOX AND FUEL-FLEXIBLE COMBUSTION SYSTEMS


6.2.2
POST-COMBUSTION CARBON CAPTURE AND CO2 MANAGEMENT SYSTEMS


6.3
ADJACENT TECHNOLOGIES


6.3.1
LNG REGASIFICATION AND GAS-TO-POWER INFRASTRUCTURE


6.3.2
HYDROGEN PRODUCTION, STORAGE, AND DELIVERY INFRASTRUCTURE


6.4
TECHNOLOGY/PRODUCT ROADMAP


6.4.1
SHORT-TERM (2026–2028) | DIGITALIZED, HIGH-PRECISION, AND HYDROGEN-READY FUEL GAS SYSTEMS


6.4.2
MID-TERM (2029–2031) | FLEXIBLE HYDROGEN BLENDING, ADAPTIVE CONDITIONING, AND PREDICTIVE FUEL MANAGEMENT


6.4.3
LONG-TERM (2032–2035+) | AUTONOMOUS, MULTI-FUEL, AND FULLY INTEGRATED LOW-CARBON FUEL GAS PLATFORMS


6.5
PATENT ANALYSIS


6.6
FUTURE APPLICATIONS


6.7
IMPACT OF AI/GEN AI ON FUEL GAS SYSTEMS MARKET FOR COMBINED CYCLE POWER PLANTS


6.7.1
TOP USE CASES AND MARKET POTENTIAL


6.7.2
BEST PRACTICES FOLLOWED BY OEMS IN FUEL GAS SYSTEM PROCESSING


6.7.3
CASE STUDIES OF AI/GEN AI IMPLEMENTATION IN FUEL GAS SYSTEMS FOR COMBINED CYCLE POWER PLANTS


6.7.4
INTERCONNECTED ECOSYSTEM AND IMPACT ON MARKET PLAYERS


6.7.5
CLIENTS’ READINESS TO ADOPT AI/GEN AI-INTEGRATED FUEL GAS SYSTEMS MARKET FOR COMBINED CYCLE POWER PLANTS


6.8
SUCCESS STORIES AND REAL-WORLD APPLICATIONS


7
REGULATORY LANDSCAPE AND SUSTAINABILITY INITIATIVES
Navigate complex global regulations to enhance sustainability and secure eco-certifications in power systems.


91
 
7.1
REGIONAL REGULATIONS AND COMPLIANCE


7.1.1
REGULATORY BODIES, GOVERNMENT AGENCIES, AND OTHER ORGANIZATIONS


7.1.2
INDUSTRY STANDARDS


7.2
SUSTAINABILITY INITIATIVES


7.3
IMPACT OF REGULATORY POLICIES ON SUSTAINABILITY INITIATIVES


7.4
CERTIFICATIONS, LABELING, AND ECO-STANDARDS


8
CUSTOMER LANDSCAPE AND BUYER BEHAVIOR
Identify decision influencers and unmet needs to optimize market profitability in buyer behavior.


97
 
8.1
INTRODUCTION


8.2
DECISION-MAKING PROCESS


8.3
KEY STAKEHOLDERS INVOLVED IN BUYING PROCESS AND THEIR EVALUATION CRITERIA


8.3.1
KEY STAKEHOLDERS IN BUYING PROCESS


8.3.2
BUYING CRITERIA


8.4
ADOPTION BARRIERS AND INTERNAL CHALLENGES


8.5
UNMET NEEDS OF VARIOUS END USERS


8.6
MARKET PROFITABILITY


9
KEY FUNCTIONS OF FUEL GAS SYSTEMS DESIGNED FOR COMBINED CYCLE POWER PLANTS
Hydrogen-ready turbines and multi-unit systems propel growth in combined cycle power plants.


105
 
9.1
INTRODUCTION


9.2
UPSTREAM GAS HANDLING


9.3
MIDSTREAM FUEL GAS CONDITIONING


9.4
DOWNSTREAM TURBINE FUEL DISTRIBUTION AND COMBUSTION CONTROL


FUEL GAS SYSTEMS MARKET FOR COMBINED CYCLE POWER PLANTS,


10.1
INTRODUCTION


10.2
NATURAL GAS


10.2.1
ESTABLISHED INSTALLED BASE OF CCGT FLEET, MATURE PIPELINES, AND LNG SUPPLY SYSTEMS TO SUPPORT MARKET GROWTH


10.3
HYDROGEN BLENDS


10.3.1
DEVELOPMENT OF HYDROGEN-READY COMBINED CYCLE GAS TURBINES TO DRIVE MARKET


10.4
OTHER GASEOUS FUELS


FUEL GAS SYSTEMS MARKET FOR COMBINED CYCLE POWER PLANTS,


11.1
INTRODUCTION


11.2
UP TO 300 MW


11.2.1
LOCALIZED POWER GENERATION NEEDS TO CONTRIBUTE TO SEGMENTAL GROWTH


11.3
301–600 MW


11.3.1
MID-SCALE CCGTS PROJECTS TO CREATE GROWTH OPPORTUNITIES


11.4
ABOVE 600 MW


11.4.1
REQUIREMENT FOR MULTI-UNIT TURBINE TRAINS FOR FUEL DISTRIBUTION AND CONTROL TO FUEL SEGMENTAL GROWTH


12
FUEL GAS SYSTEMS MARKET FOR COMBINED CYCLE POWER PLANTS, BY SUPPLIER TYPE
Market Size & Growth Rate Forecast Analysis to 2031 in USD Million | 2 Data Tables


119
 
12.1
INTRODUCTION


12.2
INTEGRATED-SKID SUPPLIERS


12.2.1
RISING DEMAND FOR PRE-ENGINEERED, READY-TO-INSTALL FUEL GAS SKIDS TO FOSTER SEGMENTAL GROWTH


12.3
SYSTEM & COMPONENT INTEGRATORS


12.3.1
COMPLEX SYSTEM REQUIREMENTS TO SUPPORT DEMAND FOR FUEL GAS SYSTEM INTEGRATORS


13
FUEL GAS SYSTEMS MARKET FOR COMBINED CYCLE POWER PLANTS, BY END USER
Market Size & Growth Rate Forecast Analysis to 2031 in USD Million | 6 Data Tables


122
 
13.1
INTRODUCTION


13.2
UTILITIES


13.2.1
RISING ELECTRICITY DEMAND AND GRID CAPACITY EXPANSION TO EXPEDITE MARKET EXPANSION


13.3
INDUSTRIAL (CAPTIVE)


13.3.1
GROWING NUMBER OF DATA CENTERS AND INDUSTRIAL EXPANSION TO DRIVE MARKET


14
FUEL GAS SYSTEMS MARKET FOR COMBINED CYCLE POWER PLANTS, BY REGION
Comprehensive coverage of 10 Regions with country-level deep-dive of 15 Countries | 90 Data Tables.


127
 
14.1
INTRODUCTION


14.2
ASIA PACIFIC


14.2.1
CHINA


14.2.1.1
GROWING DEMAND FOR HIGH-EFFICIENCY H-CLASS CCGTS TO FUEL MARKET GROWTH


14.2.2
JAPAN


14.2.2.1
RISING LNG DEPENDENCE AND AGING THERMAL ASSETS TO ACCELERATE FUEL GAS MODERNIZATION


14.2.3
SOUTH KOREA


14.2.3.1
PRESENCE OF LARGE, MATURE LNG-BASED CCGT FLEET AND TECHNICALLY ADVANCED POWER PLANTS TO SUPPORT MARKET GROWTH


14.2.4
SOUTHEAST ASIA


14.2.4.1
LNG INFRASTRUCTURE EXPANSION ACROSS EMERGING ECONOMIES TO CREATE GROWTH OPPORTUNITIES


14.2.5
REST OF ASIA PACIFIC


14.3
NORTH AMERICA


14.3.1
US


14.3.1.1
GREENFIELD CCGT CAPACITY EXPANSION PROJECTS TO FOSTER MARKET GROWTH


14.3.2
CANADA


14.3.2.1
RISING FOCUS ON LIFE-EXTENSION UPGRADES AT EXISTING GAS-FIRED FACILITIES TO CONTRIBUTE TO MARKET EXPANSION


14.3.3
MEXICO


14.3.3.1
CFE’S EMPHASIS ON EXPANDING CCGT PIPELINES TO FACILITATE MARKET GROWTH


14.4
SOUTH AMERICA


14.4.1
BRAZIL


14.4.1.1
LNG-INTEGRATED CCGT EXPANSION PROJECTS TO STRENGTHEN DEMAND FOR ADVANCED FUEL GAS SYSTEMS


14.4.2
ARGENTINA


14.4.2.1
NEED TO RESTRUCTURE GAS AND ELECTRICITY FRAMEWORK TO BOOST DEMAND FOR FLEXIBLE FUEL GAS EQUIPMENT


14.4.3
REST OF SOUTH AMERICA


14.5
EUROPE


14.5.1
GERMANY


14.5.1.1
COAL-TO-GAS TRANSITION AND HYDROGEN INTEGRATION NEEDS TO SUSTAIN FUEL GAS SYSTEM DEMAND


14.5.2
ITALY


14.5.2.1
GROWING IMPORTANCE OF GAS-FIRED GENERATION AND BROWNFIELD REFURBISHMENT TO REINFORCE MARKET GROWTH


14.5.3
UK


14.5.3.1
CCGT REFURBISHMENT AND DECARBONIZATION REQUIREMENTS TO ACCELERATE FUEL GAS SYSTEM DEMAND


14.5.4
SPAIN


14.5.4.1
RISING USE OF RENEWABLE ENERGY SOURCES IN CCGTS TO CREATE HIGH DEMAND FOR FUEL GAS CONDITIONING EQUIPMENT


14.5.5
REST OF EUROPE


14.6
MIDDLE EAST & AFRICA


14.6.1
GCC


14.6.1.1
SAUDI ARABIA


14.6.1.1.1
OIL-TO-GAS POWER CONVERSION TO ACCELERATE LARGE-SCALE DEMAND FOR ADVANCED CCGT FUEL GAS TRAINS


14.6.1.2
UAE


14.6.1.2.1
DIGITIZED GAS-FIRED GENERATION TO RISE DEMAND FOR PRECISELY MONITORED AND CONTROLLABLE FUEL GAS INFRASTRUCTURE


14.6.1.3
REST OF GCC


14.6.2
EGYPT


14.6.2.1
LNG IMPORT REQUIREMENTS TO FACILITATE MARKET GROWTH


14.6.3
ALGERIA


14.6.3.1
GAS-ABUNDANT POWER EXPANSION PROJECTS TO DRIVE MARKET


14.6.4
REST OF MEA


15
COMPETITIVE LANDSCAPE
Discover how strategic maneuvers shape market dominance and reveal future industry leaders.


171
 
15.1
OVERVIEW


15.2
KEY PLAYER COMPETITIVE STRATEGIES/RIGHT TO WIN, 2023–2026


15.3
MARKET SHARE ANALYSIS, 2025


15.4
COMPANY EVALUATION MATRIX: KEY PLAYERS, 2025


15.4.1
STARS


15.4.2
EMERGING LEADERS


15.4.3
PERVASIVE PLAYERS


15.4.4
PARTICIPANTS


15.4.5
COMPANY FOOTPRINT: KEY PLAYERS, 2025


15.4.5.1
REGION FOOTPRINT


15.4.5.2
FUEL TYPE FOOTPRINT


15.4.5.3
CAPACITY FOOTPRINT


15.4.5.4
END USER FOOTPRINT


15.5
COMPANY EVALUATION MATRIX: STARTUPS/SMES, 2025


15.5.1
PROGRESSIVE COMPANIES


15.5.2
RESPONSIVE COMPANIES


15.5.3
DYNAMIC COMPANIES


15.5.4
STARTING BLOCKS


15.5.5
COMPETITIVE BENCHMARKING: STARTUPS/SMES, 2025


15.5.5.1
DETAILED LIST OF KEY STARTUPS/SMES


15.5.5.2
COMPETITIVE BENCHMARKING OF KEY STARTUPS/SMES


15.6
COMPANY VALUATION AND FINANCIAL METRICS


15.7
BRAND COMPARISON


15.7.1
KROHNE GROUP (GERMANY)


15.7.2
EMERSON ELECTRIC CO. (US)


15.7.3
GAUMER PROCESS (US)


15.7.4
GENERON (US)


15.7.5
MULTITEX GROUP (INDIA)


15.8
COMPETITIVE SCENARIO


15.8.1
PRODUCT LAUNCHES


15.8.2
DEALS


15.8.3
EXPANSIONS


16
COMPANY PROFILES
In-depth Company Profiles of Leading Market Players with detailed Business Overview, Product and Service Portfolio, Recent Developments, and Unique Analyst Perspective (MnM View)


190
 
16.1
KEY PLAYERS


16.1.1
KROHNE GROUP


16.1.1.1
BUSINESS OVERVIEW


16.1.1.2
PRODUCTS/SOLUTIONS/SERVICES OFFERED


16.1.1.3
RECENT DEVELOPMENTS


16.1.1.3.1
PRODUCT LAUNCHES


16.1.1.3.2
DEALS


16.1.1.3.3
EXPANSIONS


16.1.1.4
MNM VIEW


16.1.1.4.1
KEY STRENGTHS/RIGHT TO WIN


16.1.1.4.2
STRATEGIC CHOICES


16.1.1.4.3
WEAKNESSES/COMPETITIVE THREATS


16.1.2
EMERSON ELECTRIC CO.


16.1.3
GAUMER PROCESS


16.1.4
MULTITEX GROUP


16.1.5
GENERON


16.1.6
INTEGRATED FLOW SOLUTIONS, INC.


16.1.7
DELTA FILTERS & SEPARATORS PVT LTD


16.1.8
ERGIL


16.1.9
KILBURN


16.1.10
EML MANUFACTURING, LLC


16.1.11
EN-FAB


16.1.12
EQUICOR TECHNOLOGIES PVT LTD


16.1.13
GROUP ATP S.P.A.


16.1.14
SUNGOV ENGINEERING


16.1.15
E&CO


16.1.16
DAIPEM INTEGRATED LIMITED


16.1.17
PETROGAS GAS SYSTEMS


16.1.18
CAMPITELLI S.R.L.


16.1.19
PROCESS SYSTEMS


16.1.20
PETROGAS INDUSTRY - PGI INDUSTRIAL SYSTEMS MANUFACTURING AND ENGINEERING CO.


16.1.21
PETRONASH BY ATN


16.1.22
FISHER ENERGY


16.2
OTHER PLAYERS


16.2.1
BEST WIDE ENGINEERING (M) SDN. BHD


16.2.2
UNITBIRWELCO


16.2.3
HEAT GAS TECHNOLOGIES GMBH


16.2.4
BGR TECH


16.3
KEY COMPONENT PROVIDERS


17
RESEARCH METHODOLOGY


244
 
17.1
RESEARCH DATA


17.1.1
SECONDARY DATA


17.1.1.1
LIST OF KEY SECONDARY SOURCES


17.1.1.2
KEY DATA FROM SECONDARY SOURCES


17.1.2
PRIMARY DATA


17.1.2.1
KEY DATA FROM PRIMARY SOURCES


17.1.2.2
LIST OF PRIMARY INTERVIEW PARTICIPANTS


17.1.2.3
KEY INDUSTRY INSIGHTS


17.1.2.4
BREAKDOWN OF PRIMARY INTERVIEWS


17.2
MARKET SIZE ESTIMATION


17.2.1
BOTTOM-UP APPROACH


17.2.2
TOP-DOWN APPROACH


17.2.3
MARKET SIZE CALCULATION FOR BASE YEAR


17.2.3.1
DEMAND-SIDE ANALYSIS


17.2.3.1.1
DEMAND-SIDE ASSUMPTIONS


17.2.3.1.2
DEMAND-SIDE CALCULATIONS


17.2.3.2
SUPPLY-SIDE ANALYSIS


17.2.3.2.1
SUPPLY-SIDE ASSUMPTIONS


17.2.3.2.2
SUPPLY-SIDE CALCULATIONS
 
 
17.3
MARKET FORECAST APPROACH


17.3.1
DEMAND SIDE


17.3.2
SUPPLY SIDE


17.4
DATA TRIANGULATION


17.5
FACTOR ANALYSIS


17.6
RESEARCH ASSUMPTIONS AND LIMITATIONS


17.7
RISK ANALYSIS


18
APPENDIX


260
 
18.1
INSIGHTS FROM INDUSTRY EXPERTS


18.2
DISCUSSION GUIDE


18.3
KNOWLEDGESTORE: MARKETSANDMARKETS’ SUBSCRIPTION PORTAL


18.4
CUSTOMIZATION OPTIONS


18.5
RELATED REPORTS


18.6
AUTHOR DETAILS


LIST OF TABLES


TABLE 1
FUEL GAS SYSTEMS MARKET FOR COMBINED CYCLE POWER PLANTS: INCLUSIONS AND EXCLUSIONS


TABLE 2
INTERCONNECTED MARKETS


TABLE 3
KEY MOVES AND STRATEGIC FOCUS OF TIER 1/2/3 PLAYERS


TABLE 4
IMPACT OF PORTER’S FIVE FORCES


TABLE 5
GDP PERCENTAGE CHANGE, BY COUNTRY, 2021–2029


TABLE 6
ROLE OF COMPANIES IN FUEL GAS SYSTEMS FOR COMBINED CYCLE POWER PLANTS ECOSYSTEM


PRICING RANGE OF FUEL GAS SYSTEMS, BY EQUIPMENT,


2025
(USD MILLION/SYSTEM)


62
 
AVERAGE COST OF COMBINED CYCLE POWER PLANTS, BY REGION,


2025
(USD/KW)


62
TABLE 9
IMPORT DATA FOR HS CODE 842139-COMPLIANT PRODUCTS, BY COUNTRY, 2021–2025 (USD THOUSAND)


TABLE 10
EXPORT DATA FOR HS CODE 842139-COMPLIANT PRODUCTS, BY COUNTRY, 2021–2025 (USD THOUSAND)


TABLE 11
FUEL GAS SYSTEMS MARKET FOR COMBINED CYCLE POWER PLANTS: LIST OF KEY CONFERENCES AND EVENTS, 2026–2027


TABLE 12
MULTITEX GROUP: SECONDARY FUEL GAS CONDITIONING/ POWER PLANT APPLICATIONS


TABLE 13
PETROGAS: FUEL GAS CONDITIONING SYSTEM DEPLOYMENT IN RAS AL-KHAIR POWER PLANT IN SAUDI ARABIA FOR RELIABLE FUEL SUPPLY


TABLE 14
US-ADJUSTED RECIPROCAL TARIFF RATES


TABLE 15
EXPECTED CHANGE IN PRICES AND POTENTIAL IMPACT ON MARKET PLAYERS DUE TO TARIFFS


TABLE 16
LIST OF PATENTS, 2025–2026


TABLE 17
HYDROGEN-READY AND HYDROGEN-BLENDED CCGTS


TABLE 18
LNG-TO-POWER AND GAS SUPPLY FLEXIBILITY


TABLE 19
FLEXIBLE AND HIGH-CYCLING CCGT GENERATION


TABLE 20
DIGITALIZED FUEL GAS MANAGEMENT


TABLE 21
MULTI-FUEL AND LOW-CARBON GAS CCGTS


TABLE 22
TOP USE CASES AND MARKET POTENTIAL


TABLE 23
BEST PRACTICES: COMPANIES IMPLEMENTING USE CASES


TABLE 24
FUEL GAS SYSTEMS MARKET FOR COMBINED CYCLE POWER PLANTS: CASE STUDIES RELATED TO GEN AI IMPLEMENTATION


TABLE 25
INTERCONNECTED ECOSYSTEM AND IMPACT ON FUEL GAS SYSTEMS MARKET FOR COMBINED CYCLE POWER PLANTS PLAYERS


TABLE 26
NORTH AMERICA: REGULATORY BODIES, GOVERNMENT AGENCIES, AND OTHER ORGANIZATIONS


TABLE 27
ASIA PACIFIC: REGULATORY BODIES, GOVERNMENT AGENCIES, AND OTHER ORGANIZATIONS


TABLE 28
EUROPE: REGULATORY BODIES, GOVERNMENT AGENCIES, AND OTHER ORGANIZATIONS


TABLE 29
MIDDLE EAST & AFRICA: REGULATORY BODIES, GOVERNMENT AGENCIES, AND OTHER ORGANIZATIONS


TABLE 30
SOUTH AMERICA: REGULATORY BODIES, GOVERNMENT AGENCIES, AND OTHER ORGANIZATIONS


TABLE 31
GLOBAL INDUSTRY STANDARDS IN FUEL GAS SYSTEMS MARKET FOR COMBINED CYCLE POWER PLANTS


TABLE 32
CERTIFICATIONS, LABELING, AND ECO-STANDARDS IN FUEL GAS SYSTEMS MARKET FOR COMBINED CYCLE POWER PLANTS


TABLE 33
INFLUENCE OF STAKEHOLDERS ON BUYING PROCESS FOR END USERS (%)


TABLE 34
KEY BUYING CRITERIA FOR END USERS


TABLE 35
FUEL GAS SYSTEMS MARKET FOR COMBINED CYCLE POWER PLANTS: UNMET NEEDS OF KEY END USERS


TABLE 36
FUEL GAS SYSTEMS MARKET FOR COMBINED CYCLE POWER PLANTS, BY FUEL TYPE, 2023–2025 (USD MILLION)


TABLE 37
FUEL GAS SYSTEMS MARKET FOR COMBINED CYCLE POWER PLANTS, BY FUEL TYPE, 2026–2031 (USD MILLION)


TABLE 38
NATURAL GAS: FUEL GAS SYSTEMS MARKET FOR COMBINED CYCLE POWER PLANTS, BY REGION, 2023–2025 (USD MILLION)


TABLE 39
NATURAL GAS: FUEL GAS SYSTEMS MARKET FOR COMBINED CYCLE POWER PLANTS, BY REGION, 2026–2031 (USD MILLION)


TABLE 40
HYDROGEN BLENDS: FUEL GAS SYSTEMS MARKET FOR COMBINED CYCLE POWER PLANTS, BY REGION, 2023–2025 (USD MILLION)


TABLE 41
HYDROGEN BLENDS: FUEL GAS SYSTEMS MARKET FOR COMBINED CYCLE POWER PLANTS, BY REGION, 2026–2031 (USD MILLION)


TABLE 42
OTHER GASEOUS FUELS: FUEL GAS SYSTEMS MARKET FOR COMBINED CYCLE POWER PLANTS, BY REGION, 2023–2025 (USD MILLION)


TABLE 43
OTHER GASEOUS FUELS: FUEL GAS SYSTEMS MARKET FOR COMBINED CYCLE POWER PLANTS, BY REGION, 2026–2031 (USD MILLION)


TABLE 44
FUEL GAS SYSTEMS MARKET FOR COMBINED CYCLE POWER PLANTS, BY CAPACITY, 2023–2025 (USD MILLION)


TABLE 45
FUEL GAS SYSTEMS MARKET FOR COMBINED CYCLE POWER PLANTS, BY CAPACITY, 2026–2031 (USD MILLION)


TABLE 46
UP TO 300 MW: FUEL GAS SYSTEMS MARKET FOR COMBINED CYCLE POWER PLANTS, BY REGION, 2023–2025 (USD MILLION)


TABLE 47
UP TO 300 MW: FUEL GAS SYSTEMS MARKET FOR COMBINED CYCLE POWER PLANTS, BY REGION, 2026–2031 (USD MILLION)


TABLE 48
301–600 MW: FUEL GAS SYSTEMS MARKET FOR COMBINED CYCLE POWER PLANTS, BY REGION, 2023–2025 (USD MILLION)


TABLE 49
301–600 MW: FUEL GAS SYSTEMS MARKET FOR COMBINED CYCLE POWER PLANTS, BY REGION, 2026–2031 (USD MILLION)


TABLE 50
ABOVE 600 MW: FUEL GAS SYSTEMS MARKET FOR COMBINED CYCLE POWER PLANTS, BY REGION, 2023–2025 (USD MILLION)


TABLE 51
ABOVE 600 MW: FUEL GAS SYSTEMS MARKET FOR COMBINED CYCLE POWER PLANTS, BY REGION, 2026–2031 (USD MILLION)


TABLE 52
FUEL GAS SYSTEMS MARKET FOR COMBINED CYCLE POWER PLANTS, BY SUPPLIER TYPE, 2023–2025 (USD MILLION)


TABLE 53
FUEL GAS SYSTEMS MARKET FOR COMBINED CYCLE POWER PLANTS, BY SUPPLIER TYPE, 2026–2031 (USD MILLION)


TABLE 54
FUEL GAS SYSTEMS MARKET FOR COMBINED CYCLE POWER PLANTS, BY END USER, 2023–2025 (USD MILLION)


TABLE 55
FUEL GAS SYSTEMS MARKET FOR COMBINED CYCLE POWER PLANTS, BY END USER, 2026–2031 (USD MILLION)


TABLE 56
UTILITIES: FUEL GAS SYSTEMS MARKET FOR COMBINED CYCLE POWER PLANTS, BY REGION, 2023–2025 (USD MILLION)


TABLE 57
UTILITIES: FUEL GAS SYSTEMS MARKET FOR COMBINED CYCLE POWER PLANTS, BY REGION, 2026–2031 (USD MILLION)


TABLE 58
INDUSTRIAL (CAPTIVE): FUEL GAS SYSTEMS MARKET FOR COMBINED CYCLE POWER PLANTS, BY REGION, 2023–2025 (USD MILLION)


TABLE 59
INDUSTRIAL (CAPTIVE): FUEL GAS SYSTEMS MARKET FOR COMBINED CYCLE POWER PLANTS, BY REGION, 2026–2031 (USD MILLION)


TABLE 60
FUEL GAS SYSTEMS MARKET FOR COMBINED CYCLE POWER PLANTS, BY REGION, 2023–2025 (USD MILLION)


TABLE 61
FUEL GAS SYSTEMS MARKET FOR COMBINED CYCLE POWER PLANTS, BY REGION, 2026–2031 (USD MILLION)


TABLE 62
ASIA PACIFIC: FUEL GAS SYSTEMS MARKET FOR COMBINED CYCLE POWER PLANTS, BY COUNTRY, 2023–2025 (USD MILLION)


TABLE 63
ASIA PACIFIC: FUEL GAS SYSTEMS MARKET FOR COMBINED CYCLE POWER PLANTS, BY COUNTRY, 2026–2031 (USD MILLION)


TABLE 64
ASIA PACIFIC: FUEL GAS SYSTEMS MARKET FOR COMBINED CYCLE POWER PLANTS, BY FUEL TYPE, 2023–2025 (USD MILLION)


TABLE 65
ASIA PACIFIC: FUEL GAS SYSTEMS MARKET FOR COMBINED CYCLE POWER PLANTS, BY FUEL TYPE, 2026–2031 (USD MILLION)


TABLE 66
ASIA PACIFIC: FUEL GAS SYSTEMS MARKET FOR COMBINED CYCLE POWER PLANTS, BY CAPACITY, 2023–2025 (USD MILLION)


TABLE 67
ASIA PACIFIC: FUEL GAS SYSTEMS MARKET FOR COMBINED CYCLE POWER PLANTS, BY CAPACITY, 2026–2031 (USD MILLION)


TABLE 68
ASIA PACIFIC: FUEL GAS SYSTEMS MARKET FOR COMBINED CYCLE POWER PLANTS, BY END USER, 2023–2025 (USD MILLION)


TABLE 69
ASIA PACIFIC: FUEL GAS SYSTEMS MARKET FOR COMBINED CYCLE POWER PLANTS, BY END USER, 2026–2031 (USD MILLION)


TABLE 70
CHINA: FUEL GAS SYSTEMS MARKET FOR COMBINED CYCLE POWER PLANTS, BY END USER, 2023–2025 (USD MILLION)


TABLE 71
CHINA: FUEL GAS SYSTEMS MARKET FOR COMBINED CYCLE POWER PLANTS, BY END USER, 2026–2031 (USD MILLION)


TABLE 72
JAPAN: FUEL GAS SYSTEMS MARKET FOR COMBINED CYCLE POWER PLANTS, BY END USER, 2023–2025 (USD MILLION)


TABLE 73
JAPAN: FUEL GAS SYSTEMS MARKET FOR COMBINED CYCLE POWER PLANTS, BY END USER, 2026–2031 (USD MILLION)


TABLE 74
SOUTH KOREA: FUEL GAS SYSTEMS MARKET FOR COMBINED CYCLE POWER PLANTS, BY END USER, 2023–2025 (USD MILLION)


TABLE 75
SOUTH KOREA: FUEL GAS SYSTEMS MARKET FOR COMBINED CYCLE POWER PLANTS, BY END USER, 2026–2031 (USD MILLION)


TABLE 76
SOUTHEAST ASIA: FUEL GAS SYSTEMS MARKET FOR COMBINED CYCLE POWER PLANTS, BY END USER, 2023–2025 (USD MILLION)


TABLE 77
SOUTHEAST ASIA: FUEL GAS SYSTEMS MARKET FOR COMBINED CYCLE POWER PLANTS, BY END USER, 2026–2031 (USD MILLION)


TABLE 78
REST OF ASIA PACIFIC: FUEL GAS SYSTEMS MARKET FOR COMBINED CYCLE POWER PLANTS, BY END USER, 2023–2025 (USD MILLION)


TABLE 79
REST OF ASIA PACIFIC: FUEL GAS SYSTEMS MARKET FOR COMBINED CYCLE POWER PLANTS, BY END USER, 2026–2031 (USD MILLION)


TABLE 80
NORTH AMERICA: FUEL GAS SYSTEMS MARKET FOR COMBINED CYCLE POWER PLANTS, BY COUNTRY, 2023–2025 (USD MILLION)


TABLE 81
NORTH AMERICA: FUEL GAS SYSTEMS MARKET FOR COMBINED CYCLE POWER PLANTS, BY COUNTRY, 2026–2031 (USD MILLION)


TABLE 82
NORTH AMERICA: FUEL GAS SYSTEMS MARKET FOR COMBINED CYCLE POWER PLANTS, BY FUEL TYPE, 2023–2025 (USD MILLION)


TABLE 83
NORTH AMERICA: FUEL GAS SYSTEMS MARKET FOR COMBINED CYCLE POWER PLANTS, BY FUEL TYPE, 2026–2031 (USD MILLION)


TABLE 84
NORTH AMERICA: FUEL GAS SYSTEMS MARKET FOR COMBINED CYCLE POWER PLANTS, BY CAPACITY, 2023–2025 (USD MILLION)


TABLE 85
NORTH AMERICA: FUEL GAS SYSTEMS MARKET FOR COMBINED CYCLE POWER PLANTS, BY CAPACITY, 2026–2031 (USD MILLION)


TABLE 86
NORTH AMERICA: FUEL GAS SYSTEMS MARKET FOR COMBINED CYCLE POWER PLANTS, BY END USER, 2023–2025 (USD MILLION)


TABLE 87
NORTH AMERICA: FUEL GAS SYSTEMS MARKET FOR COMBINED CYCLE POWER PLANTS, BY END USER, 2026–2031 (USD MILLION)


TABLE 88
US: FUEL GAS SYSTEMS MARKET FOR COMBINED CYCLE POWER PLANTS, BY END USER, 2023–2025 (USD MILLION)


TABLE 89
US: FUEL GAS SYSTEMS MARKET FOR COMBINED CYCLE POWER PLANTS, BY END USER, 2026–2031 (USD MILLION)


TABLE 90
CANADA: FUEL GAS SYSTEMS MARKET FOR COMBINED CYCLE POWER PLANTS, BY END USER, 2023–2025 (USD MILLION)


TABLE 91
CANADA: FUEL GAS SYSTEMS MARKET FOR COMBINED CYCLE POWER PLANTS, BY END USER, 2026–2031 (USD MILLION)


TABLE 92
MEXICO: FUEL GAS SYSTEMS MARKET FOR COMBINED CYCLE POWER PLANTS, BY END USER, 2023–2025 (USD MILLION)


TABLE 93
MEXICO: FUEL GAS SYSTEMS MARKET FOR COMBINED CYCLE POWER PLANTS, BY END USER, 2026–2031 (USD MILLION)


TABLE 94
SOUTH AMERICA: FUEL GAS SYSTEMS MARKET FOR COMBINED CYCLE POWER PLANTS, BY COUNTRY, 2023–2025 (USD MILLION)


TABLE 95
SOUTH AMERICA: FUEL GAS SYSTEMS MARKET FOR COMBINED CYCLE POWER PLANTS, BY COUNTRY, 2026–2031 (USD MILLION)


TABLE 96
SOUTH AMERICA: FUEL GAS SYSTEMS MARKET FOR COMBINED CYCLE POWER PLANTS, BY FUEL TYPE, 2023–2025 (USD MILLION)


TABLE 97
SOUTH AMERICA: FUEL GAS SYSTEMS MARKET FOR COMBINED CYCLE POWER PLANTS, BY FUEL TYPE, 2026–2031 (USD MILLION)


TABLE 98
SOUTH AMERICA: FUEL GAS SYSTEMS MARKET FOR COMBINED CYCLE POWER PLANTS, BY CAPACITY, 2023–2025 (USD MILLION)


TABLE 99
SOUTH AMERICA: FUEL GAS SYSTEMS MARKET FOR COMBINED CYCLE POWER PLANTS, BY CAPACITY, 2026–2031 (USD MILLION)


TABLE 100
SOUTH AMERICA: FUEL GAS SYSTEMS MARKET FOR COMBINED CYCLE POWER PLANTS, BY END USER, 2023–2025 (USD MILLION)


TABLE 101
SOUTH AMERICA: FUEL GAS SYSTEMS MARKET FOR COMBINED CYCLE POWER PLANTS, BY END USER, 2026–2031 (USD MILLION)


TABLE 102
BRAZIL: FUEL GAS SYSTEMS MARKET FOR COMBINED CYCLE POWER PLANTS, BY END USER, 2023–2025 (USD MILLION)


TABLE 103
BRAZIL: FUEL GAS SYSTEMS MARKET FOR COMBINED CYCLE POWER PLANTS, BY END USER, 2026–2031 (USD MILLION)


TABLE 104
ARGENTINA: FUEL GAS SYSTEMS MARKET FOR COMBINED CYCLE POWER PLANTS, BY END USER, 2023–2025 (USD MILLION)


TABLE 105
ARGENTINA: FUEL GAS SYSTEMS MARKET FOR COMBINED CYCLE POWER PLANTS, BY END USER, 2026–2031 (USD MILLION)


TABLE 106
REST OF SOUTH AMERICA: FUEL GAS SYSTEMS MARKET FOR COMBINED CYCLE POWER PLANTS, BY END USER, 2023–2025 (USD MILLION)


TABLE 107
REST OF SOUTH AMERICA: FUEL GAS SYSTEMS MARKET FOR COMBINED CYCLE POWER PLANTS, BY END USER, 2026–2031 (USD MILLION)


TABLE 108
EUROPE: FUEL GAS SYSTEMS MARKET FOR COMBINED CYCLE POWER PLANTS, BY COUNTRY, 2023–2025 (USD MILLION)


TABLE 109
EUROPE: FUEL GAS SYSTEMS MARKET FOR COMBINED CYCLE POWER PLANTS, BY COUNTRY, 2026–2031 (USD MILLION)


TABLE 110
EUROPE: FUEL GAS SYSTEMS MARKET FOR COMBINED CYCLE POWER PLANTS, BY FUEL TYPE, 2023–2025 (USD MILLION)


TABLE 111
EUROPE: FUEL GAS SYSTEMS MARKET FOR COMBINED CYCLE POWER PLANTS, BY FUEL TYPE, 2026–2031 (USD MILLION)


TABLE 112
EUROPE: FUEL GAS SYSTEMS MARKET FOR COMBINED CYCLE POWER PLANTS, BY CAPACITY, 2023–2025 (USD MILLION)


TABLE 113
EUROPE: FUEL GAS SYSTEMS MARKET FOR COMBINED CYCLE POWER PLANTS, BY CAPACITY, 2026–2031 (USD MILLION)


TABLE 114
EUROPE: FUEL GAS SYSTEMS MARKET FOR COMBINED CYCLE POWER PLANTS, BY END USER, 2023–2025 (USD MILLION)


TABLE 115
EUROPE: FUEL GAS SYSTEMS MARKET FOR COMBINED CYCLE POWER PLANTS, BY END USER, 2026–2031 (USD MILLION)


TABLE 116
GERMANY: FUEL GAS SYSTEMS MARKET FOR COMBINED CYCLE POWER PLANTS, BY END USER, 2023–2025 (USD MILLION)


TABLE 117
GERMANY: FUEL GAS SYSTEMS MARKET FOR COMBINED CYCLE POWER PLANTS, BY END USER, 2026–2031 (USD MILLION)


TABLE 118
ITALY: FUEL GAS SYSTEMS MARKET FOR COMBINED CYCLE POWER PLANTS, BY END USER, 2023–2025 (USD MILLION)


TABLE 119
ITALY: FUEL GAS SYSTEMS MARKET FOR COMBINED CYCLE POWER PLANTS, BY END USER, 2026–2031 (USD MILLION)


TABLE 120
UK: FUEL GAS SYSTEMS MARKET FOR COMBINED CYCLE POWER PLANTS, BY END USER, 2023–2025 (USD MILLION)


TABLE 121
UK: FUEL GAS SYSTEMS MARKET FOR COMBINED CYCLE POWER PLANTS, BY END USER, 2026–2031 (USD MILLION)


TABLE 122
SPAIN: FUEL GAS SYSTEMS MARKET FOR COMBINED CYCLE POWER PLANTS, BY END USER, 2023–2025 (USD MILLION)


TABLE 123
SPAIN: FUEL GAS SYSTEMS MARKET FOR COMBINED CYCLE POWER PLANTS, BY END USER, 2026–2031 (USD MILLION)


TABLE 124
REST OF EUROPE: FUEL GAS SYSTEMS MARKET FOR COMBINED CYCLE POWER PLANTS, BY END USER, 2023–2025 (USD MILLION)


TABLE 125
REST OF EUROPE: FUEL GAS SYSTEMS MARKET FOR COMBINED CYCLE POWER PLANTS, BY END USER, 2026–2031 (USD MILLION)


TABLE 126
MIDDLE EAST & AFRICA: FUEL GAS SYSTEMS MARKET FOR COMBINED CYCLE POWER PLANTS, BY COUNTRY, 2023–2025 (USD MILLION)


TABLE 127
MIDDLE EAST & AFRICA: FUEL GAS SYSTEMS MARKET FOR COMBINED CYCLE POWER PLANTS, BY COUNTRY, 2026–2031 (USD MILLION)


TABLE 128
MIDDLE EAST & AFRICA: FUEL GAS SYSTEMS MARKET FOR COMBINED CYCLE POWER PLANTS, BY FUEL TYPE, 2023–2025 (USD MILLION)


TABLE 129
MIDDLE EAST & AFRICA: FUEL GAS SYSTEMS MARKET FOR COMBINED CYCLE POWER PLANTS, BY FUEL TYPE, 2026–2031 (USD MILLION)


TABLE 130
MIDDLE EAST & AFRICA: FUEL GAS SYSTEMS MARKET FOR COMBINED CYCLE POWER PLANTS, BY CAPACITY, 2023–2025 (USD MILLION)


TABLE 131
MIDDLE EAST & AFRICA: FUEL GAS SYSTEMS MARKET FOR COMBINED CYCLE POWER PLANTS, BY CAPACITY, 2026–2031 (USD MILLION)


TABLE 132
MIDDLE EAST & AFRICA: FUEL GAS SYSTEMS MARKET FOR COMBINED CYCLE POWER PLANTS, BY END USER, 2023–2025 (USD MILLION)


TABLE 133
MIDDLE EAST & AFRICA: FUEL GAS SYSTEMS MARKET FOR COMBINED CYCLE POWER PLANTS, BY END USER, 2026–2031 (USD MILLION)


TABLE 134
GCC: FUEL GAS SYSTEMS MARKET FOR COMBINED CYCLE POWER PLANTS, BY COUNTRY, 2023–2025 (USD MILLION)


TABLE 135
GCC: FUEL GAS SYSTEMS MARKET FOR COMBINED CYCLE POWER PLANTS, BY COUNTRY, 2026–2031 (USD MILLION)


TABLE 136
GCC: FUEL GAS SYSTEMS MARKET FOR COMBINED CYCLE POWER PLANTS, BY END USER, 2023–2025 (USD MILLION)


TABLE 137
GCC: FUEL GAS SYSTEMS MARKET FOR COMBINED CYCLE POWER PLANTS, BY END USER, 2026–2031 (USD MILLION)


TABLE 138
SAUDI ARABIA: FUEL GAS SYSTEMS MARKET FOR COMBINED CYCLE POWER PLANTS, BY END USER, 2023–2025 (USD MILLION)


TABLE 139
SAUDI ARABIA: FUEL GAS SYSTEMS MARKET FOR COMBINED CYCLE POWER PLANTS, BY END USER, 2026–2031 (USD MILLION)


TABLE 140
UAE: FUEL GAS SYSTEMS MARKET FOR COMBINED CYCLE POWER PLANTS, BY END USER, 2023–2025 (USD MILLION)


TABLE 141
UAE: FUEL GAS SYSTEMS MARKET FOR COMBINED CYCLE POWER PLANTS, BY END USER, 2026–2031 (USD MILLION)


TABLE 142
REST OF GCC: FUEL GAS SYSTEMS MARKET FOR COMBINED CYCLE POWER PLANTS, BY END USER, 2023–2025 (USD MILLION)


TABLE 143
REST OF GCC: FUEL GAS SYSTEMS MARKET FOR COMBINED CYCLE POWER PLANTS, BY END USER, 2026–2031 (USD MILLION)


TABLE 144
EGYPT: FUEL GAS SYSTEMS MARKET FOR COMBINED CYCLE POWER PLANTS, BY END USER, 2023–2025 (USD MILLION)


TABLE 145
EGYPT: FUEL GAS SYSTEMS MARKET FOR COMBINED CYCLE POWER PLANTS, BY END USER, 2026–2031 (USD MILLION)


TABLE 146
ALGERIA: FUEL GAS SYSTEMS MARKET FOR COMBINED CYCLE POWER PLANTS, BY END USER, 2023–2025 (USD MILLION)


TABLE 147
ALGERIA: FUEL GAS SYSTEMS MARKET FOR COMBINED CYCLE POWER PLANTS, BY END USER, 2026–2031 (USD MILLION)


TABLE 148
REST OF MEA: FUEL GAS SYSTEMS MARKET FOR COMBINED CYCLE POWER PLANTS, BY END USER, 2023–2025 (USD MILLION)


TABLE 149
REST OF MEA: FUEL GAS SYSTEMS MARKET FOR COMBINED CYCLE POWER PLANTS, BY VOLTAGE, 2026–2031 (USD MILLION)


TABLE 150
FUEL GAS SYSTEMS MARKET FOR COMBINED CYCLE POWER PLANTS: OVERVIEW OF STRATEGIES ADOPTED BY KEY PLAYERS, JANUARY 2023–JULY 2026


TABLE 151
FUEL GAS SYSTEMS MARKET FOR COMBINED CYCLE POWER PLANTS: DEGREE OF COMPETITION, 2025


TABLE 152
FUEL GAS SYSTEMS MARKET FOR COMBINED CYCLE POWER PLANTS: REGION FOOTPRINT


TABLE 153
FUEL GAS SYSTEMS MARKET FOR COMBINED CYCLE POWER PLANTS: FUEL TYPE FOOTPRINT


TABLE 154
FUEL GAS SYSTEMS MARKET FOR COMBINED CYCLE POWER PLANTS: CAPACITY FOOTPRINT


TABLE 155
FUEL GAS SYSTEMS MARKET FOR COMBINED CYCLE POWER PLANTS: END USER FOOTPRINT


TABLE 156
FUEL GAS SYSTEMS MARKET FOR COMBINED CYCLE POWER PLANTS: DETAILED LIST OF KEY STARTUPS/SMES


TABLE 157
FUEL GAS SYSTEMS MARKET FOR COMBINED CYCLE POWER PLANTS: COMPETITIVE BENCHMARKING OF KEY STARTUPS/SMES


TABLE 158
FUEL GAS SYSTEMS MARKET FOR COMBINED CYCLE POWER PLANTS: PRODUCT LAUNCHES, JANUARY 2023–JULY 2026


TABLE 159
FUEL GAS SYSTEMS MARKET FOR COMBINED CYCLE POWER PLANTS: DEALS, JANUARY 2023–JULY 2026


TABLE 160
FUEL GAS SYSTEMS MARKET FOR COMBINED CYCLE POWER PLANTS: EXPANSIONS, JANUARY 2023–JULY 2026


TABLE 161
KROHNE GROUP: COMPANY OVERVIEW


TABLE 162
KROHNE GROUP: PRODUCTS/SOLUTIONS/SERVICES OFFERED


TABLE 163
KROHNE GROUP: PRODUCT LAUNCHES


TABLE 164
KROHNE GROUP: DEALS


TABLE 165
KROHNE GROUP: EXPANSIONS


TABLE 166
EMERSON ELECTRIC CO.: COMPANY OVERVIEW


TABLE 167
EMERSON ELECTRIC CO.: PRODUCTS/SOLUTIONS/SERVICES OFFERED


TABLE 168
EMERSON ELECTRIC CO.: DEALS


TABLE 169
EMERSON ELECTRIC CO.: EXPANSIONS


TABLE 170
GAUMER PROCESS: COMPANY OVERVIEW


TABLE 171
GAUMER PROCESS: PRODUCTS/SOLUTIONS/SERVICES OFFERED


TABLE 172
MULTITEX GROUP: COMPANY OVERVIEW


TABLE 173
MULTITEX GROUP: PRODUCTS/SOLUTIONS/SERVICES OFFERED


TABLE 174
GENERON: COMPANY OVERVIEW


TABLE 175
GENERON: PRODUCTS/SOLUTIONS/SERVICES OFFERED


TABLE 176
INTEGRATED FLOW SOLUTIONS, INC.: COMPANY OVERVIEW


TABLE 177
INTEGRATED FLOW SOLUTIONS, INC.: PRODUCTS/SOLUTIONS/SERVICES OFFERED


TABLE 178
DELTA FILTERS & SEPARATORS PVT LTD: COMPANY OVERVIEW


TABLE 179
DELTA FILTERS & SEPARATORS PVT LTD: PRODUCTS/SOLUTIONS/SERVICES OFFERED


TABLE 180
ERGIL: COMPANY OVERVIEW


TABLE 181
ERGIL: PRODUCTS/SOLUTIONS/SERVICES OFFERED


TABLE 182
KILBURN: COMPANY OVERVIEW


TABLE 183
KILBURN: PRODUCTS/SOLUTIONS/SERVICES OFFERED


TABLE 184
KILBURN: DEALS


TABLE 185
KILBURN: EXPANSIONS


TABLE 186
EML MANUFACTURING, LLC: COMPANY OVERVIEW


TABLE 187
EML MANUFACTURING, LLC: PRODUCTS/SOLUTIONS/SERVICES OFFERED


TABLE 188
EN-FAB: COMPANY OVERVIEW


TABLE 189
EN-FAB: PRODUCTS/SOLUTIONS/SERVICES OFFERED


TABLE 190
EQUICOR TECHNOLOGIES PVT LTD: COMPANY OVERVIEW


TABLE 191
EQUICOR TECHNOLOGIES PVT LTD: PRODUCTS/SOLUTIONS/SERVICES OFFERED


TABLE 192
GROUP ATP S.P.A.: COMPANY OVERVIEW


TABLE 193
GROUP ATP S.P.A.: PRODUCTS/SOLUTIONS/SERVICES OFFERED


TABLE 194
SUNGOV ENGINEERING: COMPANY OVERVIEW


TABLE 195
SUNGOV ENGINEERING: PRODUCTS/SOLUTIONS/SERVICES OFFERED


TABLE 196
E&CO: COMPANY OVERVIEW


TABLE 197
E&CO: PRODUCTS/SOLUTIONS/SERVICES OFFERED


TABLE 198
E&CO: DEALS


TABLE 199
E&CO: EXPANSIONS


TABLE 200
DAIPEM INTEGRATED LIMITED: COMPANY OVERVIEW


TABLE 201
DAIPEM INTEGRATED LIMITED: PRODUCTS/SOLUTIONS/SERVICES OFFERED


TABLE 202
PETROGAS GAS SYSTEMS: COMPANY OVERVIEW


TABLE 203
PETROGAS GAS SYSTEMS: PRODUCTS/SOLUTIONS/SERVICES OFFERED


TABLE 204
CAMPITELLI S.R.L.: COMPANY OVERVIEW


TABLE 205
CAMPITELLI S.R.L.: PRODUCTS/SOLUTIONS/SERVICES OFFERED


TABLE 206
PROCESS SYSTEMS: COMPANY OVERVIEW


TABLE 207
PROCESS SYSTEMS: PRODUCTS/SOLUTIONS/SERVICES OFFERED


TABLE 208
PROCESS SYSTEMS: EXPANSIONS


TABLE 209
PETROGAS INDUSTRY - PGI INDUSTRIAL SYSTEMS MANUFACTURING AND ENGINEERING CO.: COMPANY OVERVIEW


TABLE 210
PETROGAS INDUSTRY - PGI INDUSTRIAL SYSTEMS MANUFACTURING AND ENGINEERING CO.: PRODUCTS/SOLUTIONS/SERVICES OFFERED


TABLE 211
PETRONASH BY ATN: COMPANY OVERVIEW


TABLE 212
PETRONASH BY ATN: PRODUCTS/SOLUTIONS/SERVICES OFFERED


TABLE 213
FISHER ENERGY: COMPANY OVERVIEW


TABLE 214
FISHER ENERGY: PRODUCTS/SOLUTIONS/SERVICES OFFERED


TABLE 215
BEST WIDE ENGINEERING (M) SDN. BHD: COMPANY OVERVIEW


TABLE 216
UNITBIRWELCO: COMPANY OVERVIEW


TABLE 217
HEAT GAS TECHNOLOGIES GMBH: COMPANY OVERVIEW


TABLE 218
BGR TECH: COMPANY OVERVIEW


TABLE 219
OVERVIEW OF KEY COMPONENT PROVIDERS


TABLE 220
MAJOR SECONDARY SOURCES


TABLE 221
DATA CAPTURED FROM PRIMARY SOURCES


TABLE 222
PRIMARY INTERVIEW PARTICIPANTS, BY COMPANY


TABLE 223
FUEL GAS SYSTEMS MARKET FOR COMBINED CYCLE POWER PLANTS: RISK ANALYSIS


LIST OF FIGURES


FIGURE 1
MARKETS COVERED AND REGIONAL SCOPE


FIGURE 2
FUEL GAS SYSTEMS MARKET FOR COMBINED CYCLE POWER PLANTS: DURATION CONSIDERED


FIGURE 3
FUEL GAS SYSTEMS MARKET SCENARIO FOR COMBINED CYCLE POWER PLANTS


FIGURE 4
FUEL GAS SYSTEMS MARKET FOR COMBINED CYCLE POWER PLANTS SIZE, 2023–2031


FIGURE 5
MAJOR STRATEGIES ADOPTED BY KEY PLAYERS IN FUEL GAS SYSTEMS MARKET FOR COMBINED CYCLE POWER PLANTS, 2023–2026


FIGURE 6
DISRUPTIONS INFLUENCING GROWTH OF FUEL GAS SYSTEMS MARKET FOR COMBINED CYCLE POWER PLANTS


FIGURE 7
HIGH-GROWTH SEGMENTS IN FUEL GAS SYSTEMS MARKET FOR COMBINED CYCLE POWER PLANTS, 2026–2031


FIGURE 8
ASIA PACIFIC TO REGISTER HIGHEST CAGR DURING FORECAST PERIOD


FIGURE 9
EXPANDING CCGT CAPACITY AND RISING REQUIREMENT FOR RELIABLE FUEL GAS MANAGEMENT TO SUPPORT MARKET GROWTH


FIGURE 10
ABOVE 600 MW SEGMENT AND ASIA PACIFIC DOMINATED FUEL GAS SYSTEMS MARKET FOR COMBINED CYCLE POWER PLANTS IN 2025


FIGURE 11
INTEGRATED-SKID SUPPLIERS TO LEAD FUEL GAS SYSTEMS MARKET FOR COMBINED CYCLE POWER PLANTS IN 2031


FIGURE 12
NATURAL GAS SEGMENT TO EXHIBIT LARGEST MARKET SHARE IN 2031


FIGURE 13
ABOVE 600 MW SEGMENT TO HOLD LARGEST MARKET SHARE IN 2031


FIGURE 14
UTILITIES SEGMENT TO HOLD MAJORITY OF MARKET SHARE IN 2031


FIGURE 15
ASIA PACIFIC TO HOLD LARGEST SHARE OF FUEL GAS SYSTEMS MARKET FOR COMBINED CYCLE POWER PLANTS IN 2031


FIGURE 16
DRIVERS, RESTRAINTS, OPPORTUNITIES, AND CHALLENGES


FIGURE 17
PLANNED US NATURAL GAS COMBINED CYCLE CAPACITY BY INITIAL OPERATING YEAR, 2025–2028


FIGURE 18
US NATURAL GAS COMBINED CYCLE CAPACITY BY INITIAL OPERATING YEAR, 1990–2028


FIGURE 19
YEAR-ON-YEAR CHANGE IN NATURAL GAS DEMAND, BY REGION, 2020–2026


FIGURE 20
PORTER’S FIVE FORCES ANALYSIS


FIGURE 21
SUPPLY CHAIN ANALYSIS: FUEL GAS SYSTEMS FOR COMBINED CYCLE POWER PLANTS


FIGURE 22
FUEL GAS SYSTEMS FOR COMBINED CYCLE POWER PLANTS ECOSYSTEM MAPPING


FIGURE 23
IMPORT SCENARIO FOR HS CODE 842139-COMPLIANT PRODUCTS IN TOP 5 COUNTRIES, 2021–2025


FIGURE 24
EXPORT SCENARIO FOR HS CODE 842139-COMPLIANT PRODUCTS IN TOP 5 COUNTRIES, 2021–2025


FIGURE 25
TRENDS/DISRUPTIONS INFLUENCING CUSTOMER BUSINESS


FIGURE 26
INVESTMENT AND FUNDING SCENARIO, 2023 TO 2025


FIGURE 27
PATENTS GRANTED AND APPLIED, 2016–2025


FIGURE 28
FUEL GAS SYSTEMS MARKET FOR COMBINED CYCLE POWER PLANTS: FUTURE APPLICATIONS


FIGURE 29
FUEL GAS SYSTEMS MARKET FOR COMBINED CYCLE POWER PLANTS: DECISION-MAKING FACTORS


FIGURE 30
INFLUENCE OF STAKEHOLDERS ON BUYING PROCESS FOR END USERS


FIGURE 31
KEY BUYING CRITERIA FOR END USERS


FIGURE 32
ADOPTION BARRIERS AND INTERNAL CHALLENGES IN FUEL GAS SYSTEMS MARKET FOR COMBINED CYCLE POWER PLANTS


FIGURE 33
SHARE OF FUEL GAS SYSTEMS MARKET FOR COMBINED CYCLE POWER PLANTS, BY FUEL TYPE, 2025


FIGURE 34
SHARE OF FUEL GAS SYSTEMS MARKET FOR COMBINED CYCLE POWER PLANTS, BY CAPACITY, 2025


FIGURE 35
SHARE OF FUEL GAS SYSTEMS MARKET FOR COMBINED CYCLE POWER PLANTS, BY SUPPLIER TYPE, 2025


FIGURE 36
SHARE OF FUEL GAS SYSTEMS MARKET FOR COMBINED CYCLE POWER PLANTS, BY END USER, 2025


FIGURE 37
ASIA PACIFIC TO REGISTER HIGHEST CAGR FROM 2026 TO 2031


FIGURE 38
ASIA PACIFIC: FUEL GAS SYSTEMS MARKET FOR COMBINED CYCLE POWER PLANTS


FIGURE 39
NORTH AMERICA: FUEL GAS SYSTEMS MARKET FOR COMBINED CYCLE POWER PLANTS


FIGURE 40
INDUSTRY CONCENTRATION, 2025


FIGURE 41
FUEL GAS SYSTEMS MARKET FOR COMBINED CYCLE POWER PLANTS: COMPANY EVALUATION MATRIX (KEY PLAYERS), 2025


FIGURE 42
FUEL GAS SYSTEMS MARKET FOR COMBINED CYCLE POWER PLANTS: COMPANY FOOTPRINT


FIGURE 43
FUEL GAS SYSTEMS MARKET FOR COMBINED CYCLE POWER PLANTS: COMPANY EVALUATION MATRIX (STARTUPS/SMES), 2025


FIGURE 44
COMPANY VALUATION


FIGURE 45
FINANCIAL METRICS (EV/EBITDA)


FIGURE 46
BRAND COMPARISON OF KEY VENDORS


FIGURE 47
EMERSON ELECTRIC CO.: COMPANY SNAPSHOT


FIGURE 48
KILBURN: COMPANY SNAPSHOT


FIGURE 49
FUEL GAS SYSTEMS MARKET FOR COMBINED CYCLE POWER PLANTS: RESEARCH DESIGN


FIGURE 50
DATA CAPTURED FROM SECONDARY SOURCES


FIGURE 51
CORE FINDINGS FROM INDUSTRY EXPERTS


FIGURE 52
BREAKDOWN OF PRIMARY INTERVIEWS: BY COMPANY TYPE, DESIGNATION, AND REGION


FIGURE 53
FUEL GAS SYSTEMS MARKET FOR COMBINED CYCLE POWER PLANTS: BOTTOM-UP APPROACH


FIGURE 54
FUEL GAS SYSTEMS MARKET FOR COMBINED CYCLE POWER PLANTS: TOP-DOWN APPROACH


FIGURE 55
FUEL GAS SYSTEMS MARKET FOR COMBINED CYCLE POWER PLANTS: DEMAND-SIDE ANALYSIS


FIGURE 56
KEY STEPS CONSIDERED TO ASSESS SUPPLY OF FUEL GAS SYSTEMS


FIGURE 57
FUEL GAS SYSTEMS MARKET FOR COMBINED CYCLE POWER PLANTS: SUPPLY-SIDE ANALYSIS


FIGURE 58
FUEL GAS SYSTEMS MARKET FOR COMBINED CYCLE POWER PLANTS: DATA TRIANGULATION


FIGURE 59
FUEL GAS SYSTEMS MARKET FOR COMBINED CYCLE POWER PLANTS: FACTOR ANALYSIS


FIGURE 60
FUEL GAS SYSTEMS MARKET FOR COMBINED CYCLE POWER PLANTS: RESEARCH ASSUMPTIONS AND LIMITATIONS


FIGURE 61
FUEL GAS SYSTEMS MARKET FOR COMBINED CYCLE POWER PLANTS: INSIGHTS FROM INDUSTRY EXPERTS


Methodology

The research process for this technical, market-oriented, and commercial study of the fuel gas system market for combined-cycle power plants involved systematic collection, validation, and analysis of information related to combined-cycle power plant projects, including fuel type, capacity, end users, and project developments. Extensive secondary research was conducted using annual reports, investor presentations, technical papers, regulatory publications, industry databases, company websites, product catalogs, and financial reports to identify key market participants, technology trends, market developments, and competitive strategies. The findings were further validated through primary interviews with executives from skid manufacturers, component manufacturers, EPC companies, utilities, and industry experts to assess market estimates, product adoption, pricing trends, customer requirements, and competitive positioning. Key market players and their market positions were established through a combination of secondary research and primary research involving senior executives, business development managers, product specialists, and technical experts across the fuel gas system ecosystem.

Secondary Research

In the secondary research process, various sources were referred to for identifying and collecting information relevant to the study. Secondary sources included annual reports, investor presentations, press releases, company websites, technical papers, industry journals, regulatory publications, product catalogs, and recognized market databases. Publications and datasets from organizations such as the International Energy Agency (IEA), Global Energy Monitor (GEM), Eurostat, International Renewable Energy Association (IRENA), and Energy Institute – Statistical Review of World Energy were reviewed to understand developments in combined- cycle power generation plants, investments in the power sector, and natural gas or LNG developments. Secondary research was primarily conducted to obtain information on the fuel gas system value chain, key market participants, product developments, technology trends, and end-user demand, manufacturing capabilities, distribution networks, pricing trends, and regional market developments.

Primary Research

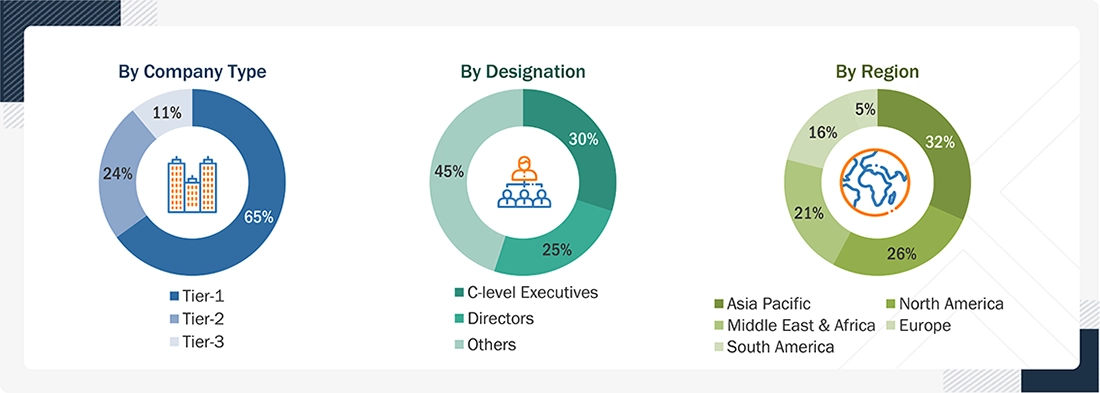
During the primary research phase, fuel gas skid providers, component manufacturers, utilities, EPC companies, and industry experts were interviewed to obtain qualitative and quantitative insights into the fuel gas system market for combined-cycle power plants. Interviews were conducted to validate market estimates, product adoption, pricing trends, regional demand, competitive positioning, customer requirements, and technology developments. Primary interviews also helped assess demand across different fuel types, end-user trends, and different plant capacities. The findings were validated against company disclosures, industry statistics, regulatory publications, technical sources, and market data to refine market estimates, segment shares, regional forecasts, and competitive assessments.

Fuel Gas Systems Market
 Size, and Share

Note: Others include sales managers, engineers, and regional managers.
Tier 1 Company: Revenue > USD 5 billion, Tier 2 Company: Revenue between USD 1 billion and USD 5 billion, and Tier 3 Company: Revenue < USD 1 billion.

To know about the assumptions considered for the study, download the pdf brochure

Market Size Estimation

Both top-down and bottom-up approaches have been used to estimate and validate the size of the fuel gas system market for combined-cycle power plants and its dependent submarkets. The key players in the market were identified through secondary research, and their market shares in the respective segments were obtained through both primary and secondary research. The research methodology includes the study of annual and financial reports of top market players and interviews with industry experts, such as chief executive officers, vice presidents, directors, sales managers, product managers, and marketing executives, for key quantitative and qualitative insights related to the fuel gas system market for combined-cycle power plants.
Bottom-up Approach

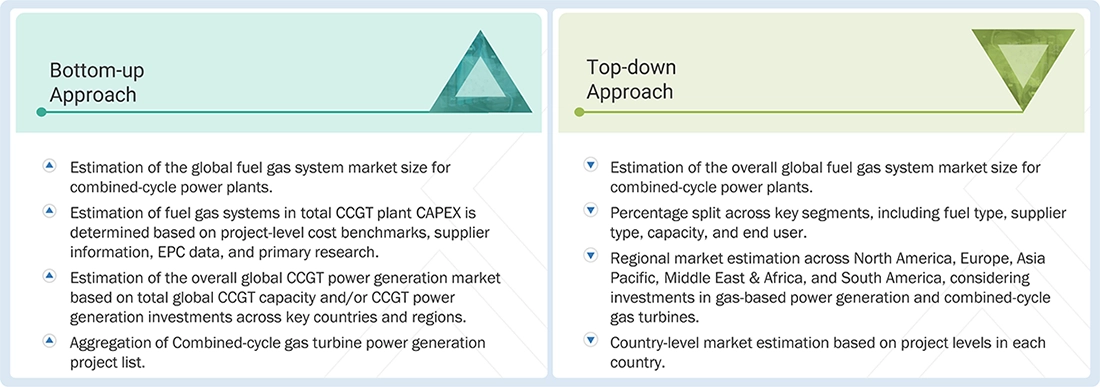
  • The global combined-cycle power plants market is estimated based on total combined-cycle power plant capacity and/or combined-cycle power generation investments across key countries and regions.
  • The relevant combined-cycle power plants market is defined and segmented based on operating, under-construction, and planned capacity, considering project status, commissioning timelines, fuel type, and turbine configuration.
  • The fuel gas system share of total combined-cycle power plants CAPEX is determined based on project-level cost benchmarks, EPC data, supplier information, and primary research.
  • The global combined-cycle power plants market value is multiplied by the estimated fuel gas system CAPEX share to derive the total addressable global fuel gas system market.

Top-down Approach

  • Estimating the overall global fuel gas system market by analyzing investments in the power generation industry, combined-cycle power plant capacity, among other factors.
  • Allocating the market across fuel types, supplier types, capacity, and end users based on adoption patterns, industry trends, and company-level data.
  • Distributing market estimates across North America, Europe, Asia Pacific, Middle East & Africa, and South America based on combined-cycle gas turbine capacity additions and investments in gas -based power generation.
  • Further splitting regional markets into country-level markets based on combined-cycle power plant capacity additions.
  • Validating the final market estimates through primary interviews with fuel gas system manufacturers, component providers, EPC companies, utilities, and industry experts to validate regional demand trends, product adoption, pricing, and end-user requirements, followed by data triangulation to ensure consistency and accuracy. 

Global Fuel Gas System for Combined-Cycle Power Plants Market Size: Bottom-up Approach and Top-down Approach
Fuel Gas Systems Market Top Down and Bottom Up Approach

Data Triangulation

The process of determining the overall market size involved the methodologies described earlier, followed by segmenting the market into multiple segments and subsegments. To finalize the comprehensive market analysis and obtain precise statistics for each market segment and subsegment, we applied data triangulation and market breakdown procedures where appropriate. Data triangulation was accomplished by examining factors and trends from both the demand and supply sides of the fuel gas system ecosystem, including investments in different sources of power generation, combined-cycle power plant capacity additions, product adoption, pricing trends, replacement demand, and regional market dynamics.

Market Definition

Fuel gas systems for combined-cycle gas turbine (CCGT) power plants are engineered systems that receive natural gas at the power plant fuel-gas inlet, condition and regulate it to the required pressure, temperature, cleanliness, and flow specifications, and safely deliver it to the gas turbine fuel system for combustion. The systems typically comprise gas separation and filtration, pressure regulation or reduction, gas heating/preheating and dew-point control, gas-quality analysis, safety and isolation devices, and condensate handling. Depending on plant configuration and gas supply conditions, the system may also incorporate fuel-gas compression or pressure-boosting equipment.

The study covers fuel gas systems across different fuel types, including natural gas and blended hydrogen, and end users, including utilities and industrial (captive) customers. The market covers North America, Europe, Asia Pacific, the Middle East & Africa, and South America.  

Key Stakeholders

  • Fuel Gas System Manufacturers and Skid Package Suppliers
  • Gas Turbine and Combined-Cycle Power Plant OEMs
  • EPC Contractors and Power Plant Engineering Companies
  • Natural Gas Suppliers and Pipeline Operators
  • Gas Filtration, Heating, and Pressure Regulation Equipment Manufacturers
  • Gas Valves, Metering, and Instrumentation Manufacturers
  • Power Plant Owners and Utility Operators
  • Industrial Automation and Control System Providers
  • Power Plant Operation and Maintenance Service Providers
  • Energy Regulators and Gas Safety Authorities

Report Objectives

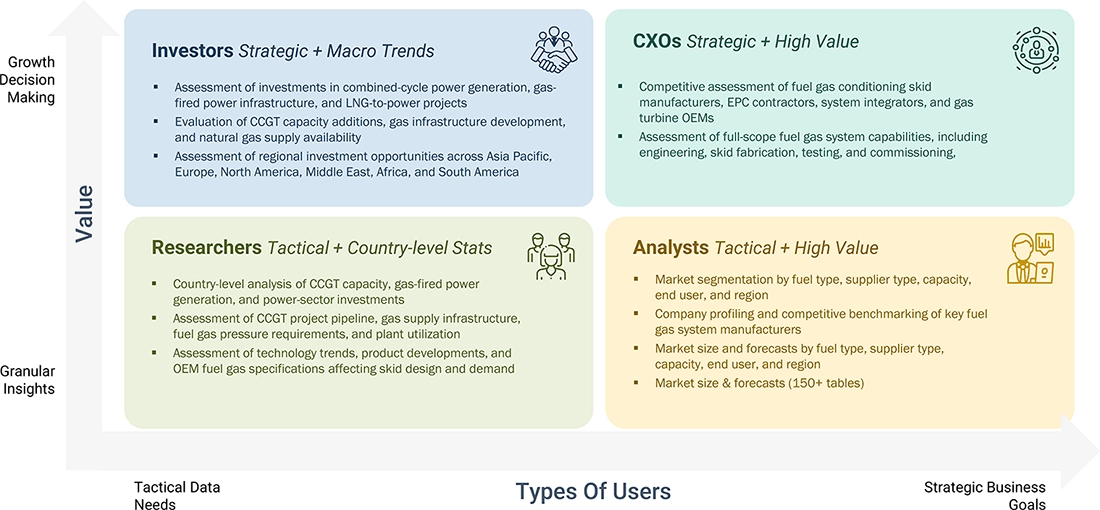
  • To describe, segment, and forecast the fuel gas systems market for combined cycle power plants, by fuel type, supplier type, capacity, end user, and region, in terms of value
  • To forecast the market size across five key regions: North America, Europe, Asia Pacific, South America, and the Middle East & Africa, along with country-level analysis, in terms of value
  • To provide detailed information about the key drivers, restraints, opportunities, and industry-specific challenges influencing the growth of the fuel gas systems market for combined-cycle power plants
  • To provide supply chain analysis, trends/disruptions impacting customer business, market maps, ecosystem analysis, sustainability and regulatory landscape, pricing analysis, patent analysis, case study analysis, technology analysis, key conferences and events, Porter’s Five Forces analysis, macroeconomic outlook, customer landscape & buyer behavior, regulatory analysis, and AI/Gen AI impact on the market
  • To analyze opportunities for stakeholders in the fuel gas systems market for combined-cycle power plants and draw a competitive landscape for market player
  • To benchmark players within the market using the company evaluation matrix, which analyzes market players based on several parameters within the broad categories of business and product strategies

Available customizations:

With the given market data, MarketsandMarkets offers customizations based on the company’s specific needs. The following customization options are available for the report:

PRODUCT ANALYSIS

  • Product Matrix, which provides a detailed comparison of the product portfolio of each company

COMPANY INFORMATION

  • Detailed analyses and profiling of additional market players (up to 5)

 

Personalize This Research

  • Triangulate with your Own Data
  • Get Data as per your Format and Definition
  • Gain a Deeper Dive on a Specific Application, Geography, Customer or Competitor
  • Any level of Personalization
Request A Free Customisation

Let Us Help You

  • What are the Known and Unknown Adjacencies Impacting the Fuel Gas System Market
  • What will your New Revenue Sources be?
  • Who will be your Top Customer; what will make them switch?
  • Defend your Market Share or Win Competitors
  • Get a Scorecard for Target Partners
Customized Workshop Request

Custom Market Research Services

We Will Customise The Research For You, In Case The Report Listed Above Does Not Meet With Your Requirements

Get 10% Free Customisation

TESTIMONIALS

Growth opportunities and latent adjacency in Fuel Gas System Market

DMCA.com Protection Status
popup img