Gas Engine Market

Gas Engine Market by Fuel Type (Natural Gas, Special Gas), Power Output (0.5-1 MW, 1.1-2 MW, 2.1-5 MW, 5.1-15 MW, Above 15 MW), Application (Power Generation, Cogeneration, Mechanical Drive), End-Use Industry and Region - Global Forecast to 2029

Report Code: EP 4541 Mar, 2024, by marketsandmarkets.com

[282 Pages Report] The global gas engine market in terms of revenue was estimated to be worth $5.1 billion in 2024 and is projected to reach $6.3 billion by 2029, growing at a CAGR of 4.5% from 2024 to 2029. Additionally, there are deliberate investments in infrastructure and expansion initiatives aimed at meeting the growing demand for gas engines across sectors such as utilities, manufacturing, and transportation. Furthermore, collaborations between industry players and governmental bodies are driving investments in infrastructure development and regulatory frameworks conducive to the market's growth. Given the favorable market conditions and increasing investment flow, the gas engine market is poised for continued expansion in the foreseeable future, offering lucrative opportunities for stakeholders across the value chain.

Gas Engine Market

To know about the assumptions considered for the study, Request for Free Sample Report

Gas Engine Market

To know about the assumptions considered for the study, download the pdf brochure

Gas Engine Market Dynamics

Driver: Advance Gas Engine Technology.

Continuous advancements in gas engine technology play a pivotal role in enhancing their attractiveness in the market. These ongoing innovations focus on improving various aspects of gas engine design, such as fuel efficiency and emissions reduction, ultimately contributing to their sustainability and economic viability. One significant area of advancement is in fuel efficiency. Engineers continually refine combustion processes and optimize engine designs to achieve higher levels of fuel efficiency. By extracting more energy from each unit of fuel consumed, modern gas engines can generate greater power output while consuming fewer resources, thereby improving overall energy efficiency. This not only reduces operational costs for users but also minimizes the environmental footprint associated with fuel consumption. Another key aspect of gas engine technology advancement is the reduction of emissions. Through the integration of cleaner burning technologies and advanced emission control systems, gas engines can significantly lower their environmental impact. These advancements target the reduction of pollutants such as nitrogen oxides (NOx), sulfur oxides (SOx), and particulate matter (PM), which are harmful to both human health and the environment. By emitting fewer pollutants into the atmosphere, modern gas engines help mitigate air quality issues and contribute to overall environmental sustainability.

Restraints: Managing Fluctuating Gas Prices.

The management of fluctuating fuel prices, particularly concerning natural gas, presents a critical consideration for businesses and investors contemplating the adoption of gas engines. The volatility in natural gas prices can significantly impact the operational costs and economic viability of gas engines compared to alternative fuel sources, thereby posing challenges for potential adopters. The uncertainty surrounding natural gas prices can introduce unpredictability into operational budgets and financial projections for businesses utilizing gas engines. Fluctuations in fuel costs directly affect the profitability and competitiveness of gas engine-based power generation operations, as higher fuel prices can increase operational expenses and erode profit margins. Additionally, the uncertainty associated with future price movements can introduce risk and complexity into investment decisions, deterring potential investors from committing to gas engine projects. Moreover, the economic viability of gas engines relative to other fuel sources is closely linked to the relative price dynamics of natural gas compared to alternative fuels such as coal or renewable energy sources. Significant fluctuations in natural gas prices can alter the cost competitiveness of gas engines compared to alternative options, influencing the overall attractiveness of gas engine adoption for power generation applications. To address the challenge of managing fluctuating fuel prices, businesses and investors may employ various strategies. These may include implementing hedging mechanisms to mitigate price risk, diversifying fuel procurement sources to reduce dependence on volatile markets, and investing in technologies or operational practices that improve fuel efficiency and reduce consumption. Additionally, long-term contracts or agreements with stable pricing structures may provide a degree of certainty and predictability in fuel costs, enhancing the economic stability of gas engine operations.

Opportunities:  Navigating the Evolving Landscape of Coal, Gas, and Nuclear.

The power generation landscape is experiencing a notable shift as coal, gas, and nuclear technologies contend with evolving market dynamics and regulatory pressures. Coal, historically a major player, is facing diminishing dominance due to environmental concerns and stringent regulations. Despite its significant share of global electricity generation, coal combustion's high CO2 emissions contribute to climate change and air pollution, prompting many countries to phase out coal entirely by 2030. Nuclear power offers a relatively clean energy source with minimal greenhouse gas emissions, ideal for providing reliable baseload power. However, high upfront costs and public perception issues surrounding safety hinder widespread adoption. Gas-fired power plants emerge as a cleaner alternative to coal, boasting lower emissions and operational flexibility. Yet, challenges such as fossil fuel reliance and price volatility persist, necessitating investment in infrastructure expansion. Market trends indicate a notable shift from coal to gas, driven by environmental concerns and regulations. Additionally, the rise of renewables poses a long-term challenge to both coal and gas dominance in the power sector. Efforts towards cleaner and more sustainable solutions include advancements in advanced nuclear technologies, carbon capture and storage, and energy storage solutions to integrate renewable energy sources into the grid effectively. As per the International Energy Agency (IEA) report for 2023, renewable energy sources such as solar and wind are witnessing significant expansion, contributing to nearly a quarter (23%) of global electricity generation in 2022. This surge poses a notable long-term challenge to the dominance of both coal and gas in the power sector.

Challenges: Addressing Infrastructural shortcomings

Developed countries such as the US, the EU, and Russia have long-established infrastructure for natural gas import and export, facilitating efficient utilization of this resource. However, nearly 80% of the world's total proven natural gas reserves are concentrated in just ten countries, including the US, Russia, Qatar, Norway, and Australia. This concentration of reserves presents challenges for developing and underdeveloped countries, where gas reserves are limited, resulting in a significantly low share of gas in their total energy production. Furthermore, many developing countries lack the necessary infrastructure for importing gas from other nations, further exacerbating the disparity in access to this resource. Without adequate infrastructure for gas importation, these countries face barriers to diversifying their energy mix and leveraging natural gas for power generation and industrial applications. While developing countries are beginning to embrace combined heat and power (CHP) technology, the full potential of this approach has yet to be realized. CHP offers the opportunity to enhance energy efficiency by capturing waste heat from electricity generation for use in heating and cooling applications. However, the lack of proper infrastructure, including distribution networks and supporting facilities, hinders the widespread adoption and optimization of CHP systems in many regions.

The gas engine market Ecosystem

The gas engine market is characterized by the presence of well-established, financially stable companies with significant experience in producing gas engines and related components. These companies are well-established in the market and offer a diverse range of products. Utilizing cutting-edge technologies, they uphold vast international networks for sales and marketing. Some of the leading companies in this market are Caterpillar (US), Rolls-Royce Holdings (UK), Wartsila (Finland), Siemens Energy (Germany), and Cummins (US).

Gas Engine Market Ecosystem

Special gas segment, by Fuel type, to grow at highest CAGR from 2024 to 2029.

The special gas segment, categorized by fuel type, is anticipated to experience the highest compound annual growth rate (CAGR) from 2024 to 2029 due to several key factors driving its expansion. One significant factor is the increasing adoption of alternative and renewable fuels, such as biogas, syngas, and hydrogen, within the gas engine market. These special gases offer distinct environmental advantages, including lower emissions and reduced dependency on traditional fossil fuels, aligning with global sustainability goals. Additionally, advancements in gas engine technology have enabled enhanced compatibility with a broader range of fuel types, facilitating the utilization of special gases for power generation and industrial applications. Moreover, supportive government policies and incentives aimed at promoting the use of renewable energy sources further bolster the growth of the special gas segment. As industries and utilities seek to reduce their carbon footprint and enhance energy efficiency, the demand for gas engines capable of utilizing special gases is expected to surge, driving significant market growth within this segment.

1.1-2 MW segment, by power output, to emerge as largest segment of gas engine market.

The 1.1-2 MW segment, categorized by power output, is anticipated to emerge as the largest segment of the gas engine market due to several compelling reasons driving its dominance. Firstly, gas engines within this power range offer a balance between power capacity and operational flexibility, making them suitable for a wide range of applications across various industries. These engines provide sufficient power output to meet the demands of medium-sized facilities and operations, including manufacturing plants, commercial buildings, and district heating systems. Additionally, advancements in gas engine technology have enhanced the efficiency, reliability, and performance of engines within this power range, making them increasingly attractive to end-users seeking cost-effective and sustainable power solutions. Moreover, the versatility of gas engines in the 1.1-2 MW range allows for flexible deployment in both standalone and combined heat and power (CHP) applications, further driving their market dominance. Furthermore, favorable economics, including lower installation and operational costs compared to larger capacity engines, contribute to the popularity of 1.1-2 MW gas engines among end-users. With their proven performance, versatility, and cost-effectiveness, gas engines in the 1.1-2 MW segment are poised to lead the market, catering to the diverse needs of industries worldwide.

Utilities segment, by end-use industry, to have highest market share from 2024 to 2029.

The utilities segment, categorized by end-use industry, is expected to hold the highest market share from 2024 to 2029 due to several driving factors contributing to its dominance. Utilities, including electricity, gas, and water providers, are increasingly turning to gas engines for power generation and cogeneration applications to meet the escalating energy demands of modern societies. Gas engines offer utilities a reliable and efficient solution for electricity generation, enabling them to balance supply and demand while enhancing grid stability. Furthermore, the versatility of gas engines allows utilities to deploy them in various applications, such as peak shaving, grid support, and distributed energy generation, contributing to their widespread adoption across the sector. Additionally, the growing focus on renewable and cleaner energy sources is driving utilities to transition from traditional fossil fuel-based power generation to gas engines, which offer lower emissions and greater fuel flexibility. Moreover, supportive government policies and incentives aimed at promoting renewable energy and improving energy efficiency further accelerate the adoption of gas engines by utilities. With their proven reliability, efficiency, and environmental benefits, gas engines are poised to play a pivotal role in powering the utilities sector, driving significant market share within the segment during the forecast period.

Asia Pacific to account for largest market size during forecast period.

Asia Pacific is set to dominate the oil-immersed power transformer market, holding the largest market size throughout the forecast period. This regional prominence can be attributed to a confluence of factors driving substantial demand for reliable power infrastructure. The rapid industrialization, urbanization, and infrastructural development initiatives in countries such as China, India, and Southeast Asian nations are fostering a significant increase in electricity consumption. As a response to this surge in demand, there is a heightened need for robust power transmission and distribution networks, wherein oil-immersed power transformers play a crucial role. Additionally, governmental investments in upgrading and expanding power grids, coupled with a growing focus on renewable energy integration, contribute to the escalating demand for these transformers. Asia Pacific's status as the largest market reflects not only its current energy requirements but also its strategic initiatives toward building resilient and modern power infrastructure to meet the future needs of a dynamic and burgeoning economy.

North American Gas Engine Market Size, and Share

Key Market Players

Caterpillar (USA), Wartsila (Finland), Rolls-Royce Holdings (UK), Cummins (USA), Volkswagen (Germany), Siemens Energy (Germany), Mitsubishi Heavy Industries (Japan), INNIO (Austria), Kawasaki Heavy Industries (Japan).

Get online access to the report on the World's First Market Intelligence Cloud

  • Easy to Download Historical Data & Forecast Numbers
  • Company Analysis Dashboard for high growth potential opportunities
  • Research Analyst Access for customization & queries
  • Competitor Analysis with Interactive dashboard
  • Latest News, Updates & Trend analysis
Request Sample

Scope of the Report

Report Metric

Details

Market Size available for years

2020–2029

Base year considered

2023

Forecast period

2024–2029

Forecast units

Value (USD Million)

Segments covered

By Fuel Type, By Power Output, By Application, and By End User

Geographies covered

Asia Pacific, North America, Europe, Middle East and Africa, and South America 

Companies covered

Caterpillar (USA), Wartsila (Finland), Rolls-Royce Holdings (UK), Cummins (USA), Volkswagen (Germany), Siemens Energy (Germany), Mitsubishi Heavy Industries (Japan), INNIO (Austria), Kawasaki Heavy Industries (Japan), Ningbo CSI Power & Machinery Group Co., Ltd. (China), IHI Power Systems (Japan), JFE Engineering Corporation (Japan), Liebherr (Switzerland), Hyundai Heavy Industries (South Korea), Jinan Lvneng Power Machinery Equipment Co., Ltd. (China), R Schmitt Enertec (Germany), CNPC Jichai Power Complex (China), Fairbanks Morse (USA), Googol Engine Tech (China), Baudouin (France), Kohler Co. (USA), Deutz AG (Germany), Achates Power (USA), Kubota (Japan), Yanmar (Japan).

The gas engines market is classified in this research report based on fuel type, power output, application, end user, and region.

Based on fuel type, the gas engine market has been segmented as follows:
  • Natural Gas
  • Special Gas
  • Others
Based on power output, the market has been segmented as follows:
  • 0.5-1 MW
  • 1.1-2 MW
  • 2.1-5 MW
  • 5.1-15 MW
  • Above 15 MW
Based on application, the gas engines market has been segmented as follows:
  • Power Generation
  • Co-generation
  • Mechanical Drive
  • Others
Based on End-use industry, the gas engine market has been segmented as follows:
  • Utilities
  • Manufacturing
  • Oil & Gas
  • Marine
  • Others
Based on regions, the market has been segmented as follows:
  • North America
  • Asia Pacific
  • South America
  • Europe
  • Middle East and Africa

Recent Developments

  • In February 2023, Wärtsilä and Ørsted sign an agreement to deliver a 290 MW balancing power plant in Denmark. This agreement involves supplying and installing 10 Wärtsilä 31SG engines for a new natural gas-fired balancing plant that will support the integration of renewable energy sources into the Danish power grid.
  • In December 2022, Siemens Energy acquired a majority stake in ELIN, a leading provider of gas engines for distributed power generation. This acquisition strengthens Siemens Energy's position in the distributed power generation market, particularly for biogas and renewable energy applications.
  • In July 2022, Caterpillar and Baker Hughes form a strategic alliance for clean energy solutions. This alliance focuses on developing and deploying advanced technologies for natural gas engines used in power generation, aiming to reduce emissions and enhance efficiency.

Frequently Asked Questions (FAQ):

To speak to our analyst for a discussion on the above findings, click Speak to Analyst

TABLE OF CONTENTS
 
1 INTRODUCTION (Page No. - 25)
    1.1 STUDY OBJECTIVES 
    1.2 DEFINITION 
    1.3 INCLUSIONS AND EXCLUSIONS 
           1.3.1 GAS ENGINE MARKET, BY FUEL TYPE
           1.3.2 MARKET, BY POWER OUTPUT
           1.3.3 MARKET, BY APPLICATION
           1.3.4 MARKET, BY END-USE INDUSTRY
           1.3.5 MARKET, BY REGION
    1.4 MARKET SCOPE 
           1.4.1 GAS ENGINES MARKET SEGMENTATION
           1.4.2 REGIONAL SCOPE
    1.5 YEARS CONSIDERED 
    1.6 CURRENCY 
    1.7 LIMITATIONS 
    1.8 STAKEHOLDERS 
    1.9 SUMMARY OF CHANGES 
 
2 RESEARCH METHODOLOGY (Page No. - 31)
    2.1 RESEARCH DATA 
           FIGURE 1 GAS ENGINE MARKET: RESEARCH DESIGN
           2.1.1 SECONDARY DATA
                    2.1.1.1 Key data from secondary sources
           2.1.2 PRIMARY DATA
                    2.1.2.1 Key data from primary sources
                    2.1.2.2 Breakdown of primaries
                               FIGURE 2 BREAKDOWN OF PRIMARY INTERVIEWS: BY COMPANY TYPE, DESIGNATION,  AND REGION
                               FIGURE 3 GAS ENGINES DEMAND: MAIN METRICS CONSIDERED FOR ANALYSIS AND ASSESSMENT
    2.2 MARKET SIZE ESTIMATION 
           2.2.1 BOTTOM-UP APPROACH
                    FIGURE 4 MARKET SIZE ESTIMATION METHODOLOGY: BOTTOM-UP APPROACH
           2.2.2 TOP-DOWN APPROACH
                    FIGURE 5 MARKET SIZE ESTIMATION METHODOLOGY: TOP-DOWN APPROACH
           2.2.3 DEMAND-SIDE ANALYSIS
                    2.2.3.1 Regional analysis
                    2.2.3.2 Country analysis
                    2.2.3.3 Demand-side assumptions
                    2.2.3.4 Demand-side calculations
           2.2.4 SUPPLY-SIDE ANALYSIS
                    FIGURE 6 KEY STEPS CONSIDERED TO ASSESS SUPPLY OF GAS ENGINES
                    FIGURE 7 MARKET: SUPPLY-SIDE ANALYSIS
                    2.2.4.1 Supply-side assumptions
                    2.2.4.2 Supply-side calculations
           2.2.5 FORECAST
    2.3 RISK ASSESSMENT 
    2.4 LIMITATIONS 
    2.5 IMPACT OF RECESSION 
    2.6 MARKET BREAKDOWN AND DATA TRIANGULATION 
           FIGURE 8 DATA TRIANGULATION METHODOLOGY
 
3 EXECUTIVE SUMMARY (Page No. - 42)
    TABLE 1 GAS ENGINE MARKET SNAPSHOT 
    FIGURE 9 NATURAL GAS TO ACCOUNT FOR LARGEST SHARE OF GAS ENGINE MARKET FROM 2024 TO 2029 
    FIGURE 10 ABOVE 15 MW SEGMENT TO LEAD GAS ENGINES MARKET, BY POWER OUTPUT, FROM 2024 TO 2029 
    FIGURE 11 MECHANICAL DRIVE APPLICATION TO DOMINATE GAS ENGINE MARKET FROM 2024 TO 2029 
    FIGURE 12 UTILITIES TO BE LARGEST END-USE INDUSTRY FROM 2024 TO 2029 
    FIGURE 13 ASIA PACIFIC DOMINATED GAS ENGINE MARKET IN 2023 
 
4 PREMIUM INSIGHTS (Page No. - 46)
    4.1 ATTRACTIVE OPPORTUNITIES IN GAS ENGINE MARKET 
           FIGURE 14 EMISSION REGULATIONS AND ENVIRONMENTAL CONCERNS OVER CONVENTIONAL ENERGY TO DRIVE GAS ENGINE MARKET
    4.2 ASIA PACIFIC: GAS ENGINE MARKET,  BY END-USE INDUSTRY AND COUNTRY 
           FIGURE 15 MARINE END-USE INDUSTRY AND CHINA HELD LARGEST SHARE OF GAS ENGINE MARKET IN ASIA PACIFIC IN 2023
    4.3 GAS ENGINE MARKET, BY FUEL TYPE 
           FIGURE 16 NATURAL GAS TO ACCOUNT FOR MAJOR SHARE BY 2029
    4.4 GAS ENGINE MARKET, BY POWER OUTPUT 
           FIGURE 17 ABOVE 15 MW SEGMENT TO DOMINATE GAS ENGINE MARKET, BY POWER OUTPUT, BY 2029
    4.5 GAS ENGINE MARKET, BY APPLICATION 
           FIGURE 18 MECHANICAL DRIVE TO BE DOMINANT APPLICATION SEGMENT BY 2029
    4.6 GAS ENGINE MARKET, BY END-USE INDUSTRY 
           FIGURE 19 UTILITIES END-USE INDUSTRY TO COMMAND MARKET BY 2029
    4.7 GAS ENGINE MARKET, BY REGION 
           FIGURE 20 EUROPEAN MARKET TO REGISTER HIGHEST CAGR DURING FORECAST PERIOD
 
5 MARKET OVERVIEW (Page No. - 50)
    5.1 INTRODUCTION 
    5.2 MARKET DYNAMICS 
           FIGURE 21 GAS ENGINE MARKET: DRIVERS, RESTRAINTS, OPPORTUNITIES,  AND CHALLENGES
           5.2.1 DRIVERS
                    5.2.1.1 Trend toward clean and efficient power generation
                               FIGURE 22 NATURAL GAS CONSUMPTION, 2012–2022
                               TABLE 2 CO2 EMISSION LEVELS (PER MILLION BTU OF ENERGY)
                    5.2.1.2 Stringent emission regulations
                               FIGURE 23 GLOBAL CARBON DIOXIDE EMISSIONS, 2017–2022
                    5.2.1.3 Advancements in gas engine technology
                               FIGURE 24 MINIMUM AVERAGE EFFICIENCY OF CHP SYSTEMS, BY POWER SOURCE
                    5.2.1.4 Integration of renewable energy sources
           5.2.2 RESTRAINTS
                    5.2.2.1 Policy and regulatory uncertainty
                    5.2.2.2 Fluctuating gas prices
           5.2.3 OPPORTUNITIES
                    5.2.3.1 Evolving landscape of coal, gas, and nuclear energy
                    5.2.3.2 Adoption of natural gas as transition fuel
                    5.2.3.3 Leveraging potential of biogas and landfill gas
           5.2.4 CHALLENGES
                    5.2.4.1 Infrastructural shortcomings
                    5.2.4.2 Ensuring long-term sustainability
    5.3 TRENDS/DISRUPTIONS IMPACTING CUSTOMER BUSINESS 
           5.3.1 REVENUE SHIFT AND NEW REVENUE POCKETS FOR GAS ENGINE PROVIDERS
                    FIGURE 25 REVENUE SHIFT FOR GAS ENGINE PROVIDERS
    5.4 MARKET MAP 
           FIGURE 26 GAS ENGINES MARKET MAP
           TABLE 3 GAS ENGINES MARKET: ROLE IN ECOSYSTEM
    5.5 VALUE CHAIN ANALYSIS 
           FIGURE 27 VALUE CHAIN ANALYSIS: MARKET
           5.5.1 RAW MATERIAL PROVIDERS/SUPPLIERS
           5.5.2 COMPONENT MANUFACTURERS
           5.5.3 GAS ENGINE MANUFACTURERS/ASSEMBLERS
           5.5.4 DISTRIBUTORS
           5.5.5 END USERS
           5.5.6 POST-SALE SERVICES
    5.6 PRICING ANALYSIS 
           5.6.1 AVERAGE SELLING PRICE TREND OF KEY PLAYERS, BY POWER OUTPUT
                    TABLE 4 AVERAGE SELLING PRICE OF GAS ENGINES, 2022
           5.6.2 AVERAGE SELLING PRICE TREND, BY REGION
                    TABLE 5 AVERAGE SELLING PRICE OF GAS ENGINES, 2023–2029
                    FIGURE 28 AVERAGE SELLING PRICE OF GAS ENGINES, BY REGION
    5.7 INVESTMENT AND FUNDING SCENARIO 
           FIGURE 29 INVESTMENT AND FUNDING SCENARIO, BY COMPANY
    5.8 TRADE ANALYSIS 
           5.8.1 TRADE ANALYSIS RELATED TO ENGINES AND MOTORS
                    5.8.1.1 Import scenario
                               TABLE 6 IMPORT SCENARIO FOR HS CODE 841280, BY COUNTRY, 2020–2022 (USD THOUSAND)
                               FIGURE 30 IMPORT DATA FOR HS CODE 841280-ENGINES & MOTORS, BY COUNTRY, 2020–2022 (USD THOUSAND)
                    5.8.1.2 Export scenario
                               TABLE 7 EXPORT SCENARIO FOR HS CODE 841280, BY COUNTRY, 2020–2022 (USD THOUSAND)
                               FIGURE 31 EXPORT DATA FOR HS CODE 841280-ENGINES & MOTORS, BY COUNTRY, 2020–2022 (USD THOUSAND)
    5.9 TARIFFS, CODES, AND REGULATIONS 
           5.9.1 TARIFFS RELATED TO GAS ENGINES
                    TABLE 8 IMPORT TARIFFS FOR HS 841280 ENGINES AND MOTORS NES IN 2022
           5.9.2 REGULATORY BODIES, GOVERNMENT AGENCIES, AND OTHER ORGANIZATIONS
                    TABLE 9 NORTH AMERICA: REGULATORY BODIES, GOVERNMENT AGENCIES,  AND OTHER ORGANIZATIONS
                    TABLE 10 EUROPE: REGULATORY BODIES, GOVERNMENT AGENCIES,  AND OTHER ORGANIZATIONS
                    TABLE 11 ASIA PACIFIC: REGULATORY BODIES, GOVERNMENT AGENCIES,  AND OTHER ORGANIZATIONS
                    TABLE 12 GLOBAL: REGULATORY BODIES, GOVERNMENT AGENCIES,  AND OTHER ORGANIZATIONS
    5.10 PATENT ANALYSIS 
           FIGURE 32 PATENT ANALYSIS
           TABLE 14 GAS ENGINES: PATENT ANALYSIS, MARCH 2020–SEPTEMBER 2023
    5.11 KEY CONFERENCES AND EVENTS, 2024–2025 
                    TABLE 15 GAS ENGINES MARKET: KEY CONFERENCES AND EVENTS
    5.12 PORTER’S FIVE FORCES ANALYSIS 
                    FIGURE 33 PORTER’S FIVE FORCES ANALYSIS FOR MARKET
                    TABLE 16 GAS ENGINE MARKET: PORTER’S FIVE FORCES ANALYSIS
           5.12.1 THREAT OF SUBSTITUTES
           5.12.2 BARGAINING POWER OF SUPPLIERS
           5.12.3 BARGAINING POWER OF BUYERS
           5.12.4 THREAT OF NEW ENTRANTS
           5.12.5 INTENSITY OF COMPETITIVE RIVALRY
    5.13 CASE STUDY ANALYSIS 
           5.13.1 SIEMENS ENERGY SOLVES UK NATIONAL GRID'S PEAK POWER CHALLENGE WITH CLEANER TECHNOLOGY
                    5.13.1.1 Problem statement
                    5.13.1.2 Solution
           5.13.2 CLARK UNIVERSITY INCREASES COST SAVINGS WITH RELIABLE COGENERATION SOLUTION
                    5.13.2.1 Problem statement
                    5.13.2.2 Solution
           5.13.3 JENBACHER J420 ENGINE HARNESSES HYDROGEN ENERGY
                    5.13.3.1 Problem statement
                    5.13.3.2 Solution
    5.14 TECHNOLOGY ANALYSIS 
           5.14.1 KEY TECHNOLOGY
                    5.14.1.1 Direct Fuel Injection
           5.14.2 COMPLEMENTARY TECHNOLOGY
                    5.14.2.1 Integration of combined heat and power systems
    5.15 KEY STAKEHOLDERS AND BUYING CRITERIA 
           5.15.1 STAKEHOLDERS IN BUYING PROCESS
                    FIGURE 34 INFLUENCE OF STAKEHOLDERS ON BUYING PROCESS, BY END-USE INDUSTRY
                    TABLE 17 INFLUENCE OF STAKEHOLDERS ON BUYING PROCESS, BY END-USE INDUSTRY
           5.15.2 BUYING CRITERIA
                    FIGURE 35 KEY BUYING CRITERIA, BY END-USE INDUSTRY
                    TABLE 18 KEY BUYING CRITERIA, BY END-USE INDUSTRY
 
6 GAS ENGINE MARKET, BY FUEL TYPE (Page No. - 88)
    6.1 INTRODUCTION 
           FIGURE 36 GAS ENGINE MARKET, BY FUEL TYPE, 2023
           TABLE 19 MARKET, BY FUEL TYPE, 2020–2023 (USD MILLION)
           TABLE 20 MARKET, BY FUEL TYPE, 2024–2029 (USD MILLION)
    6.2 NATURAL GAS 
           6.2.1 USE AS PRIMARY FUEL IN POWER GENERATION TO BOOST GROWTH
                    TABLE 21 NATURAL GAS: GAS ENGINES MARKET, BY REGION, 2020–2023 (USD MILLION)
                    TABLE 22 NATURAL GAS: MARKET, BY REGION, 2024–2029 (USD MILLION)
    6.3 SPECIAL GAS 
           6.3.1 USE IN COGENERATION AND TRIGENERATION – KEY DRIVER
                    TABLE 23 SPECIAL GAS: MARKET, BY REGION, 2020–2023 (USD MILLION)
                    TABLE 24 SPECIAL GAS: MARKET, BY REGION, 2024–2029 (USD MILLION)
    6.4 OTHERS 
           TABLE 25 OTHER GASES: MARKET, BY REGION, 2020–2023 (USD MILLION)
           TABLE 26 OTHER GASES: MARKET, BY REGION, 2024–2029 (USD MILLION)
 
7 GAS ENGINE MARKET, BY POWER OUTPUT (Page No. - 94)
    7.1 INTRODUCTION 
           FIGURE 37 GAS ENGINE MARKET, BY POWER OUTPUT, 2023
           TABLE 27 GAS ENGINES MARKET, BY POWER OUTPUT, 2020–2023 (USD MILLION)
           TABLE 28 MARKET, BY POWER OUTPUT, 2024–2029 (USD MILLION)
           TABLE 29 MARKET, BY POWER OUTPUT, 2020–2023 (UNITS)
           TABLE 30 MARKET, BY POWER OUTPUT, 2024–2029 (UNITS)
    7.2 0.5–1 MW 
           7.2.1 USED WIDELY IN COMMERCIAL AND INDUSTRIAL SETTINGS
                    TABLE 31 0.5–1 MW: GAS ENGINES MARKET, BY REGION, 2020–2023 (USD MILLION)
                    TABLE 32 0.5–1 MW: MARKET, BY REGION, 2024–2029 (USD MILLION)
                    TABLE 33 0.5–1 MW: MARKET, BY REGION, 2020–2023 (UNITS)
                    TABLE 34 0.5–1 MW: MARKET, BY REGION, 2024–2029 (UNITS)
    7.3 1.1–2 MW 
           7.3.1 CONTRIBUTE TO ENERGY EFFICIENCY AND GRID STABILITY
                    TABLE 35 1.1–2 MW: MARKET, BY REGION, 2020–2023 (USD MILLION)
                    TABLE 36 1.1–2 MW: MARKET, BY REGION, 2024–2029 (USD MILLION)
                    TABLE 37 1.1–2 MW: MARKET, BY REGION, 2020–2023 (UNITS)
                    TABLE 38 1.1–2 MW: MARKET, BY REGION, 2024–2029 (UNITS)
    7.4 2.1–5 MW 
           7.4.1 PROVIDE RELIABLE, EFFICIENT, AND FLEXIBLE POWER GENERATION SOLUTIONS
                    TABLE 39 2.1–5 MW: MARKET, BY REGION, 2020–2023 (USD MILLION)
                    TABLE 40 2.1–5 MW: MARKET, BY REGION, 2024–2029 (USD MILLION)
                    TABLE 41 2.1–5 MW: MARKET, BY REGION, 2020–2023 (UNITS)
                    TABLE 42 2.1–5 MW: MARKET, BY REGION, 2024–2029 (UNITS)
    7.5 5.1–15 MW 
           7.5.1 EMPOWER LARGE-SCALE ENERGY SOLUTIONS
                    TABLE 43 5.1–15 MW: MARKET, BY REGION, 2020–2023 (USD MILLION)
                    TABLE 44 5.1–15 MW: MARKET, BY REGION, 2024–2029 (USD MILLION)
                    TABLE 45 5.1–15 MW: MARKET, BY REGION, 2020–2023 (UNITS)
                    TABLE 46 5.1–15 MW: MARKET, BY REGION, 2024–2029 (UNITS)
    7.6 ABOVE 15 MW 
           7.6.1 MAXIMIZE EFFICIENCY AND MINIMIZE ENVIRONMENTAL IMPACT
                    TABLE 47 ABOVE 15 MW: MARKET, BY REGION, 2020–2023 (USD MILLION)
                    TABLE 48 ABOVE 15 MW: MARKET, BY REGION, 2024–2029 (USD MILLION)
                    TABLE 49 ABOVE 15 MW: MARKET, BY REGION, 2020–2023 (UNITS)
                    TABLE 50 ABOVE 15 MW: MARKET, BY REGION, 2024–2029 (UNITS)
 
8 GAS ENGINE MARKET, BY APPLICATION (Page No. - 106)
    8.1 INTRODUCTION 
           FIGURE 38 GAS ENGINESMARKET, BY APPLICATION, 2023
           TABLE 51 MARKET, BY APPLICATION, 2020–2023 (USD MILLION)
           TABLE 52 MARKET, BY APPLICATION, 2024–2029 (USD MILLION)
    8.2 POWER GENERATION 
           8.2.1 HELPS IN CONTINUOUS BASELOAD SUPPLY TO BACKUP POWER DURING EMERGENCIES
                    TABLE 53 POWER GENERATION: GAS ENGINES MARKET, BY REGION, 2020–2023 (USD MILLION)
                    TABLE 54 POWER GENERATION: MARKET, BY REGION, 2024–2029 (USD MILLION)
    8.3 COGENERATION 
           8.3.1 CATERS TO DIVERSE RANGE OF EFFICIENT AND SUSTAINABLE ENERGY SOLUTIONS
                    TABLE 55 COGENERATION: MARKET, BY REGION, 2020–2023 (USD MILLION)
                    TABLE 56 COGENERATION: MARKET, BY REGION, 2024–2029 (USD MILLION)
    8.4 MECHANICAL DRIVE 
           8.4.1 SERVES DIVERSE INDUSTRIES, CONTRIBUTING TO EFFICIENT AND RELIABLE OPERATION
                    TABLE 57 MECHANICAL DRIVE: MARKET, BY REGION, 2020–2023 (USD MILLION)
                    TABLE 58 MECHANICAL DRIVE: MARKET, BY REGION, 2024–2029 (USD MILLION)
    8.5 OTHERS 
           TABLE 59 OTHER APPLICATIONS: MARKET, BY REGION, 2020–2023 (USD MILLION)
           TABLE 60 OTHER APPLICATIONS: MARKET, BY REGION, 2024–2029 (USD MILLION)
 
9 GAS ENGINE MARKET, BY END-USE INDUSTRY (Page No. - 113)
    9.1 INTRODUCTION 
           FIGURE 39 GAS ENGINE MARKET, BY END-USE INDUSTRY, 2023
           TABLE 61 MARKET, BY END-USE INDUSTRY, 2020–2023 (USD MILLION)
           TABLE 62 MARKET, BY END-USE INDUSTRY, 2024–2029 (USD MILLION)
    9.2 UTILITIES 
           9.2.1 DEMAND FOR GAS ENGINES IN POWER PLANTS, INDUSTRIAL FACILITIES, COMMERCIAL BUILDINGS
                    TABLE 63 UTILITIES: GAS ENGINES MARKET, BY REGION, 2020–2023 (USD MILLION)
                    TABLE 64 UTILITIES: MARKET, BY REGION, 2024–2029 (USD MILLION)
    9.3 MANUFACTURING 
           9.3.1 DEMAND IN MANUFACTURING FOR EMISSION REDUCTION AND POWER GENERATION
                    TABLE 65 MANUFACTURING: MARKET, BY REGION, 2020–2023 (USD MILLION)
                    TABLE 66 MANUFACTURING: MARKET, BY REGION, 2024–2029 (USD MILLION)
    9.4 MARINE 
           9.4.1 DEMAND IN MARINE SEGMENT FOR HYBRID PROPULSION SYSTEM AND EMERGENCY BACKUP POWER
                    TABLE 67 MARINE: MARKET, BY REGION, 2020–2023 (USD MILLION)
                    TABLE 68 MARINE: MARKET, BY REGION, 2024–2029 (USD MILLION)
    9.5 OIL & GAS 
           9.5.1 DEMAND IN OIL & GAS SEGMENT TO MEET FUEL EFFICIENCY REQUIREMENTS
                    TABLE 69 OIL & GAS: MARKET, BY REGION, 2020–2023 (USD MILLION)
                    TABLE 70 OIL & GAS: MARKET, BY REGION, 2024–2029 (USD MILLION)
    9.6 OTHERS 
           TABLE 71 OTHER END-USE INDUSTRIES: MARKET, BY REGION,  2020–2023 (USD MILLION)
           TABLE 72 OTHER END-USE INDUSTRIES: MARKET, BY REGION,  2024–2029 (USD MILLION)
 
10 GAS ENGINE MARKET, BY REGION (Page No. - 121)
     10.1 INTRODUCTION 
               FIGURE 40 GAS ENGINE MARKET SHARE, BY REGION, 2023 (%)
               FIGURE 41 MARKET IN EUROPE TO RECORD HIGHEST CAGR DURING FORECAST PERIOD
               TABLE 73 MARKET, BY REGION, 2020–2023 (USD MILLION)
               TABLE 74 MARKET, BY REGION, 2024–2029 (USD MILLION)
     10.2 ASIA PACIFIC 
               FIGURE 42 ASIA PACIFIC: MARKET SNAPSHOT
             10.2.1 BY FUEL TYPE
                       TABLE 75 ASIA PACIFIC: GAS ENGINE MARKET, BY FUEL TYPE, 2020–2023 (USD MILLION)
                       TABLE 76 ASIA PACIFIC: MARKET, BY FUEL TYPE, 2024–2029 (USD MILLION)
             10.2.2 BY POWER OUTPUT
                       TABLE 77 ASIA PACIFIC: MARKET, BY POWER OUTPUT, 2020–2023 (USD MILLION)
                       TABLE 78 ASIA PACIFIC: MARKET, BY POWER OUTPUT, 2024–2029 (USD MILLION)
                       TABLE 79 ASIA PACIFIC: MARKET, BY POWER OUTPUT, 2020–2023 (UNITS)
                       TABLE 80 ASIA PACIFIC: MARKET, BY POWER OUTPUT, 2024–2029 (UNITS)
             10.2.3 BY APPLICATION
                       TABLE 81 ASIA PACIFIC: MARKET, BY APPLICATION, 2020–2023 (USD MILLION)
                       TABLE 82 ASIA PACIFIC: MARKET, BY APPLICATION, 2024–2029 (USD MILLION)
             10.2.4 BY END-USE INDUSTRY
                       TABLE 83 ASIA PACIFIC: MARKET, BY END-USE INDUSTRY,  2020–2023 (USD MILLION)
                       TABLE 84 ASIA PACIFIC: MARKET, BY END-USE INDUSTRY,  2024–2029 (USD MILLION)
             10.2.5 BY COUNTRY
                       TABLE 85 ASIA PACIFIC: MARKET, BY COUNTRY, 2020–2023 (USD MILLION)
                       TABLE 86 ASIA PACIFIC: MARKET, BY COUNTRY, 2024–2029 (USD MILLION)
                       10.2.5.1 China
                                   10.2.5.1.1 Largest country-level market in region
                                                       TABLE 87 CHINA: GAS ENGINES MARKET, BY FUEL TYPE, 2020–2023 (USD MILLION)
                                                       TABLE 88 CHINA: MARKET, BY FUEL TYPE, 2024–2029 (USD MILLION)
                                                       TABLE 89 CHINA: MARKET, BY POWER OUTPUT, 2020–2023 (USD MILLION)
                                                       TABLE 90 CHINA: MARKET, BY POWER OUTPUT, 2024–2029 (USD MILLION)
                       10.2.5.2 India
                                   10.2.5.2.1 Government initiatives to drive market growth
                                                       TABLE 91 INDIA: MARKET, BY FUEL TYPE, 2020–2023 (USD MILLION)
                                                       TABLE 92 INDIA: MARKET, BY FUEL TYPE, 2024–2029 (USD MILLION)
                                                       TABLE 93 INDIA: MARKET, BY POWER OUTPUT, 2020–2023 (USD MILLION)
                                                       TABLE 94 INDIA: MARKET, BY POWER OUTPUT, 2024–2029 (USD MILLION)
                       10.2.5.3 Japan
                                   10.2.5.3.1 Mature market driven by stringent environmental regulations
                                                       TABLE 95 JAPAN: MARKET, BY FUEL TYPE, 2020–2023 (USD MILLION)
                                                       TABLE 96 JAPAN: MARKET, BY FUEL TYPE, 2024–2029 (USD MILLION)
                                                       TABLE 97 JAPAN: MARKET, BY POWER OUTPUT, 2020–2023 (USD MILLION)
                                                       TABLE 98 JAPAN: MARKET, BY POWER OUTPUT, 2024–2029 (USD MILLION)
                       10.2.5.4 Rest of Asia Pacific
                                   TABLE 99 REST OF ASIA PACIFIC: MARKET, BY FUEL TYPE,  2020–2023 (USD MILLION)
                                   TABLE 100 REST OF ASIA PACIFIC: MARKET, BY FUEL TYPE,  2024–2029 (USD MILLION)
                                   TABLE 101 REST OF ASIA PACIFIC: MARKET, BY POWER OUTPUT,  2020–2023 (USD MILLION)
                                   TABLE 102 REST OF ASIA PACIFIC: MARKET, BY POWER OUTPUT,  2024–2029 (USD MILLION)
     10.3 EUROPE 
               FIGURE 43 EUROPEAN MARKET SNAPSHOT
             10.3.1 BY FUEL TYPE
                       TABLE 103 EUROPE: GAS ENGINE MARKET, BY FUEL TYPE, 2020–2023 (USD MILLION)
                       TABLE 104 EUROPE: MARKET, BY FUEL TYPE, 2024–2029 (USD MILLION)
             10.3.2 BY POWER OUTPUT
                       TABLE 105 EUROPE: MARKET, BY POWER OUTPUT, 2020–2023 (USD MILLION)
                       TABLE 106 EUROPE: MARKET, BY POWER OUTPUT, 2024–2029 (USD MILLION)
                       TABLE 107 EUROPE: MARKET, BY POWER OUTPUT, 2020–2023 (UNITS)
                       TABLE 108 EUROPE: MARKET, BY POWER OUTPUT, 2024–2029 (UNITS)
             10.3.3 BY APPLICATION
                       TABLE 109 EUROPE: MARKET, BY APPLICATION, 2020–2023 (USD MILLION)
                       TABLE 110 EUROPE: MARKET, BY APPLICATION, 2024–2029 (USD MILLION)
             10.3.4 BY END-USE INDUSTRY
                       TABLE 111 EUROPE: MARKET, BY END-USE INDUSTRY, 2020–2023 (USD MILLION)
                       TABLE 112 EUROPE: MARKET, BY END-USE INDUSTRY, 2024–2029 (USD MILLION)
             10.3.5 BY COUNTRY
                       TABLE 113 EUROPE: MARKET, BY COUNTRY, 2020–2023 (USD MILLION)
                       TABLE 114 EUROPE: MARKET, BY COUNTRY, 2024–2029 (USD MILLION)
                       10.3.5.1 Germany
                                   10.3.5.1.1 Role of gas engines in Germany's energy mix: Balancing security, efficiency, and renewables
                                                       TABLE 115 GERMANY: GAS ENGINES MARKET, BY FUEL TYPE, 2020–2023 (USD MILLION)
                                                       TABLE 116 GERMANY: MARKET, BY FUEL TYPE, 2024–2029 (USD MILLION)
                                                       TABLE 117 GERMANY: MARKET, BY POWER OUTPUT, 2020–2023 (USD MILLION)
                                                       TABLE 118 GERMANY: MARKET, BY POWER OUTPUT, 2024–2029 (USD MILLION)
                       10.3.5.2 UK
                                   10.3.5.2.1 Financial incentives for clean energy boost market
                                                       TABLE 119 UK: MARKET, BY FUEL TYPE, 2020–2023 (USD MILLION)
                                                       TABLE 120 UK: MARKET, BY FUEL TYPE, 2024–2029 (USD MILLION)
                                                       TABLE 121 UK: MARKET, BY POWER OUTPUT, 2020–2023 (USD MILLION)
                                                       TABLE 122 UK: MARKET, BY POWER OUTPUT, 2024–2029 (USD MILLION)
                       10.3.5.3 Russia
                                   10.3.5.3.1 Rising demand for cogeneration power to fuel market
                                                       TABLE 123 RUSSIA: MARKET, BY FUEL TYPE, 2020–2023 (USD MILLION)
                                                       TABLE 124 RUSSIA: MARKET, BY FUEL TYPE, 2024–2029 (USD MILLION)
                                                       TABLE 125 RUSSIA: MARKET, BY POWER OUTPUT, 2020–2023 (USD MILLION)
                                                       TABLE 126 RUSSIA: MARKET, BY POWER OUTPUT, 2024–2029 (USD MILLION)
                       10.3.5.4 Italy
                                   10.3.5.4.1 Increasing demand for higher overall energy efficiency to drive market
                                                       TABLE 127 ITALY: MARKET, BY FUEL TYPE, 2020–2023 (USD MILLION)
                                                       TABLE 128 ITALY: MARKET, BY FUEL TYPE, 2024–2029 (USD MILLION)
                                                       TABLE 129 ITALY: MARKET, BY POWER OUTPUT, 2020–2023 (USD MILLION)
                                                       TABLE 130 ITALY: MARKET, BY POWER OUTPUT, 2024–2029 (USD MILLION)
                       10.3.5.5 France
                                   10.3.5.5.1 Increasing demand for gas-fired power plants to support electricity grid
                                                       TABLE 131 FRANCE: MARKET, BY FUEL TYPE, 2020–2023 (USD MILLION)
                                                       TABLE 132 FRANCE: MARKET, BY FUEL TYPE, 2024–2029 (USD MILLION)
                                                       TABLE 133 FRANCE: MARKET, BY POWER OUTPUT, 2020–2023 (USD MILLION)
                                                       TABLE 134 FRANCE: MARKET, BY POWER OUTPUT, 2024–2029 (USD MILLION)
                       10.3.5.6 Rest of Europe
                                   TABLE 135 REST OF EUROPE: MARKET, BY FUEL TYPE, 2020–2023 (USD MILLION)
                                   TABLE 136 REST OF EUROPE: MARKET, BY FUEL TYPE, 2024–2029 (USD MILLION)
                                   TABLE 137 REST OF EUROPE: MARKET, BY POWER OUTPUT,  2020–2023 (USD MILLION)
                                   TABLE 138 REST OF EUROPE: MARKET, BY POWER OUTPUT,  2024–2029 (USD MILLION)
     10.4 NORTH AMERICA 
             10.4.1 BY FUEL TYPE
                       TABLE 139 NORTH AMERICA: GAS ENGINE MARKET, BY FUEL TYPE, 2020–2023 (USD MILLION)
                       TABLE 140 NORTH AMERICA: MARKET, BY FUEL TYPE, 2024–2029 (USD MILLION)
             10.4.2 BY POWER OUTPUT
                       TABLE 141 NORTH AMERICA: MARKET, BY POWER OUTPUT,  2020–2023 (USD MILLION)
                       TABLE 142 NORTH AMERICA: MARKET, BY POWER OUTPUT,  2024–2029 (USD MILLION)
                       TABLE 143 NORTH AMERICA: MARKET, BY POWER OUTPUT,  2020–2023 (UNITS)
                       TABLE 144 NORTH AMERICA: MARKET, BY POWER OUTPUT,  2024–2029 (UNITS)
             10.4.3 BY APPLICATION
                       TABLE 145 NORTH AMERICA: MARKET, BY APPLICATION, 2020–2023 (USD MILLION)
                       TABLE 146 NORTH AMERICA: MARKET, BY APPLICATION, 2024–2029 (USD MILLION)
             10.4.4 BY END-USE INDUSTRY
                       TABLE 147 NORTH AMERICA: MARKET, BY END-USE INDUSTRY,  2020–2023 (USD MILLION)
                       TABLE 148 NORTH AMERICA: MARKET, BY END-USE INDUSTRY,  2024–2029 (USD MILLION)
             10.4.5 BY COUNTRY
                       TABLE 149 NORTH AMERICA: MARKET, BY COUNTRY, 2020–2023 (USD MILLION)
                       TABLE 150 NORTH AMERICA: MARKET, BY COUNTRY, 2024–2029 (USD MILLION)
                       10.4.5.1 US
                                   10.4.5.1.1 Government policies for replacement of coal-fired power plants with gas-fired plants to drive market
                                                       TABLE 151 US: GAS ENGINES MARKET, BY FUEL TYPE, 2020–2023 (USD MILLION)
                                                       TABLE 152 US: MARKET, BY FUEL TYPE, 2024–2029 (USD MILLION)
                                                       TABLE 153 US: MARKET, BY POWER OUTPUT, 2020–2023 (USD MILLION)
                                                       TABLE 154 US: MARKET, BY POWER OUTPUT, 2024–2029 (USD MILLION)
                       10.4.5.2 Canada
                                   10.4.5.2.1 Increasing cogeneration applications to propel market
                                                       TABLE 155 CANADA: MARKET, BY FUEL TYPE, 2020–2023 (USD MILLION)
                                                       TABLE 156 CANADA: MARKET, BY FUEL TYPE, 2024–2029 (USD MILLION)
                                                       TABLE 157 CANADA: MARKET, BY POWER OUTPUT, 2020–2023 (USD MILLION)
                                                       5TABLE 158 CANADA: MARKET, BY POWER OUTPUT, 2024–2029 (USD MILLION)
                       10.4.5.3 Mexico
                                   10.4.5.3.1 Energy transition for improved efficiency to drive market growth
                                                       TABLE 159 MEXICO: MARKET, BY FUEL TYPE, 2020–2023 (USD MILLION)
                                                       TABLE 160 MEXICO: MARKET, BY FUEL TYPE, 2024–2029 (USD MILLION)
                                                       TABLE 161 MEXICO: MARKET, BY POWER OUTPUT, 2020–2023 (USD MILLION)
                                                       TABLE 162 MEXICO: MARKET, BY POWER OUTPUT, 2024–2029 (USD MILLION)
     10.5 SOUTH AMERICA 
             10.5.1 BY FUEL TYPE
                       TABLE 163 SOUTH AMERICA: GAS ENGINE MARKET, BY FUEL TYPE, 2020–2023 (USD MILLION)
                       TABLE 164 SOUTH AMERICA: MARKET, BY FUEL TYPE, 2024–2029 (USD MILLION)
             10.5.2 BY POWER OUTPUT
                       TABLE 165 SOUTH AMERICA: MARKET, BY POWER OUTPUT,  2020–2023 (USD MILLION)
                       TABLE 166 SOUTH AMERICA: MARKET, BY POWER OUTPUT,  2024–2029 (USD MILLION)
                       TABLE 167 SOUTH AMERICA: MARKET, BY POWER OUTPUT,  2020–2023 (UNITS)
                       TABLE 168 SOUTH AMERICA: MARKET, BY POWER OUTPUT,  2024–2029 (UNITS)
             10.5.3 BY APPLICATION
                       TABLE 169 SOUTH AMERICA: MARKET, BY APPLICATION, 2020–2023 (USD MILLION)
                       TABLE 170 SOUTH AMERICA: MARKET, BY APPLICATION, 2024–2029 (USD MILLION)
             10.5.4 BY END-USE INDUSTRY
                       TABLE 171 SOUTH AMERICA: MARKET, BY END-USE INDUSTRY,  2020–2023 (USD MILLION)
                       TABLE 172 SOUTH AMERICA: MARKET, BY END-USE INDUSTRY,  2024–2029 (USD MILLION)
             10.5.5 BY COUNTRY
                       TABLE 173 SOUTH AMERICA: MARKET, BY COUNTRY, 2020–2023 (USD MILLION)
                       TABLE 174 SOUTH AMERICA: MARKET, BY COUNTRY, 2024–2029 (USD MILLION)
                       10.5.5.1 Brazil
                                   10.5.5.1.1 Driving forces and dynamics: Abundant reserves, growing demand, and government initiatives
                                                       TABLE 175 BRAZIL: GAS ENGINES MARKET, BY FUEL TYPE, 2020–2023 (USD MILLION)
                                                       TABLE 176 BRAZIL: MARKET, BY FUEL TYPE, 2024–2029 (USD MILLION)
                                                       TABLE 177 BRAZIL: MARKET, BY POWER OUTPUT, 2020–2023 (USD MILLION)
                                                       TABLE 178 BRAZIL: MARKET, BY POWER OUTPUT, 2024–2029 (USD MILLION)
                       10.5.5.2 Argentina
                                   10.5.5.2.1 Abundant reserves, ambitious goals, and regulatory evolution boost market
                                                       TABLE 179 ARGENTINA: MARKET, BY FUEL TYPE, 2020–2023 (USD MILLION)
                                                       TABLE 180 ARGENTINA: MARKET, BY FUEL TYPE, 2024–2029 (USD MILLION)
                                                       TABLE 181 ARGENTINA: MARKET, BY POWER OUTPUT, 2020–2023 (USD MILLION)
                                                       TABLE 182 ARGENTINA: MARKET, BY POWER OUTPUT, 2024–2029 (USD MILLION)
                       10.5.5.3 Rest of South America
                                   TABLE 183 REST OF SOUTH AMERICA: MARKET, BY FUEL TYPE,  2020–2023 (USD MILLION)
                                   TABLE 184 REST OF SOUTH AMERICA: MARKET, BY FUEL TYPE,  2024–2029 (USD MILLION)
                                   TABLE 185 REST OF SOUTH AMERICA: MARKET, BY POWER OUTPUT,  2020–2023 (USD MILLION)
                                   TABLE 186 REST OF SOUTH AMERICA: MARKET, BY POWER OUTPUT,  2024–2029 (USD MILLION)
     10.6 MIDDLE EAST & AFRICA 
             10.6.1 BY FUEL TYPE
                       TABLE 187 MIDDLE EAST & AFRICA: GAS ENGINE MARKET, BY FUEL TYPE,  2020–2023 (USD MILLION)
                       TABLE 188 MIDDLE EAST & AFRICA: MARKET, BY FUEL TYPE,  2024–2029 (USD MILLION)
             10.6.2 BY POWER OUTPUT
                       TABLE 189 MIDDLE EAST & AFRICA: MARKET, BY POWER OUTPUT,  2020–2023 (USD MILLION)
                       TABLE 190 MIDDLE EAST & AFRICA: MARKET, BY POWER OUTPUT,  2024–2029 (USD MILLION)
                       TABLE 191 MIDDLE EAST & AFRICA: MARKET, BY POWER OUTPUT,  2020–2023 (UNITS)
                       TABLE 192 MIDDLE EAST & AFRICA: MARKET, BY POWER OUTPUT,  2024–2029 (UNITS)
             10.6.3 BY APPLICATION
                       TABLE 193 MIDDLE EAST & AFRICA: MARKET, BY APPLICATION,  2020–2023 (USD MILLION)
                       TABLE 194 MIDDLE EAST & AFRICA: MARKET, BY APPLICATION,  2024–2029 (USD MILLION)
             10.6.4 BY END-USE INDUSTRY
                       TABLE 195 MIDDLE EAST & AFRICA: MARKET, BY END-USE INDUSTRY,  2020–2023 (USD MILLION)
             10.6.5 BY END-USE INDUSTRY
                       TABLE 196 MIDDLE EAST & AFRICA: MARKET, BY END-USE INDUSTRY,  2024–2029 (USD MILLION)
             10.6.6 BY COUNTRY
                       TABLE 197 MIDDLE EAST & AFRICA: MARKET, BY COUNTRY,  2024–2029 (USD MILLION)
                       10.6.6.1 GCC Countries
                                   10.6.6.1.1 Saudi Arabia
                                                    10.6.6.1.1.1 Expansion in mining and manufacturing sectors propels market growth
                                                                            TABLE 198 SAUDI ARABIA: GAS ENGINES MARKET, BY FUEL TYPE, 2020–2023 (USD MILLION)
                                                                            TABLE 199 SAUDI ARABIA: MARKET, BY FUEL TYPE, 2024–2029 (USD MILLION)
                                                                            TABLE 200 SAUDI ARABIA: MARKET, BY POWER OUTPUT, 2020–2023 (USD MILLION)
                                                                            TABLE 201 SAUDI ARABIA: MARKET, BY POWER OUTPUT, 2024–2029 (USD MILLION)
                                   10.6.6.1.2 UAE
                                                    10.6.6.1.2.1 Abundant resources and initiatives strategically boost market
                                                                            TABLE 202 UAE: MARKET, BY FUEL TYPE, 2020–2023 (USD MILLION)
                                                                            TABLE 203 UAE: MARKET, BY FUEL TYPE, 2024–2029 (USD MILLION)
                                                                            TABLE 204 UAE: MARKET, BY POWER OUTPUT, 2020–2023 (USD MILLION)
                                                                            TABLE 205 UAE: MARKET, BY POWER OUTPUT, 2024–2029 (USD MILLION)
                                   10.6.6.1.3 Rest of GCC
                                                         TABLE 206 REST OF GCC: MARKET, BY FUEL TYPE, 2024–2029 (USD MILLION)
                                                         TABLE 207 REST OF GCC: MARKET, BY POWER OUTPUT, 2024–2029 (USD MILLION)
                       10.6.6.2 Egypt
                                   10.6.6.2.1 Increasing gas production and diversified power generation to fuel market
                                                         TABLE 208 EGYPT: MARKET, BY FUEL TYPE, 2020–2023 (USD MILLION)
                                                         TABLE 209 EGYPT: MARKET, BY FUEL TYPE, 2024–2029 (USD MILLION)
                                                         TABLE 210 EGYPT: MARKET, BY POWER OUTPUT, 2020–2023 (USD MILLION)
                                                         TABLE 211 EGYPT: MARKET, BY POWER OUTPUT, 2024–2029 (USD MILLION)
                       10.6.6.3 Nigeria
                                   10.6.6.3.1 Increasing demand for reliable power due to frequent grid outages
                                                         TABLE 212 NIGERIA: MARKET, BY FUEL TYPE, 2020–2023 (USD MILLION)
                                                         TABLE 213 NIGERIA: MARKET, BY FUEL TYPE, 2024–2029 (USD MILLION)
                                                         TABLE 214 NIGERIA: MARKET, BY POWER OUTPUT, 2020–2023 (USD MILLION)
                                                         TABLE 215 NIGERIA: MARKET, BY POWER OUTPUT, 2024–2029 (USD MILLION)
                       10.6.6.4 Rest of Middle East & Africa
                                   TABLE 216 REST OF MIDDLE EAST & AFRICA: MARKET, BY FUEL TYPE,  2020–2023 (USD MILLION)
                                   TABLE 217 REST OF MIDDLE EAST & AFRICA: MARKET, BY FUEL TYPE,  2024–2029 (USD MILLION)
                                   TABLE 218 REST OF MIDDLE EAST & AFRICA: MARKET, BY POWER OUTPUT,  2020–2023 (USD MILLION)
                                   TABLE 219 REST OF MIDDLE EAST & AFRICA: MARKET, BY POWER OUTPUT,  2024–2029 (USD MILLION)
 
11 COMPETITIVE LANDSCAPE (Page No. - 187)
     11.1 KEY PLAYER STRATEGIES 
               TABLE 220 OVERVIEW OF KEY STRATEGIES ADOPTED BY TOP PLAYERS, 2020–2023
     11.2 MARKET SHARE ANALYSIS OF TOP FIVE PLAYERS 
               TABLE 221 GAS ENGINES MARKET: DEGREE OF COMPETITION
               FIGURE 44 GAS ENGINE MARKET SHARE ANALYSIS, 2023
     11.3 REVENUE ANALYSIS OF TOP FIVE MARKET PLAYERS 
               FIGURE 45 TOP PLAYERS IN MARKET FROM 2018 TO 2022
     11.4 COMPANY EVALUATION MATRIX 
             11.4.1 STARS
             11.4.2 PERVASIVE PLAYERS
             11.4.3 EMERGING LEADERS
             11.4.4 PARTICIPANTS
                       FIGURE 46 COMPANY EVALUATION MATRIX: MARKET, 2023
     11.5 BRAND/PRODUCT COMPARISON 
     11.6 GAS ENGINES MARKET: COMPANY FOOTPRINT 
               TABLE 222 BY FUEL TYPE: COMPANY FOOTPRINT
               TABLE 223 BY END-USE INDUSTRY: COMPANY FOOTPRINT
               TABLE 224 BY APPLICATION: COMPANY FOOTPRINT
               TABLE 225 POWER RATING: COMPANY FOOTPRINT
               TABLE 226 REGION: COMPANY FOOTPRINT
               TABLE 227 COMPANY FOOTPRINT
     11.7 START-UP/SME EVALUATION MATRIX, 2023 
             11.7.1 PROGRESSIVE COMPANIES
             11.7.2 RESPONSIVE COMPANIES
             11.7.3 DYNAMIC COMPANIES
             11.7.4 STARTING BLOCKS
                       FIGURE 47 MARKET: START-UP/SME EVALUATION QUADRANT, 2023
             11.7.5 COMPETITIVE BENCHMARKING
                       11.7.5.1 Detailed list of key start-ups
                                   TABLE 228 DETAILED LIST OF KEY START-UPS
                       11.7.5.2 Competitive benchmarking of key start-ups
                                   TABLE 229 COMPETITIVE BENCHMARKING OF KEY START-UPS
     11.8 VALUATION AND FINANCIAL METRICS OF KEY GAS ENGINES MARKET PLAYERS 
               FIGURE 48 EV/EBITDA OF KEY VENDORS
               FIGURE 49 COMPANY VALUATION OF KEY VENDORS
     11.9 COMPETITIVE SCENARIO 
               TABLE 230 GAS ENGINES MARKET: PRODUCT LAUNCHES, 2020–2023
               TABLE 231 MARKET: DEALS, 2020–2023
               TABLE 232 MARKET: EXPANSION, 2020–2023
 
12 COMPANY PROFILES (Page No. - 210)
     12.1 KEY PLAYERS 
(Business Overview, Products/Solutions/Services offered, Recent Developments, MnM View)*
             12.1.1 CATERPILLAR
                       TABLE 233 CATERPILLAR: COMPANY OVERVIEW
                       FIGURE 50 CATERPILLAR: COMPANY SNAPSHOT (2023)
                       TABLE 234 CATERPILLAR: PRODUCTS OFFERED
                       TABLE 235 CATERPILLAR: PRODUCT LAUNCHES
                       TABLE 236 CATERPILLAR: DEALS
                       TABLE 237 CATERPILLAR: OTHER DEVELOPMENTS
             12.1.2 WÄRTSILÄ
                       TABLE 238 WÄRTSILÄ: BUSINESS OVERVIEW
                       FIGURE 51 WÄRTSILÄ: COMPANY SNAPSHOT (2023)
                       TABLE 239 WÄRTSILÄ: PRODUCTS OFFERED
                       TABLE 240 WÄRTSILÄ: PRODUCT LAUNCHES
                       TABLE 241 WÄRTSILÄ: DEALS
             12.1.3 ROLLS-ROYCE HOLDINGS
                       TABLE 242 ROLLS-ROYCE HOLDINGS: BUSINESS OVERVIEW
                       FIGURE 52 ROLLS-ROYCE HOLDINGS: COMPANY SNAPSHOT (2023)
                       TABLE 243 ROLLS-ROYCE HOLDINGS: PRODUCTS OFFERED
                       TABLE 244 ROLLS-ROYCE HOLDINGS: PRODUCT LAUNCHES
                       TABLE 245 ROLLS-ROYCE HOLDINGS: DEALS
                       TABLE 246 ROLLS-ROYCE HOLDINGS: OTHER DEVELOPMENTS
             12.1.4 CUMMINS
                       TABLE 247 CUMMINS: BUSINESS OVERVIEW
                       FIGURE 53 CUMMINS: COMPANY SNAPSHOT (2023)
                       TABLE 248 CUMMINS: PRODUCTS OFFERED
                       TABLE 249 CUMMINS: PRODUCT LAUNCHES
                       TABLE 250 CUMMINS: DEALS
             12.1.5 VOLKSWAGEN (MAN ENERGY SOLUTIONS)
                       TABLE 251 VOLKSWAGEN (MAN ENERGY SOLUTIONS): BUSINESS OVERVIEW
                       FIGURE 54 VOLKSWAGEN (MAN ENERGY SOLUTIONS): COMPANY SNAPSHOT (2023)
                       TABLE 252 VOLKSWAGEN (MAN ENERGY SOLUTIONS): PRODUCTS OFFERED
                       TABLE 253 VOLKSWAGEN (MAN ENERGY SOLUTIONS): PRODUCT LAUNCHES
                       TABLE 254 VOLKSWAGEN (MAN ENERGY SOLUTIONS): DEALS
             12.1.6 SIEMENS ENERGY
                       TABLE 255 SIEMENS ENERGY: BUSINESS OVERVIEW
                       FIGURE 55 SIEMENS ENERGY: COMPANY SNAPSHOT (2023)
                       TABLE 256 SIEMENS ENERGY: PRODUCTS OFFERED
                       TABLE 257 SIEMENS ENERGY: DEALS
             12.1.7 MITSUBISHI HEAVY INDUSTRIES, LTD.
                       TABLE 258 MITSUBISHI HEAVY INDUSTRIES, LTD.: BUSINESS OVERVIEW
                       FIGURE 56 MITSUBISHI HEAVY INDUSTRIES, LTD.: COMPANY SNAPSHOT (2023)
                       TABLE 259 MITSUBISHI HEAVY INDUSTRIES, LTD.: PRODUCTS OFFERED
                       TABLE 260 MITSUBISHI HEAVY INDUSTRIES, LTD.: DEALS
             12.1.8 INNIO
                       TABLE 261 INNIO: BUSINESS OVERVIEW
                       TABLE 262 INNIO: PRODUCTS OFFERED
                       TABLE 263 INNIO: PRODUCT LAUNCHES
                       TABLE 264 INNIO: DEALS
             12.1.9 KAWASAKI HEAVY INDUSTRIES, LTD.
                       TABLE 265 KAWASAKI HEAVY INDUSTRIES, LTD.: BUSINESS OVERVIEW
                       FIGURE 57 KAWASAKI HEAVY INDUSTRIES, LTD.: COMPANY SNAPSHOT (2023)
                       TABLE 266 KAWASAKI HEAVY INDUSTRIES, LTD.: PRODUCTS OFFERED
                       TABLE 267 KAWASAKI HEAVY INDUSTRIES, LTD.: PRODUCT LAUNCHES
                       TABLE 268 KAWASAKI HEAVY INDUSTRIES, LTD.: DEALS
             12.1.10 NINGBO C.S.I. POWER & MACHINERY GROUP CO., LTD.
                                   TABLE 269 NINGBO C.S.I. POWER & MACHINERY GROUP CO., LTD.: BUSINESS OVERVIEW
                                   TABLE 270 NINGBO C.S.I. POWER & MACHINERY GROUP CO., LTD: PRODUCTS OFFERED
             12.1.11 IHI POWER SYSTEMS
                                   TABLE 271 IHI POWER SYSTEMS: BUSINESS OVERVIEW
                                   TABLE 272 IHI POWER SYSTEMS: PRODUCTS OFFERED
             12.1.12 JFE ENGINEERING CORPORATION
                                   TABLE 273 JFE ENGINEERING CORPORATION: BUSINESS OVERVIEW
                                   TABLE 274 JFE ENGINEERING CORPORATION: PRODUCTS OFFERED
             12.1.13 LIEBHERR
                                   TABLE 275 LIEBHERR: BUSINESS OVERVIEW
                                   TABLE 276 LIEBHERR: PRODUCTS OFFERED
             12.1.14 HYUNDAI HEAVY INDUSTRIES CO., LTD.
                                   TABLE 277 HYUNDAI HEAVY INDUSTRIES CO., LTD.: BUSINESS OVERVIEW
                                   FIGURE 58 HYUNDAI HEAVY INDUSTRIES, LTD.: COMPANY SNAPSHOT (2022)
                                   TABLE 278 HYUNDAI HEAVY INDUSTRIES CO., LTD.: PRODUCTS OFFERED
                                   TABLE 279 HYUNDAI HEAVY INDUSTRIES CO., LTD.: PRODUCT LAUNCHES
             12.1.15 JINAN LVNENG POWER MACHINERY EQUIPMENT CO., LTD
                                   TABLE 280 JINAN LVNENG POWER MACHINERY EQUIPMENT CO., LTD.: BUSINESS OVERVIEW
                                   TABLE 281 JINAN LVNENG POWER MACHINERY EQUIPMENT CO., LTD: PRODUCTS OFFERED
     12.2 OTHER PLAYERS 
             12.2.1 R SCHMITT ENERTEC
                       TABLE 282 R SCHMITT ENERTEC: BUSINESS OVERVIEW
                       TABLE 283 R SCHMITT ENERTEC: PRODUCTS OFFERED
             12.2.2 CNPC JICHAI POWER COMPLEX
                       TABLE 284 CNPC JICHAI POWER COMPLEX: BUSINESS OVERVIEW
                       TABLE 285 CNPC JICHAI POWER COMPLEX: PRODUCTS OFFERED
             12.2.3 FAIRBANKS MORSE
                       TABLE 286 FAIRBANKS MORSE: BUSINESS OVERVIEW
                       TABLE 287 FAIRBANKS MORSE: PRODUCTS OFFERED
             12.2.4 GOOGOL ENGINE TECH
                       TABLE 288 GOOGOL ENGINE TECH: BUSINESS OVERVIEW
                       TABLE 289 GOOGOL ENGINE TECH: PRODUCTS OFFERED
             12.2.5 BAUDOUIN
                       TABLE 290 BAUDOUIN: BUSINESS OVERVIEW
                       TABLE 291 BAUDOUIN: PRODUCTS OFFERED
             12.2.6 DOOSAN
             12.2.7 YANMAR
             12.2.8 KOHLER CO.
             12.2.9 DEUTZ AG
             12.2.10 ACHATES POWER INC.
*Details on Business Overview, Products/Solutions/Services offered, Recent Developments, MnM View might not be captured in case of unlisted companies.
 
13 APPENDIX (Page No. - 274)
     13.1 INSIGHTS FROM INDUSTRY EXPERTS 
     13.2 DISCUSSION GUIDE 
     13.3 KNOWLEDGESTORE: MARKETSANDMARKETS’  SUBSCRIPTION PORTAL 
     13.4 CUSTOMIZATION OPTIONS 
     13.5 RELATED REPORTS 
     13.6 AUTHOR DETAILS 

This study undertook extensive efforts to determine the current size of the gas engine market. It began with a thorough secondary research phase aimed at gathering data on the market, related markets, and the broader industry landscape. Subsequently, the collected data, assumptions, and calculations underwent meticulous validation through primary research, which involved consultations with industry experts across the entire value chain. The assessment of the overall market size was conducted through a tailored analysis for each country. Following this, a detailed examination of the market occurred, and the data was cross-referenced to estimate the sizes of various segments and sub-segments within the market. This two-phased approach, incorporating both secondary and primary research methodologies, enhances the reliability and accuracy of the study's findings.

Secondary Research

Throughout this research study, an extensive range of secondary sources was utilized, comprising directories, databases, and respected references such as Hoover's, Bloomberg BusinessWeek, Factiva, World Bank, the US Department of Energy (DOE), and the International Energy Agency (IEA). These sources played a crucial role in gathering valuable data essential for conducting a thorough analysis of the global gas engine market. Covering technical, market-oriented, and commercial aspects, these secondary sources significantly contributed to the breadth and depth of the study. Furthermore, additional secondary sources included annual reports, press releases, investor presentations, whitepapers, authoritative publications, articles authored by reputable experts, information from industry associations, trade directories, and various database resources. The wide array of secondary sources utilized ensures a robust and well-informed foundation for the research study.

Primary Research

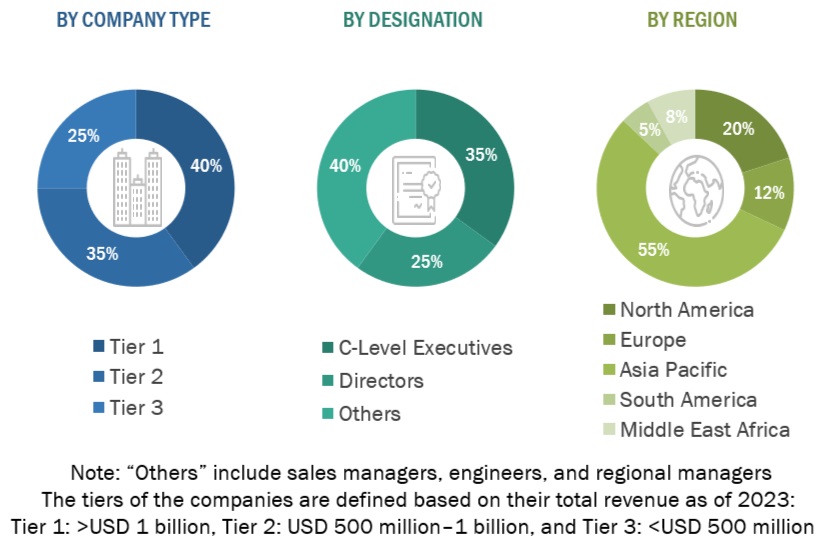
The gas engine market involves multiple stakeholders throughout its supply chain, including component manufacturers, product manufacturers/assemblers, service providers, distributors, and end-users. Industrial end-users primarily drive market demand, with increasing requirements from transmission and distribution utilities also contributing significantly to market growth. On the supply side, a noticeable trend is the heightened demand for contracts from the industrial sector, alongside a notable prevalence of mergers and acquisitions among major industry players. To gain a comprehensive understanding of the market, both qualitatively and quantitatively, a variety of primary sources from both the supply and demand sides were interviewed. The breakdown below outlines the primary respondents who played a crucial role in providing insights for the research study.
Gas Engine  Market Size, and Share

To know about the assumptions considered for the study, download the pdf brochure

Market Size Estimation

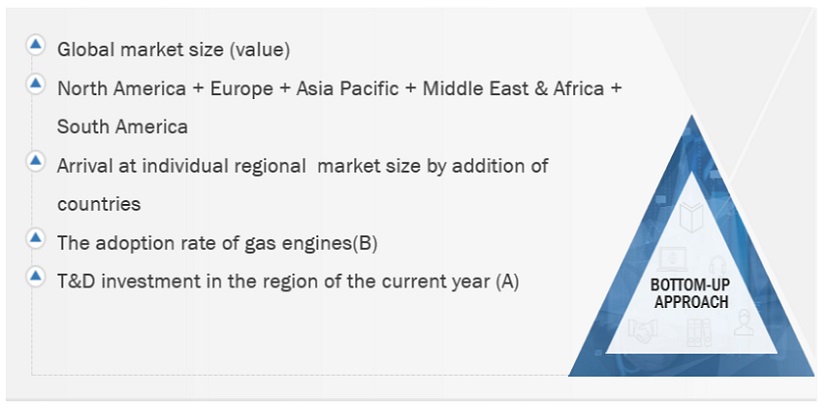
The gas engine market size was meticulously estimated and validated using a bottom-up approach. This method was rigorously used to determine the dimensions of various market subsegments. The research process includes the following key stages.

  • This approach looked at national and regional production figures for all types of gas engines.
  • Extensive secondary and primary research was conducted to gain a comprehensive understanding of the global market environment for various types of engines.
  • Several primary interviews were conducted with leading gas engine system development experts, including major OEMs and Tier I suppliers.
  • When estimating and projecting market size, qualitative factors such as market drivers, constraints, opportunities, and challenges are taken into account.

Global Gas Engine Market Size: Bottom-Up Approach
Gas Engine  Market Bottom Up Approach

To know about the assumptions considered for the study, Request for Free Sample Report

Global Gas Engine Market Size: Top-Down Approach

Gas Engine  Market Top Down Approach

Data Triangulation

The process of establishing the overall market size involved employing the methodologies described earlier, which included segmenting the market into various segments and subsegments. To conclude the comprehensive market analysis and obtain accurate statistics for each market segment and subsegment, data triangulation and market segmentation techniques were applied as deemed suitable. Data triangulation entailed a thorough assessment of diverse factors and trends from both the demand and supply perspectives within the ecosystem of the gas engine market.

Market Definition

A gas engine, also known as a combustion engine or reciprocating engine, is a type of internal combustion engine that operates on a gaseous fuel, such as natural gas, propane, or biogas. Gas engines convert the chemical energy of the fuel into mechanical energy through a series of controlled explosions within cylinders. This mechanical energy is then utilized to power various applications, including electricity generation, mechanical drive systems, and transportation. Gas engines are renowned for their versatility, reliability, and efficiency, making them widely utilized in industries ranging from power generation and manufacturing to transportation and agriculture. They offer advantages such as lower emissions, reduced fuel costs, and greater fuel flexibility compared to traditional diesel engines, making them an attractive choice for applications requiring clean and efficient power solutions.

Key Stakeholders

  • Government Utility Providers
  • Independent Power Producers
  • Engine manufacturers
  • Power equipment and garden tool manufacturers
  • Consulting companies in the energy & power sector
  • Distribution utilities
  • Government and research organizations
  • Organizations, forums, and associations
  • Raw material suppliers
  • State and national regulatory authorities
  • Engine manufacturers, distributors, and suppliers
  • Engines original equipment manufacturers (OEMs)

Objectives of the Study

  • The gas engine market will be defined, characterised, segmented, and projected using parameters such as fuel type, power output, application, and end user.
  • To forecast market sizes in North America, South America, Europe, Asia Pacific, the Middle East, and Africa, as well as the major countries in each of these five regions.
  • To provide comprehensive insights into the factors driving market drivers, restraints, opportunities, and challenges unique to the industry.
  • To strategically examine each subsegment's growth trends, future potential, and overall market share.
  • To evaluate market prospects for potential buyers and the competitive landscape for industry leaders.
  • To thoroughly examine the market shares and core competencies of the major players and create strategic profiles for them.
  • To monitor and evaluate competitive developments in the gas engine market, such as partnerships, agreements, sales contracts, new product launches, acquisitions, joint ventures, contracts, expansions, and investments.
  • The market for gas engines is evaluated in this report.

Available Customization

With the given market data, MarketsandMarkets offers customizations based on the company’s specific needs. The following customization options are available for the report:

Product Analysis

  • Product Matrix, which provides a detailed comparison of the product portfolio of each company

Company Information

  • Detailed analyses and profiling of additional market players (up to 5)
Custom Market Research Services

We will customize the research for you, in case the report listed above does not meet with your exact requirements. Our custom research will comprehensively cover the business information you require to help you arrive at strategic and profitable business decisions.

Request Customization

Instant Answers with GPT - Ask Now!

Ask real questions. Get complete answers !
Report Code
EP 4541
Published ON
Mar, 2024
Choose License Type
BUY NOW
  • SHARE
X
Request Customization
Speak to Analyst
Speak to Analyst
OR FACE-TO-FACE MEETING
PERSONALIZE THIS RESEARCH
  • Triangulate with your Own Data
  • Get Data as per your Format and Definition
  • Gain a Deeper Dive on a Specific Application, Geography, Customer or Competitor
  • Any level of Personalization
REQUEST A FREE CUSTOMIZATION
LET US HELP YOU!
  • What are the Known and Unknown Adjacencies Impacting the Gas Engine Market
  • What will your New Revenue Sources be?
  • Who will be your Top Customer; what will make them switch?
  • Defend your Market Share or Win Competitors
  • Get a Scorecard for Target Partners
CUSTOMIZED WORKSHOP REQUEST
  • Call Us
  • +1-888-600-6441 (Corporate office hours)
  • +1-888-600-6441 (US/Can toll free)
  • +44-800-368-9399 (UK office hours)
CONNECT WITH US
ABOUT TRUST ONLINE
©2024 MarketsandMarkets Research Private Ltd. All rights reserved
DMCA.com Protection Status
Website Feedback