Gene Expression Analysis Market

Gene Expression Analysis Market by Product and Services (Consumables (Reagents, DNA chips), Instruments (PCR, NGS), Services (Gene Expression Profiling)), End User (Pharma and Biotech Companies, Research Centers) - Global Forecasts to 2023

Report Code: BT 2236 Nov, 2018, by marketsandmarkets.com

The market for gene expression analysis market is expected reach USD 4.9 billion by 2023, at a CAGR of 8.8% during the forecast period. Growth in the gene expression analysis market is primarily driven by factors such as rising prevalence of cancer, growing application areas of genomics, and the availability of gene expression databases.

 Gene Expression Analysis Market

By product and services, the consumables segment is expected grow at the highest rate during the forecast period

The increasing volume of genetic tests in drug discovery, biomarker discovery, and pharmacogenomics applications are driving the growth of the consumables market. The increasing installation of NGS and PCR equipment worldwide will significantly boost the demand for consumables.

By end user, pharmaceutical and biotechnology companies are expected to be the largest contributor to the gene expression analysis market

Pharmaceutical and biotechnology companies utilize gene expression analysis products and services to achieve their clinical research goals, such as drug discovery and development and biotech research. Biopharmaceutical companies focus on developing targeted therapies, especially for the treatment of cancer, complex diseases, and rare genetic disorders. CROs offer a number of gene expression analysis services, including gene expression profiling services such as NGS. This is increasing the demand for gene expression analysis services offered by CROs.

 Gene Expression Analysis Market

North America is expected to hold a significant share in the gene expression analysis market during the forecast period

Factors such as the development of gene therapy, focus on gene expression studies, government initiatives, and the availability of funding for NGS research are driving the growth of the gene expression analysis market in North America.

Gene Expression Analysis Market Growth Dynamics

Drivers: Decreasing Cost of Sequencing

The high cost associated with sequencing posed as a major challenge for market growth in the last decade. In 2003, the first human genome sequenced by the Human Genome Project required funding of ~USD 2.7 billion. However, several technological developments have taken place in the field of genomics, which were aimed at increasing the speed and reducing the expenses associated with sequencing.

The NHGRI (National Human Genome Research Institute, US) has tracked the sequencing costs at its various funded genome sequencing centers for many years and estimated the cost of genome sequencing in the years following the Human Genome Project. Based on this data, the NHGRI estimated that in 2006, it would have likely cost over USD 20–25 million for generating a finished human genome sequence, while by late 2015, the cost to generate a high-quality whole human genome sequence draft had fallen below USD 1,500 and the cost to generate a whole-exome sequence was generally below USD 1,000.

Major players operating in the field of gene expression are constantly bringing new and advanced technologies to the market. This is enabling the launch of more affordable testing services in the market. For instance, Illumina (US) launched the NovaSeq Series in January 2017, which is expected to enable the reduction of the sequencing cost of a genome/transcriptome to as less as USD 100 in the coming years.

The reduced cost of sequencing is expected to offer an array of opportunities for stakeholders in the healthcare industry. For instance, the low cost of sequencing would enable researchers to sequence the genomes of thousands of individuals, which would result in an improved data set to be used for the identification of the causes of illnesses. Also, the lower cost would enable individuals with rare diseases to be analyzed and treated quickly. Thus, the significant reduction in the cost of sequencing is expected to be a major factor driving the growth of the gene expression analysis market.

Restraints: Shortage of Trained Professionals

Gene expression data can be used for various applications, such as pharmacogenomics, diagnostics, and toxicogenomics. However, the major challenge lies in the analysis of the colossal volume of gene expression data. In certain cases, technological advancements have enabled the instruments in use to present an analysis; however, the interpretation is still dependent on the reader. Due to the high complexity involved and the need for in-depth knowledge in the field of genomics, it is necessary to hire professionals in the field of genomics to analyze and interpret the results of gene expression data. However, there is a shortage of skilled professionals in the genomics field in major markets across the globe. According to a 2017 article published by the Shoreline Community College, a skill gap in the medical workforce is creating a severe need for immuno-biotechnology training in the US, which includes work in molecular biology.

The governments of Australia and New Zealand have identified biotechnology as an integral part of their long-term future economic growth. However, these countries are facing a shortage of biotechnologists who have the relevant genetic sciences skills. Owing to this, authorities in these countries are focusing on attracting foreign nationals with skills in the field of biotechnology. Also, over the last few years, jobs in this field have appeared on the long-term shortage list of their immigration postings. Similarly, India has a strong focus on developing its biotechnology industry. However, the country is facing a shortage of professionals in the field of biotechnology. For instance, according to a 2016 survey conducted by the Federation of Indian Chambers of Commerce & Industry (FICCI), India faces an acute shortage of nearly 80% of Doctorate and Post Doctorate Scientists, a 20% shortage of people with a Master’s degree, and a production staff shortage of 18% in the biotechnology sector.

Opportunities: Emerging Countries to Provide Growth Opportunities

Emerging countries, such as India, China, and Brazil, are expected to provide potential growth opportunities to players operating in the gene expression analysis market. Several established players in the market are increasingly entering into collaborative agreements with organizations in emerging countries such as China. For instance, in January 2018, Illumina partnered with KingMed Diagnostics, a clinical testing firm based in China, in order to develop next-generation sequencing-based oncology and hereditary disease diagnostics (based on Illumina’s MiniSeq technology) for the Chinese market. Similarly, in September 2015, China-based Amoy Diagnostics Co. Ltd. collaborated with Illumina, Inc. (US) for providing precision medicine and targeted therapies in China.

Several companies based in India are receiving funding from global investors, which is enabling them to offer new and advanced services in the market. For instance, in December 2016, the India-based startup— Core Diagnostics Pvt. Ltd.—successfully raised close to USD 11.5 million (INR 84 crores) in a funding led by Eight Roads Ventures and F-Prime Capital Partners (global venture capital investors based in the US). Also, Biocon Ltd., one of India’s largest companies in the biotechnology sector, has reported significant growth in the early part of this decade—37.9% from 2014 to 2017.

Other countries such as Qatar, Singapore, and Brazil are also witnessing significant developments in their respective genomics and personalized medicine sectors. In 2017, the Qatar National Research Fund (QNRF) and the Qatar Biobank, in collaboration with the Qatar Genome Project (QGP), launched an annual grant program—Pathway Towards Personalized Medicine (PPM)—which aimed to support and encourage genetic research activities in the country. Similarly, an initiative called the Genome Asia 100K, started by Macrogen, Inc., (a South Korea-based biotechnology firm) at the Nanyang Technological University, Singapore in February 2016, aims at creating phased reference genomes for all major Asian ethnic groups to understand the population history and substructure of the region. In Brazil, the government invested ~USD 4.44 billion (BRL 10 billion) in 2016 to fund about 70% of the biotechnology companies in the country.

Active collaboration efforts to improve the quality of healthcare, growing domestic biotechnology sectors, and the availability of government funding for research in emerging markets are some of the factors that are providing growth opportunities to players operating in the gene expression analysis market.

Get online access to the report on the World's First Market Intelligence Cloud

  • Easy to Download Historical Data & Forecast Numbers
  • Company Analysis Dashboard for high growth potential opportunities
  • Research Analyst Access for customization & queries
  • Competitor Analysis with Interactive dashboard
  • Latest News, Updates & Trend analysis
Request Sample

Scope of the Report

Report Metric

Details

Market size available for years

2016–2023

Base year considered

2017

Forecast period

2018–2023

Forecast units

Billion (USD)

Segments covered

Products, Services, End User, and Region

Geographies covered

North America (US & Canada) Europe (Germany, UK, France, Italy, Spain, Rest of Europe (RoE)), APAC ( Japan, Australia, China, India, Rest of Asia (RoAPAC)), Rest of the World (RoW)

Companies covered

Thermo Fisher Scientific Inc. (US), QIAGEN (The Netherlands), Illumina (Sweden), Bio-Rad Laboratories (US). Major 15 players covered.

This research report categorizes the gene expression market based on product & service, end user, and region.

By Products & Services

  • Consumables
    • Reagents
    • DNA Chips
  • Instruments
    • PCR
    • NGS
    • DNA Microarray
    • Others
  • Services
    • Gene Expression Profiling Services
      • Sequencing Services
      • Other Services
    • Bioinformatics Solutions

By End User

  • Pharmaceutical and Biotech companies
  • Academic Institutes and Research Centers
  • Others

By Region

  • North America
    • US
    • Canada
  • Europe
    • Germany
    • France
    • UK
    • Italy
    • Spain
    • RoE
  • Asia Pacific
    • Japan
    • China
    • Australia
    • India
    • RoAPAC
  • Rest of the World

Gene Expression Analysis Market Key Players

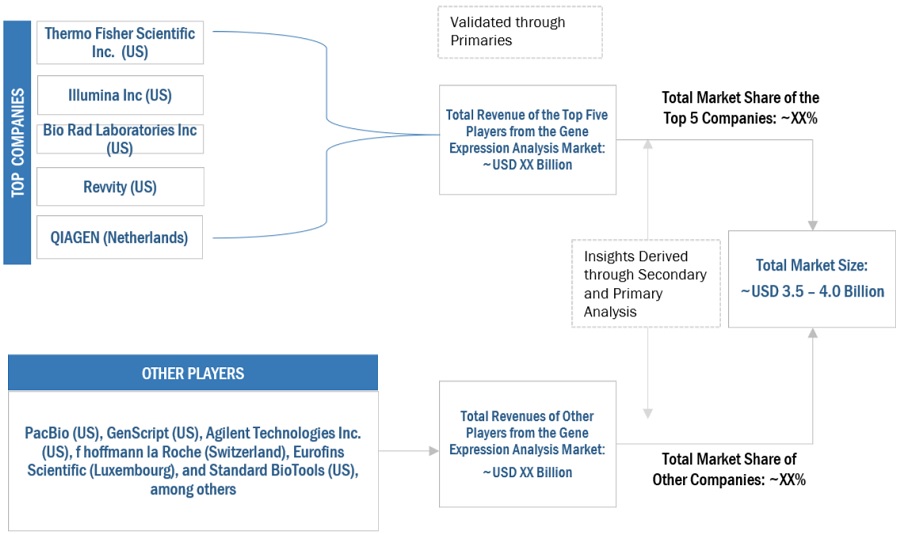
The major vendors in the global gene expression analysis market are Illumina, Inc. (US), Thermo Fisher Scientific, Inc. (US), and Bio-Rad Laboratories, Inc. (US). Other players involved in this market are F. Hoffmann-La Roche Ltd. (Switzerland), GE Healthcare (UK), Pacific Biosciences of California, Inc. (US), BGI (China), PerkinElmer (US), Agilent Technologies Inc. (US), QIAGEN N. V. (Netherlands), Oxford Gene Technologies, Ltd. (UK), and Eurofins Scientific (Luxembourg).

Recent Developments

  • In January 2017, Biorad acquired of RainDance Technologies, a droplet-based PCR systems manufacturer. RainDance Technologies has a more focused portfolio, primarily known for its droplet-based technologies for digital PCR (dPCR).
  • In March 2016, Thermo Fisher Scientific completes acquisition of Affymetrix, a leading provider of cellular and genetic analysis products.

Key questions addressed by the report:

  • Which of the product segment will dominate the gene expression analysis market in future?
  • Emerging countries have immense opportunities for the growth and adoption of gene expression analysis, will this scenario continue in the next five years?
  • Where will all the advancements in products offered by various companies take the industry in the mid to long term?
  • Low sequencing costs in the emerging market is impacting the growth for developed markets. How will pricing difference impact the overall market?
  • What are the upcoming technologies in the gene expression analysis market?

To speak to our analyst for a discussion on the above findings, click Speak to Analyst

Table of Contents

1 Introduction (Page No. - 18)
    1.1 Objectives of The Study
    1.2 Market Definition
    1.3 Market Scope
           1.3.1 Markets Covered
           1.3.2 Years Considered for The Study
    1.4 Currency
    1.5 Limitations
    1.6 Stakeholders

2 Research Methodology (Page No. - 21)
    2.1 Research Data
           2.1.1 Secondary Data
                    2.1.1.1 Key Data From Secondary Sources
           2.1.2 Primary Data
                    2.1.2.1 Key Data From Primary Sources
                    2.1.2.2 Key Industry Insights
    2.2 Market Size Estimation Methodology
    2.3 Market Data Estimation and Triangulation
    2.4 Assumptions for The Study

3 Executive Summary (Page No. - 30)

4 Premium Insights (Page No. - 33)

    4.1 Gene Expression Analysis Market Overview
    4.2 European Gene Expression Analysis Market,By Product & Service
    4.3 Gene Expression Analysis Market,By Product & Service,2018 Vs. 2023
    4.4 Gene Expression Analysis Market,By End User,2018 Vs. 2023
    4.5 Geographic Snapshot of The Gene Expression Analysis Market

5 Market Overview (Page No. - 37)
    5.1 Introduction
    5.2 Market Dynamics
           5.2.1 Drivers
                    5.2.1.1 Decreasing Cost of Sequencing
                    5.2.1.2 Technological Advancements
                    5.2.1.3 Rising Prevalence of Cancer
                    5.2.1.4 Availability of Government Funding
                    5.2.1.5 Novel Technologies to Aid Gene Expression Studies
                    5.2.1.6 Growing Application Areas of Gene Expression
                    5.2.1.7 Availability of Gene Expression Databases
           5.2.2 Restraints
                    5.2.2.1 High Cost of Instruments
                    5.2.2.2 Shortage of Trained Professionals
           5.2.3 Opportunities
                    5.2.3.1 Emerging Countries to Provide Growth Opportunities
                    5.2.3.2 Growing Use of Gene Expression Analysis in Precision Medicine
           5.2.4 Challenges
                    5.2.4.1 Currency Devaluation

6 Gene Expression Analysis Market,By Product & Service (Page No. - 45)
    6.1 Introduction
    6.2 Consumables
           6.2.1 Reagents
                    6.2.1.1 Growth in Overall Research Activity and Instrument Usage Fuels The Demand for Reagents
           6.2.2 Dna Chips
                    6.2.2.1 Technique Limitations and Growing Preference for Ngs Have Affected The Demand for Dna Chips
    6.3 Instruments
           6.3.1 Pcr Instruments
                    6.3.1.1 Advent of Enhanced Ddpcr to Aid The Pcr Market for Gene Expression
           6.3.2 Next-Generation Sequencing Instruments
                    6.3.2.1 Ngs to Overtake Microarrays Market in The Coming Years
           6.3.3 Dna Microarrays
                    6.3.3.1 Despite Sluggish Growth Rate,Dna Microarrays Will Witness Sustained Use in The Coming Years
           6.3.4 Other Instruments
    6.4 Services
           6.4.1 Gene Expression Profiling Services
                    6.4.1.1 Sequencing Services
                               6.4.1.1.1 Reduction in Sequencing Costs and Technological Advancements Will Drive Demand for Services
                    6.4.1.2 Other Services
           6.4.2 Bioinformatics Solutions
                    6.4.2.1 Bioinformatics Solutions Enable Researchers to Manage and Analyze Large Volumes of Data

7 Gene Expression Analysis Market,By End User (Page No. - 61)
    7.1 Introduction
    7.2 Pharmaceutical and Biotechnology Companies
           7.2.1 Increasing Clinical Research on Drug Discovery and Biomarker Development to Support The Growth of This End-User Segment
    7.3 Academic Institutes and Research Centers
           7.3.1 Growing Government Funding to Drive The Adoption of Gene Expression Analysis Techniques in Academic Institutes and Research Centers
    7.4 Other End Users

8 Gene Expression Analysis Market,By Region (Page No. - 67)
    8.1 Introduction
    8.2 North America
           8.2.1 Us
                    8.2.1.1 Approvals of Gene Therapy Products and Favorable Investments Have Driven R&D in This Sector
           8.2.2 Canada
                    8.2.2.1 Recent Cad 21-Million Investment in Gapp Will Boost R&D Into Gene-Based Technologies
    8.3 Europe
           8.3.1 Uk
                    8.3.1.1 Largest European Market Segment is A Hub for Ngs Players and Characterized By High Availability of Funds
           8.3.2 Germany
                    8.3.2.1 Strong Academic Base and High Scale of Research Ensure Sustained Demand for Market Products
           8.3.3 Italy
                    8.3.3.1 Government Funding for Life Science Research to Aid The Italian Market
           8.3.4 Spain
                    8.3.4.1 an Emerging Market,But Expected to Witness Strong Growth in The Coming Years
           8.3.5 France
                    8.3.5.1 Initiatives Such as The French Plan for Genomic Medicine 2025 Indicate A Favorable Market Environment
           8.3.6 Rest of Europe
    8.4 Asia Pacific
           8.4.1 China
                    8.4.1.1 Domestic Manufacturing of Sequencing Systems to Drive Market Growth in China
           8.4.2 Japan
                    8.4.2.1 Increasing Government Focus on Cancer Research to Drive Market Growth in Japan
           8.4.3 Australia
                    8.4.3.1 Increasing Research Activities in The Fields of Genetics and Genomics to Aid Market Growth in Australia
           8.4.4 India
                    8.4.4.1 Decreasing Sequencing Cost and Growing Prevalence of Target Diseases to Support Market Growth in India
           8.4.5 Rest of Asia Pacific (Roapac)
    8.5 Rest of The World (Row)
           8.5.1 Greater Adoption of Genetic Testing and Genomic Analysis to Drive Market Growth in This Region

9 Competitive Landscape (Page No. - 128)
    9.1 Overview
    9.2 Market Ranking of Players,2017
    9.3 Competitive Scenario
           9.3.1 Product Launches & Approvals
           9.3.2 Acquisitions
           9.3.3 Partnerships,Agreements,& Collaborations

10 Company Profiles (Page No. - 132)
     10.1 Thermo Fisher Scientific,Inc.
(Business Overview,Products & Services,Key Insights,Recent Developments,Swot Analysis,Mnm View)*
     10.2 Bio-Rad Laboratories,Inc.
     10.3 Illumina,Inc.
     10.4 Agilent Technologies
     10.5 F. Hoffmann-La Roche
     10.6 Ge Healthcare
     10.7 Perkinelmer,Inc.
     10.8 Qiagen N.V.
     10.9 Oxford Gene Technology
     10.1 Pacific Biosciences of California,Inc.
           10.11 Bgi
           10.12 Eurofins Scientific
*Details on Business Overview,Products & Services,Key Insights,Recent Developments,Swot Analysis,Mnm View Might Not Be Captured in Case of Unlisted Companies

11 Appendix (Page No. - 172)
     11.1 Discussion Guide
     11.2 Knowledge Store: Marketsandmarkets’ Subscription Portal
     11.3 Available Customizations
     11.4 Related Reports
     11.5 Author Details

List of Tables (131 Tables)

Table 1 Gene Expression Analysis Market,By Product & Service,2016–2023 (USD Million)
Table 2 Gene Expression Analysis Consumables Market,By Type,2016–2023 (USD Million)
Table 3 Consumables Market,By Region,2016–2023 (USD Million)
Table 4 Reagents Market,By Region,2016–2023 (USD Million)
Table 5 Dna Chips Market,By Region,2016–2023 (USD Million)
Table 6 Gene Expression Analysis Instruments Market,By Type,2016–2023 (USD Million)
Table 7 Gene Expression Analysis Instruments Market,By Region,2016–2023 (USD Million)
Table 8 Pcr Instruments Market,By Region,2016–2023 (USD Million)
Table 9 Next-Generation Sequencing Instruments Market,By Region,2016–2023 (USD Million)
Table 10 Dna Microarrays Market,By Region,2016–2023 (USD Million)
Table 11 Other Instruments Market,By Region,2016–2023 (USD Million)
Table 12 Gene Expression Analysis Services Market,By Type,2016–2023 (USD Million)
Table 13 Gene Expression Analysis Services Market,By Region,2016–2023 (USD Million)
Table 14 Gene Expression Profiling Services Market,By Type,2016–2023 (USD Million)
Table 15 Gene Expression Profiling Services Market,By Region,2016–2023 (USD Million)
Table 16 Sequencing Services Market,By Region,2016–2023 (USD Million)
Table 17 Other Services Market,By Region,2016–2023 (USD Million)
Table 18 Bioinformatics Solutions Market,By Region,2016–2023 (USD Million)
Table 19 Gene Expression Analysis Market,By End User,2016–2023 (USD Million)
Table 20 Gene Expression Analysis Market for Pharmaceutical and Biotechnology Companies,By Region,2016–2023 (USD Million)
Table 21 Gene Expression Analysis Market for Academic Institutes and Research Centers,By Region,2016–2023 (USD Million)
Table 22 Gene Expression Analysis Market for Other End Users,By Region,2016–2023 (USD Million)
Table 23 Gene Expression Analysis Market,By Region,2016–2023 (USD Million)
Table 24 North America: Gene Expression Analysis Market,By Country,2016–2023 (USD Million)
Table 25 North America: Gene Expression Analysis Market,By Product & Service,2016–2023 (USD Million)
Table 26 North America: Gene Expression Analysis Consumables Market,By Type,2016–2023 (USD Million)
Table 27 North America: Gene Expression Analysis Instruments Market,By Type,2016–2023 (USD Million)
Table 28 North America: Gene Expression Analysis Services Market,By Type,2016–2023 (USD Million)
Table 29 North America: Gene Expression Profiling Services Market,By Type,2016–2023 (USD Million)
Table 30 North America: Gene Expression Analysis Market,By End User,2016–2023 (USD Million)
Table 31 Us: Gene Expression Analysis Market,By Product & Service,2016–2023 (USD Million)
Table 32 Us: Gene Expression Analysis Consumables Market,By Type,2016–2023 (USD Million)
Table 33 Us: Gene Expression Analysis Instruments Market,By Type,2016–2023 (USD Million)
Table 34 Us: Gene Expression Analysis Services Market,By Type,2016–2023 (USD Million)
Table 35 Us: Gene Expression Profiling Services Market,By Type,2016–2023 (USD Million)
Table 36 Us: Gene Expression Analysis Market,By End User,2016–2023 (USD Million)
Table 37 Canada: Gene Expression Analysis Market,By Product & Service,2016–2023 (USD Million)
Table 38 Canada: Gene Expression Analysis Consumables Market,By Type,2016–2023 (USD Million)
Table 39 Canada: Gene Expression Analysis Instruments Market,By Type,2016–2023 (USD Million)
Table 40 Canada: Gene Expression Analysis Services Market,By Type,2016–2023 (USD Million)
Table 41 Canada: Gene Expression Profiling Services Market,By Type,2016–2023 (USD Million)
Table 42 Canada: Gene Expression Analysis Market,By End User,2016–2023 (USD Million)
Table 43 Europe: Gene Expression Analysis Market,By Country,2016–2023 (USD Million)
Table 44 Europe: Gene Expression Analysis Market,By Product & Service,2016–2023 (USD Million)
Table 45 Europe: Gene Expression Analysis Consumables Market,By Type,2016–2023 (USD Million)
Table 46 Europe: Gene Expression Analysis Instruments Market,By Type,2016–2023 (USD Million)
Table 47 Europe: Gene Expression Analysis Services Market,By Type,2016–2023 (USD Million)
Table 48 Europe: Gene Expression Profiling Services Market,By Type,2016–2023 (USD Million)
Table 49 Europe: Gene Expression Analysis Market,By End User,2016–2023 (USD Million)
Table 50 Uk: Gene Expression Analysis Market,By Product & Service,2016–2023 (USD Million)
Table 51 Uk: Gene Expression Analysis Consumables Market,By Type,2016–2023 (USD Million)
Table 52 Uk: Gene Expression Analysis Instruments Market,By Type,2016–2023 (USD Million)
Table 53 Uk: Gene Expression Analysis Services Market,By Type,2016–2023 (USD Million)
Table 54 Uk: Gene Expression Profiling Services Market,By Type,2016–2023 (USD Million)
Table 55 Uk: Gene Expression Analysis Market,By End User,2016–2023 (USD Million)
Table 56 Germany: Gene Expression Analysis Market,By Product & Service,2016–2023 (USD Million)
Table 57 Germany: Gene Expression Analysis Consumables Market,By Type,2016–2023 (USD Million)
Table 58 Germany: Gene Expression Analysis Instruments Market,By Type,2016–2023 (USD Million)
Table 59 Germany: Gene Expression Analysis Services Market,By Type,2016–2023 (USD Million)
Table 60 Germany: Gene Expression Profiling Services Market,By Type,2016–2023 (USD Million)
Table 61 Germany: Gene Expression Analysis Market,By End User,2016–2023 (USD Million)
Table 62 Italy: Gene Expression Analysis Market,By Product & Service,2016–2023 (USD Million)
Table 63 Italy: Gene Expression Analysis Consumables Market,By Type,2016–2023 (USD Million)
Table 64 Italy: Gene Expression Analysis Instruments Market,By Type,2016–2023 (USD Million)
Table 65 Italy: Gene Expression Analysis Services Market,By Type,2016–2023 (USD Million)
Table 66 Italy: Gene Expression Profiling Services Market,By Type,2016–2023 (USD Million)
Table 67 Italy: Gene Expression Analysis Market,By End User,2016–2023 (USD Million)
Table 68 Spain: Gene Expression Analysis Market,By Product & Service,2016–2023 (USD Million)
Table 69 Spain: Gene Expression Analysis Consumables Market,By Type,2016–2023 (USD Million)
Table 70 Spain: Gene Expression Analysis Instruments Market,By Type,2016–2023 (USD Million)
Table 71 Spain: Gene Expression Analysis Services Market,By Type,2016–2023 (USD Million)
Table 72 Spain: Gene Expression Profiling Services Market,By Type,2016–2023 (USD Million)
Table 73 Spain: Gene Expression Analysis Market,By End User,2016–2023 (USD Million)
Table 74 France: Gene Expression Analysis Market,By Product & Service,2016–2023 (USD Million)
Table 75 France: Gene Expression Analysis Consumables Market,By Type,2016–2023 (USD Million)
Table 76 France: Gene Expression Analysis Instruments Market,By Type,2016–2023 (USD Million)
Table 77 France: Gene Expression Analysis Services Market,By Type,2016–2023 (USD Million)
Table 78 France: Gene Expression Profiling Services Market,By Type,2016–2023 (USD Million)
Table 79 France: Gene Expression Analysis Market,By End User,2016–2023 (USD Million)
Table 80 Roe: Gene Expression Analysis Market,By Product & Service,2016–2023 (USD Million)
Table 81 Roe: Gene Expression Analysis Consumables Market,By Type,2016–2023 (USD Million)
Table 82 Roe: Gene Expression Analysis Instruments Market,By Type,2016–2023 (USD Million)
Table 83 Roe: Gene Expression Analysis Services Market,By Type,2016–2023 (USD Million)
Table 84 Roe: Gene Expression Profiling Services Market,By Type,2016–2023 (USD Million)
Table 85 Roe: Gene Expression Analysis Market,By End User,2016–2023 (USD Million)
Table 86 Asia Pacific: Gene Expression Analysis Market,By Country,2016–2023 (USD Million)
Table 87 Asia Pacific: Gene Expression Analysis Market,By Product & Service,2016–2023 (USD Million)
Table 88 Asia Pacific: Gene Expression Analysis Consumables Market,By Type,2016–2023 (USD Million)
Table 89 Asia Pacific: Gene Expression Analysis Instruments Market,By Type,2016–2023 (USD Million)
Table 90 Asia Pacific: Gene Expression Analysis Services Market,By Type,2016–2023 (USD Million)
Table 91 Asia Pacific: Gene Expression Profiling Services Market,By Type,2016–2023 (USD Million)
Table 92 Asia Pacific: Gene Expression Analysis Market,By End User,2016–2023 (USD Million)
Table 93 China: Gene Expression Analysis Market,By Product & Service,2016–2023 (USD Million)
Table 94 China: Gene Expression Analysis Consumables Market,By Type,2016–2023 (USD Million)
Table 95 China: Gene Expression Analysis Instruments Market,By Type,2016–2023 (USD Million)
Table 96 China: Gene Expression Analysis Services Market,By Type,2016–2023 (USD Million)
Table 97 China: Gene Expression Profiling Services Market,By Type,2016–2023 (USD Million)
Table 98 China: Gene Expression Analysis Market,By End User,2016–2023 (USD Million)
Table 99 Japan: Gene Expression Analysis Market,By Product & Service,2016–2023 (USD Million)
Table 100 Japan: Gene Expression Analysis Consumables Market,By Type,2016–2023 (USD Million)
Table 101 Japan: Gene Expression Analysis Instruments Market,By Type,2016–2023 (USD Million)
Table 102 Japan: Gene Expression Analysis Services Market,By Type,2016–2023 (USD Million)
Table 103 Japan: Gene Expression Profiling Services Market,By Type,2016–2023 (USD Million)
Table 104 Japan: Gene Expression Analysis Market,By End User,2016–2023 (USD Million)
Table 105 Australia: Gene Expression Analysis Market,By Product & Service,2016–2023 (USD Million)
Table 106 Australia: Gene Expression Analysis Consumables Market,By Type,2016–2023 (USD Million)
Table 107 Australia: Gene Expression Analysis Instruments Market,By Type,2016–2023 (USD Million)
Table 108 Australia: Gene Expression Analysis Services Market,By Type,2016–2023 (USD Million)
Table 109 Australia: Gene Expression Profiling Services Market,By Type,2016–2023 (USD Million)
Table 110 Australia: Gene Expression Analysis Market,By End User,2016–2023 (USD Million)
Table 111 India: Gene Expression Analysis Market,By Product & Service,2016–2023 (USD Million)
Table 112 India: Gene Expression Analysis Consumables Market,By Type,2016–2023 (USD Million)
Table 113 India: Gene Expression Analysis Instruments Market,By Type,2016–2023 (USD Million)
Table 114 India: Gene Expression Analysis Services Market,By Type,2016–2023 (USD Million)
Table 115 India: Gene Expression Profiling Services Market,By Type,2016–2023 (USD Million)
Table 116 India: Gene Expression Analysis Market,By End User,2016–2023 (USD Million)
Table 117 Roapac: Gene Expression Analysis Market,By Product & Service,2016–2023 (USD Million)
Table 118 Roapac: Gene Expression Analysis Consumables Market,By Type,2016–2023 (USD Million)
Table 119 Roapac: Gene Expression Analysis Instruments Market,By Type,2016–2023 (USD Million)
Table 120 Roapac: Gene Expression Analysis Services Market,By Type,2016–2023 (USD Million)
Table 121 Roapac: Gene Expression Profiling Services Market,By Type,2016–2023 (USD Million)
Table 122 Roapac: Gene Expression Analysis Market,By End User,2016–2023 (USD Million)
Table 123 Row: Gene Expression Analysis Market,By Product & Service,2016–2023 (USD Million)
Table 124 Row: Gene Expression Analysis Consumables Market,By Type,2016–2023 (USD Million)
Table 125 Row: Gene Expression Analysis Instruments Market,By Type,2016–2023 (USD Million)
Table 126 Row: Gene Expression Analysis Services Market,By Type,2016–2023 (USD Million)
Table 127 Row: Gene Expression Profiling Services Market,By Type,2016–2023 (USD Million)
Table 128 Row: Gene Expression Analysis Market,By End User,2016–2023 (USD Million)
Table 129 Product Launches & Approvals
Table 130 Acquisitions
Table 131 Partnerships,Agreements,& Collaborations

List of Figures (34 Figures )

Figure 1 Research Design
Figure 2 Breakdown of Primary Interviews: By Company Type,Designation,And Region
Figure 3 Gene Expression Analysis Market : Bottom-Up Approach
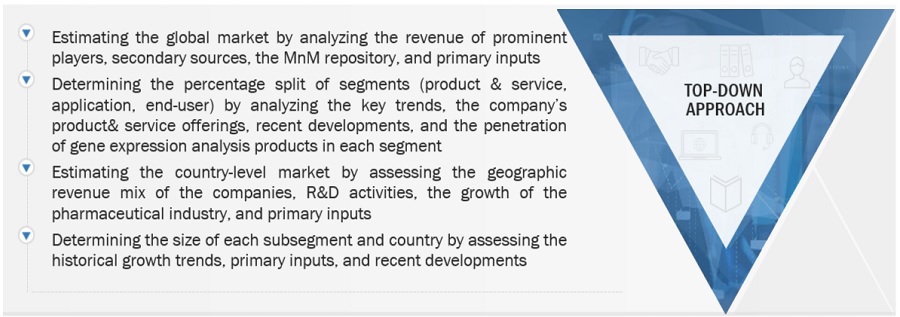
Figure 4 Gene Expression Analysis Market: Top-Down Approach
Figure 5 Data Triangulation Methodology
Figure 6 Gene Expression Analysis Market Share,By Product & Service,2018
Figure 7 Gene Expression Analysis Market,By End User,2018 vs.  2023 (USD Million)
Figure 8 Geographical Snapshot of The Gene Expression Analysis Market(2018–2023)
Figure 9 Decreasing Cost of Sequencing and Rising Prevalence of Cancer to Drive Market Growth
Figure 10 Consumables to Account for The Largest Share in The European Gene Expression Analysis Market in 201834
Figure 11 Consumables to Dominate The Gene Expression Analysis Market in 2023
Figure 12 Pharmaceutical and Biotechnology Companies to Account for The Largest Market Share in 2018
Figure 13 Apac to Register The Highest CAGR in The Forecast Period
Figure 14 Gene Expression Analysis Market: Drivers,Restraints,Opportunities,And Challenges
Figure 15 Consumables to Command The Largest Share of The Gene Expression Analysis Market in 2018
Figure 16 Gene Expression Profiling Services Segment to Dominate The Gene Expression Analysis Market in 201855
Figure 17 Pharmaceutical and Biotechnology Companies Estimated to Be The Largest End Users of Gene Expression Analysis Technologies in 2018
Figure 18 North America to Dominate The Gene Expression Analysis Market in 2018
Figure 19 North America: Gene Expression Analysis Market Snapshot
Figure 20 Europe: Gene Expression Analysis Market Snapshot
Figure 21 Asia Pacific: Gene Expression Analysis Market Snapshot
Figure 22 Row: Gene Expression Analysis Market Snapshot
Figure 23 Thermo Fisher Scientific Led The Market in 2017
Figure 24 Key Developments of The Prominent Players in The Gene Expression Analysis Market (2016–2018)
Figure 25 Thermo Fisher Scientific: Company Snapshot (2017)
Figure 26 Bio-Rad Laboratories,Inc.: Company Snapshot (2017)
Figure 27 Illumina,Inc.: Company Snapshot (2017)
Figure 28 Agilent Technologies: Company Snapshot (2017)
Figure 29 F. Hoffmann-La Roche: Company Snapshot (2017)
Figure 30 Ge Healthcare: Company Snapshot (2017)
Figure 31 Perkinelmer,Inc.: Company Snapshot (2017)
Figure 32 Qiagen: Company Snapshot (2017)
Figure 33 Pacific Biosciences of California: Company Snapshot (2017)
Figure 34 Eurofins Scientific: Company Snapshot (2017)


Request for detailed methodology, assumptions & how numbers were triangulated.

Please share your problem/objectives in greater details so that our analyst can verify if they can solve your problem(s).
5 7 8 5 6  
  • Select all
  • News-Letters with latest Market insights
  • Information & discussion on the relevant new products and services
  • Information & discussion on Market insights and Market information
  • Information & discussion on our events and conferences
    • Select all
    • Email Phone Professional and social network (Linkedin, etc)
Custom Market Research Services

We will customize the research for you, in case the report listed above does not meet with your exact requirements. Our custom research will comprehensively cover the business information you require to help you arrive at strategic and profitable business decisions.

Request Customization

Instant Answers with GPT - Ask Now!

Ask real questions. Get complete answers !
Report Code
BT 2236
Published ON
Nov, 2018
Choose License Type
BUY NOW
  • SHARE
X
Request Customization
Speak to Analyst
Speak to Analyst
OR FACE-TO-FACE MEETING
PERSONALIZE THIS RESEARCH
  • Triangulate with your Own Data
  • Get Data as per your Format and Definition
  • Gain a Deeper Dive on a Specific Application, Geography, Customer or Competitor
  • Any level of Personalization
REQUEST A FREE CUSTOMIZATION
LET US HELP YOU!
  • What are the Known and Unknown Adjacencies Impacting the Gene Expression Analysis Market
  • What will your New Revenue Sources be?
  • Who will be your Top Customer; what will make them switch?
  • Defend your Market Share or Win Competitors
  • Get a Scorecard for Target Partners
CUSTOMIZED WORKSHOP REQUEST
+1-888-600-6441
  • Call Us
  • +1-888-600-6441 (Corporate office hours)
  • +1-888-600-6441 (US/Can toll free)
  • +44-800-368-9399 (UK office hours)
CONNECT WITH US
ABOUT TRUST ONLINE
©2023 MarketsandMarkets Research Private Ltd. All rights reserved
DMCA.com Protection Status Website Feedback