
GCC Countries Activated Carbon Market (2023-2028)

The GCC Countries Activated Carbon Market was valued at $94.6 Million in 2023 and projected to reach to $168.1 Million by 2028, representing a compound annual growth rate of 8.7%. The GCC Countries activated carbon market is poised for sustained expansion through 2028, driven by critical water scarcity challenges and aggressive environmental protection initiatives.


| Market Size in | USD 26.32 MN |
| Market Forecast in | |
| CAGR | |
| Forecast Period | |
| Units Considered | Value (USD MN) |
GCC Countries Activated Carbon Market Trends and Insights
- This expansion reflects GCC Countries' increasing demand across water treatment, air purification, and industrial applications driven by rapid urbanization and stringent environmental regulations.
- GCC Countries' strategic position as a regional hub for petrochemicals and refining operations further accelerates activated carbon consumption in emission control and process optimization. GCC Countries' market growth trajectory, supported by an 8.7% compound annual growth rate through 2028, underscores the region's commitment to sustainability and operational efficiency.
- Investment in desalination infrastructure and food & beverage processing within GCC Countries continues to elevate activated carbon adoption.
- The competitive landscape in GCC Countries remains dynamic, with both regional manufacturers and international suppliers capitalizing on the region's economic diversification initiatives and rising industrial output..
Key Market Statistics
- CAGR (2023-2028) 8.7% CAGR
- Market Size, 2023 ~USD 94.6 Million
- Forecast, 2028 ~USD 168.1 Million
- Country GCC Countries
GCC Countries Activated Carbon Market Overview
Market Valuation Growth :
GCC Countries' activated carbon market reached USD 94.6 million in 2023, with projections to grow to USD 168.1 million by 2028, representing a strong 8.7% CAGR driven by regional industrialization and environmental compliance needs.
Water Treatment Dominance :
Water scarcity in GCC Countries is driving significant demand for activated carbon in desalination and wastewater treatment applications, positioning water purification as the primary market segment.
Regulatory Environment :
Stringent environmental regulations across GCC nations are mandating advanced filtration solutions, creating sustained demand for activated carbon in industrial and municipal applications.
Urbanization & Infrastructure :
Rapid urban expansion and mega-infrastructure projects in GCC Countries are accelerating adoption of activated carbon for air quality management and industrial emission control systems.
GCC Countries Activated Carbon Market Dynamics
- The region's heavy reliance on desalination and industrial processing creates consistent demand for high-performance activated carbon solutions.
- Government investments in water infrastructure and air quality management are expected to accelerate market penetration across both public and private sectors. Key growth catalysts include increasing foreign direct investment in petrochemical and refining industries, rising consumer awareness of air and water quality, and implementation of stricter emission standards.
- The market will benefit from technological advancements in activated carbon production and growing adoption in emerging applications such as food and beverage processing and pharmaceutical manufacturing..
Market Ecosystem
Related Ecosystem
Membranes
- Reverse Osmosis
- Acetone
- Acrylonitrile Butadiene Styrene (ABS)
- Bioremediation
- Cartridge Filters
- Veolia
- Toray Industries, Inc.
- PALL CORPORATION
- DuPont de Nemours, Inc.
- Pentair plc
Water Purification
- Corrosion Inhibitors
- Cartridge Filters
- Fiberglass
- Reverse Osmosis
- Acetone
- Veolia
- Basf se
- CALGON CARBON CORPORATION
- SOLENIS
- Kemira oyj
Fandb Processing And Technology
- Dairy Products
- Bakery Products
- Filtration Equipment
- Heat Exchanger
- Acetic Acid
- Gea group
- John Bean Technologies Corporation
- Alfa Laval Corporate AB
- AZELIS HOLDINGS SA
- SPX FLOW INC
Key Takeaways
- GCC Countries' activated carbon market is valued at USD 94.6 million in 2023 and will reach USD 168.1 million by 2028, representing 77.7% total growth.
- The 8.7% CAGR in GCC Countries outpaces many global markets, driven by water treatment and industrial emission control demand.
- GCC Countries' petrochemical and refining sectors are primary consumption drivers for activated carbon applications.
- GCC Countries' economic diversification and environmental compliance initiatives are accelerating market expansion through 2028.
Activated Carbon Market Report Scope
| Report Metric | Details |
|---|---|
| Base Year | 2023 |
| Fastest Growing Segment | -DRINKING WATER (End-Use Industry) |
| Forecast Period | 2023-2028 |
| Growth Rate | CAGR of 9.8% from 2023 to 2028 |
| Largest Segment | POWDERED ACTIVATED CARBON (Type) |
| Market Size Base Year (Billions) | ~USD 4.37 (2023) |
| Revenue Forecast (Billions) | ~USD 6.97 (2028) |
| Segments Covered | Type, Application, Raw Material, End-Use Industry |
GCC Countries Activated Carbon Market Report Segmentation
4 segment dimensions are covered across the global market.
By Type
- Granular Activated Carbon
- Other Types
- Powdered Activated Carbon
- Powered Activated Carbon
By Application
- Gas Phase Application
- Liquid Phase Application
By Raw Material
- Coal
- Coconut
- Other Raw Materials
- Peat
- Wood
By End-Use Industry
- Automotive
- Food & Beverage
- Industrial
- Other End-Se Industries
- Other End-Use Industries
- Pharmaceutical & Medical
- Water Treatment
- -Drinking Water
- -Wastewater Treatment
Target Audience
- Chemical Manufacturers : Activated carbon producers and chemical companies need GCC-specific market data to assess production capacity requirements, pricing strategies, and distribution partnerships in this high-growth regional market.
- Water Treatment Operators : Municipal and industrial water treatment facilities in GCC Countries require market intelligence to evaluate activated carbon suppliers, forecast procurement needs, and optimize treatment system investments.
- Environmental Consultants : Environmental engineering firms and sustainability consultants need regional market insights to advise GCC clients on activated carbon solutions for compliance with local environmental regulations.
- Investment & Private Equity : Investors and PE firms targeting GCC industrial and environmental sectors need accurate market sizing and growth forecasts to evaluate acquisition targets and investment opportunities in activated carbon businesses.
- Industrial Facility Operators : Petrochemical, refining, and manufacturing facilities in GCC Countries require market data to benchmark activated carbon costs, identify suppliers, and plan capital expenditures for filtration upgrades.
Reasons to Buy this Report
- Regional Market Sizing : Obtain precise market valuation data specific to GCC Countries with accurate 2023 baseline (USD 94.6M) and 2028 forecasts, enabling confident investment and expansion planning in the region.
- Growth Trajectory Insights : Understand the 8.7% CAGR specific to GCC Countries versus global 9.8%, identifying regional growth dynamics and competitive positioning opportunities unique to Gulf markets.
- Application-Specific Demand : Access detailed analysis of GCC-specific applications including water desalination, petrochemical refining, and air quality management to align product development with regional priorities.
- Regulatory & Infrastructure Context : Gain insights into GCC environmental regulations, water scarcity challenges, and infrastructure investments driving activated carbon adoption across public and private sectors.
- Competitive Landscape : Identify key market players, distribution channels, and competitive strategies specific to GCC Countries to optimize market entry and partnership development strategies.
Frequently asked questions
What is the current market size of activated carbon in GCC Countries?
The activated carbon market in GCC Countries was valued at USD 94.6 million in 2023.
What is the projected market size for activated carbon in GCC Countries by 2028?
GCC Countries' activated carbon market is forecast to reach USD 168.1 million by 2028.
What is the CAGR for activated carbon in GCC Countries?
GCC Countries' activated carbon market is expected to grow at a compound annual growth rate of 8.7% from 2023 to 2028.
Which industries drive activated carbon demand in GCC Countries?
GCC Countries' primary demand drivers include water treatment, air purification, petrochemical refining, desalination, and food & beverage processing.
Why is the activated carbon market growing in GCC Countries?
Growth in GCC Countries is driven by rapid urbanization, stringent environmental regulations, industrial expansion, and increased investment in sustainable infrastructure.
RESEARCH METHODOLOGY
The study involved four major activities for estimating the current size of the global activated carbon market. Exhaustive secondary research was carried out to collect information on the market, the peer product market, and the parent product group market. The next step was to validate these findings, assumptions, and sizes with the industry experts across the value chain of activated carbon through primary research. Both the top-down and bottom-up approaches were employed to estimate the overall size of the activated carbon market. After that, market breakdown and data triangulation procedures were used to determine the size of different segments and sub-segments of the market.
Secondary Research
In the secondary research process, various secondary sources such as Hoovers, Factiva, Bloomberg BusinessWeek, and Dun & Bradstreet were referred to, to identify and collect information for this study on the activated carbon market. These secondary sources included annual reports, press releases & investor presentations of companies; white papers; certified publications; articles by recognized authors; regulatory bodies, trade directories, and databases.
Primary Research
The activated carbon market comprises several stakeholders in the supply chain, which include raw material suppliers, processors, end-product manufacturers, buyers, and regulatory organizations. Various primary sources from the supply and demand sides of the markets have been interviewed to obtain qualitative and quantitative information. The primary participants from the demand side include key opinion leaders, executives, vice presidents, and CEOs of companies in the activated carbon market. Primary sources from the supply side include associations and institutions involved in the activated carbon industry, key opinion leaders, and processing players.
Following is the breakdown of primary respondents—
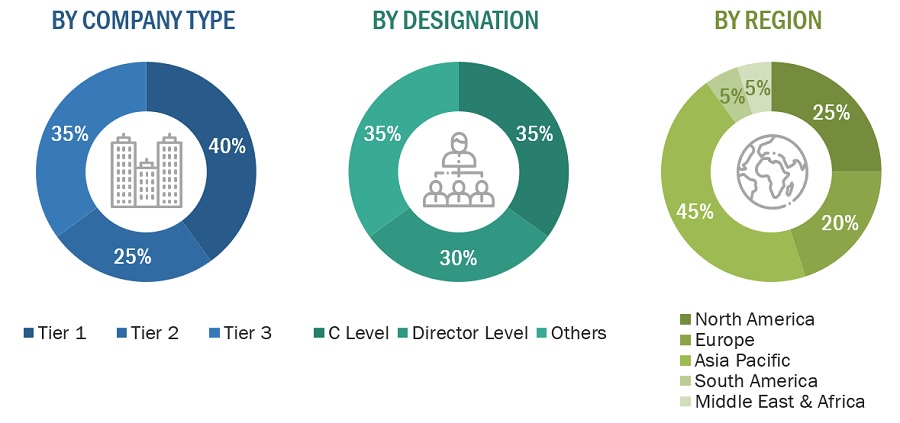
Notes: Other designations include product, sales, and marketing managers.
Tiers of the companies are classified based on their annual revenues as of 2022: Tier 1 = >USD 5 Billion, Tier 2 = USD 1 Billion to USD 5 Billion, and Tier 3= <USD 1 Billion.
To know about the assumptions considered for the study, download the pdf brochure
Market Size Estimation
Both the top-down and bottom-up approaches were used to estimate and validate the size of the global activated carbon market. These approaches were also used extensively to estimate the size of various segments of the market. The research methodology used to estimate the market size included the following details:
- The key players in the industry were identified through extensive secondary research.
- The supply chain of the industry and market size, in terms of value and volume, were determined through primary and secondary research.
- All percentage share splits and breakdowns were determined using secondary sources and verified through primary sources.
- All possible parameters that affect the markets covered in this research study were accounted for, viewed in extensive detail, verified through primary research, and analyzed to obtain the final quantitative and qualitative data.
- The research includes the study of reports, reviews, and newsletters of key industry players, along with extensive interviews with key officials, such as directors and marketing executives.
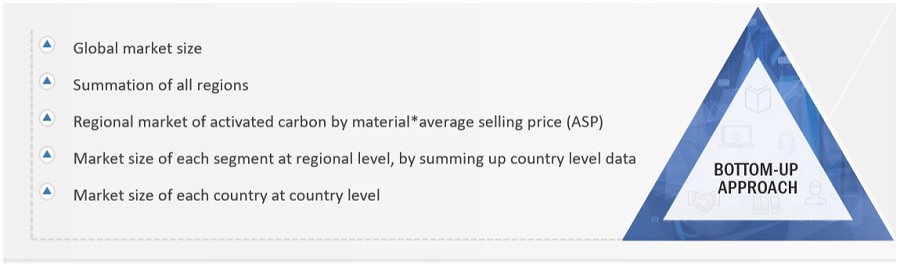
To know about the assumptions considered for the study, Request for Free Sample Report
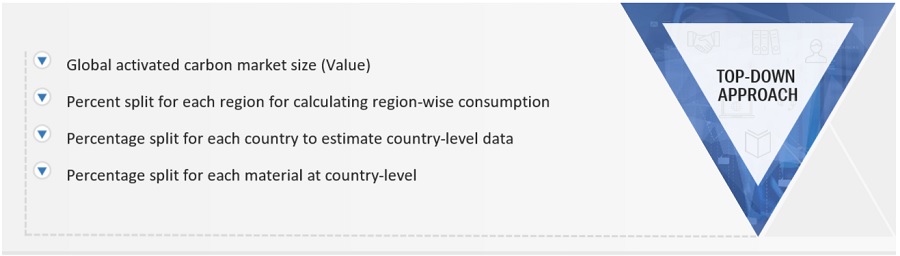
Data Triangulation
After arriving at the overall market size from the estimation process explained above, the total market was split into several segments and sub-segments. The data triangulation and market breakdown procedures were employed, wherever applicable, to complete the overall market engineering process and arrive at the exact statistics for all the segments and sub-segments of the activated carbon market. The data was triangulated by studying various factors and trends from both the demand- and supply-side.
In addition, the market size was validated by using both the top-down and bottom-up approaches. Then, it was verified through primary interviews. Hence, for every data segment, there are three sources—top-down approach, bottom-up approach, and expert interviews. The data were assumed to be correct when the values arrived at from the three sources matched.
Market Definition
Activated carbon, also known as activated charcoal, undergoes processing to create small pores with low volume, thus enhancing the surface area for adsorption or chemical reactions. As stated by the Activated Carbon Producers Association, activated carbons are manufactured and utilized as a solid substance in granular, powder, pellet, or textile formats, typically appearing black or dark grey. These activated carbons are made from various raw materials such as bituminous coal, coconut shells, lignite, peat, synthetic sources, semi-anthracite, and wood. Activated carbon is a porous, amorphous, high surface area adsorbent material composed of largely elemental carbon, with low or high skeletal density, depending on the manufacturing process used. Furthermore, the choice of raw material impacts the pore size of the final product. For instance, coconut shells and dense materials produce micropores (<2 nm), while moderately dense and lightweight materials result in meso- (between 2 and 50 nm) or macro-pores (> 50 nm).
Key Stakeholders
- Component manufacturer and suppliers
- Environmental associations
- Consulting companies in the activated carbon industry
- Activated carbon manufacturers
- Traders and distributors of activated carbon
- NGOs, governments, research organizations, investment banks, venture capitalists, and private equity firms
Report Objectives
- To define, analyze, and project the size of the activated carbon market in terms of value based on type, raw material, application, End-use Industry, and Region.
- To project the size of the market and its segments with respect to the five main regions, namely, North America, Europe, Asia Pacific, Middle East & Africa, and South America
- To provide detailed information about the key factors, such as drivers, restraints, opportunities, and challenges, influencing the growth of the market
- To analyze the opportunities in the market for stakeholders and provide a detailed competitive landscape of the market leaders.
- To analyze the competitive developments, such as new product launches, expansions, and acquisitions, in the activated carbon market
- To strategically profile the key players operating in the market and comprehensively analyze their market shares and core competencies.
Available Customizations
Along with the given market data, MarketsandMarkets offers customizations as per the specific needs of the companies. The following customization options are available for the report:
Product Analysis:
- Product Matrix which gives a detailed comparison of the product portfolio of each company
Regional Analysis:
- Further breakdown of the Rest of Asia Pacific market
- Further breakdown of Rest of Europe market
Company Information:
- Detailed analysis and profiling of additional market players (up to 5)
Get the Full Activated Carbon Market Report
Full forecast, segment splits, and company analysis for all Activated Carbon Market.
- Germany Activated Carbon Market
- UK Activated Carbon Market
- France Activated Carbon Market
- Russia Activated Carbon Market
- Poland Activated Carbon Market
- China Activated Carbon Market
- India Activated Carbon Market
- Singapore Activated Carbon Market
- Thailand Activated Carbon Market
- Indonesia Activated Carbon Market
- Malaysia Activated Carbon Market
- Canada Activated Carbon Market
- Mexico Activated Carbon Market
- US Activated Carbon Market
- Turkey Activated Carbon Market
- Brazil Activated Carbon Market
- Argentina Activated Carbon Market
- Rest Of Europe Activated Carbon Market
- Rest Of Asia Pacific Activated Carbon Market
- -Rest Of GCC Activated Carbon Market
- Rest Of South America Activated Carbon Market
Need a Tailored Report?
Customize this report to your needs
Get 10% FREE Customization
Customize This Report
