
Indonesia Ammonia Market (2025-2030)

The Indonesia Ammonia Market was valued at $2467.1 Million in 2025 and projected to reach to $2938.3 Million by 2030, representing a compound annual growth rate of 2.96%. Indonesia's ammonia market is poised for steady growth through 2030, supported by the country's substantial agricultural sector and rising fertilizer demand.


| Market Size in | USD 26.32 MN |
| Market Forecast in | |
| CAGR | |
| Forecast Period | |
| Units Considered | Value (USD MN) |
Indonesia Ammonia Market Trends and Insights
- Indonesia's ammonia sector is driven by robust demand from the agricultural fertilizer industry, which remains the primary end-use application across the archipelago.
- The market in Indonesia benefits from the country's significant agricultural output and growing industrial chemical manufacturing base, positioning it as a key ammonia consumer in the Asia Pacific region. During the forecast period from 2025 to 2030, Indonesia's ammonia market is expected to experience steady growth supported by increasing fertilizer consumption and expanding petrochemical production.
- Indonesia's strategic location and developing infrastructure create opportunities for both domestic production and regional trade.
- The market dynamics in Indonesia reflect broader trends in Southeast Asian chemical manufacturing, with emphasis on sustainable production methods and efficiency improvements to meet evolving regulatory standards..
Key Market Statistics
- CAGR (2025-2030) 2.96% CAGR
- Market Size, 2025 ~USD 2467.1 Million
- Forecast, 2030 ~USD 2938.3 Million
- Country Indonesia
Indonesia Ammonia Market Overview
Market Size & Growth :
Indonesia's ammonia market is valued at USD 2,467.1 million in 2025, with projected growth to USD 2,938.3 million by 2030, reflecting a steady CAGR of 2.96% driven by agricultural and industrial demand.
Agricultural Fertilizer Dominance :
The fertilizer sector remains the primary end-use application for ammonia in Indonesia, leveraging the country's significant agricultural base and growing food production requirements across the archipelago.
Regional Production Capacity :
Indonesia's ammonia production infrastructure supports both domestic consumption and regional export opportunities, positioning the country as a key player in Southeast Asian ammonia supply chains.
Growth Catalysts :
Rising agricultural productivity demands, government support for food security initiatives, and increasing industrial applications in manufacturing sectors are driving sustained market expansion in Indonesia.
Indonesia Ammonia Market Dynamics
- The market benefits from Indonesia's strategic position in Southeast Asia, with domestic production capacity meeting both local consumption and regional export needs.
- Agricultural intensification and government initiatives to enhance food security will continue to drive ammonia demand across farming communities.
- Additionally, emerging applications in industrial manufacturing and chemical production present supplementary growth opportunities.
- The 2.96% CAGR reflects a balanced market trajectory, with stable demand fundamentals offsetting global commodity price volatility and competitive pressures from regional producers..
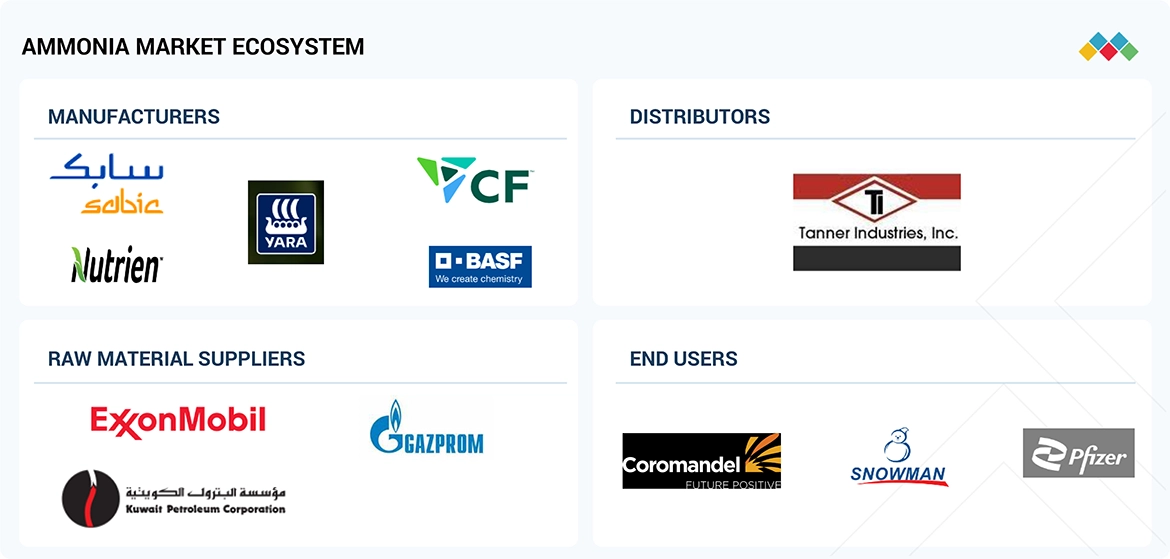
Market Ecosystem
AMMONIA MARKET: COMMERCIAL USE CASES ACROSS INDUSTRIES
| COMPANY | USE CASE DESCRIPTION | BENEFITS |
|---|---|---|
 |
Electrochemical ammonia removal from wastewater (Saltworks Flex EDR), enabling ammonia recovery and reuse in industrial and municipal treatment systems. | Up to 95% ammonia removal, reduced chemical use, lower costs, compliance with discharge norms, and generation of reusable fertilizer by-products. |
 |
Low-carbon ammonia use in agriculture (CF Industries–POET) integrating green ammonia into ethanol production value chain. | Reduces ethanol carbon intensity (10%), supports sustainable farming, enables low-carbon fuel compliance, and creates premium value through traceable green fertilizer supply. |
Logos and trademarks shown above are the property of their respective owners. Their use here is for informational and illustrative purposes only.
Related Ecosystem
Agrochemicals
- Phosphatic Fertilizers
- Potassic Fertilizers
- Fungicides
- Ammonium Nitrate
- Anticoagulant Rodenticides
- AZELIS HOLDINGS SA
- Basf se
- Origin Enterprises plc
- MITSUI AGRO BUSINESS SACO
- SNF HOLDING COMPANY INC.
Electric Hybrid Vehicles
- Battery Electric Vehicle (BEV)
- Fuel Cell Electric Vehicle (FCEV)
- Light Commercial Vehicles (LCVs)
- Hybrid Electric Vehicle (HEV)
- Agricultural Tractors
- Visteon Corporation
- Byd company ltd.
- BOSCH LIMITED
- Tesla, Inc.
- FORD MOTOR COMPANY
Bulk Chemicals And Inorganics
- Corrosion Inhibitors
- Glycol Ethers
- Acetic Acid
- Acetone
- Ammonium Nitrate
- Basf se
- DOW CHEMICAL COMPANY
- Exxon Mobil Corporation
- AZELIS HOLDINGS SA
- Sinopec limited
Key Takeaways
- Indonesia's ammonia market is valued at USD 2,467.1 million in 2025 and will grow to USD 2,938.3 million by 2030 at a 2.96% CAGR.
- Agricultural fertilizer production is the dominant end-use segment driving ammonia demand across Indonesia.
- Indonesia's growing petrochemical sector and agricultural expansion support sustained market growth through 2030.
- Infrastructure development and regulatory improvements in Indonesia are enhancing production efficiency and market competitiveness.
Ammonia Market Report Scope
| Report Metric | Details |
|---|---|
| Base Year | 2025 |
| Fastest Growing Segment | DIRECT (Sales Channel) |
| Forecast Period | 2025-2030 |
| Growth Rate | CAGR of 3.71% from 2025 to 2030 |
| Largest Segment | ANHYDROUS (Type) |
| Market Size Base Year (Billions) | ~USD 82.57 (2025) |
| Revenue Forecast (Billions) | ~USD 99.06 (2030) |
| Segments Covered | Type, Sales Channel, End-Use Industry |
Indonesia Ammonia Market Report Segmentation
3 segment dimensions are covered across the global market.
By Type
- Anhydrous
- Aqueous
By Sales Channel
- Direct
- Indirect
By End-Use Industry
- Agriculture
- Mining
- Other End-Use Industries
- Pharmaceutical
- Refrigeration
- Textile
INDONESIA: AMMONIA MARKET, BY END-USE INDUSTRY, 2025–2031
| Segment | 2025 | 2026 | 2027 | 2028 | 2029 | 2030 | 2031 | CAGR (%) |
|---|---|---|---|---|---|---|---|---|
| AGRICULTURE | 1921.5 | 1648.5 | 2080 | 2147.9 | 2217.9 | 2290 | 2364.4 | 3.52 |
| MINING | 108.5 | 115.5 | 105.2 | 106.7 | 108.1 | 109.6 | 111.1 | 0.39 |
| OTHER END-USE INDUSTRIES | 37.6 | 39.8 | 37.1 | 37.5 | 37.9 | 38.2 | 38.6 | 0.46 |
| PHARMACEUTICAL | 38.9 | 41.3 | 38.6 | 39 | 39.4 | 39.8 | 40.3 | 0.56 |
| REFRIGERATION | 128.6 | 137.4 | 125.6 | 127.8 | 130.1 | 132.4 | 134.8 | 0.79 |
| TEXTILE | 232 | 248.9 | 228.5 | 233.5 | 238.6 | 243.8 | 249.1 | 1.19 |
| TOTAL | 2467.1 | 2231.5 | 2615.1 | 2692.4 | 2772 | 2854 | 2938.3 | 2.96 |
Target Audience
- Fertilizer Manufacturers & Distributors : Need Indonesia-specific ammonia supply data and agricultural demand forecasts to optimize production planning, procurement strategies, and distribution networks across the archipelago.
- Chemical Industry Investors : Require localized market sizing, growth projections, and competitive landscape analysis to evaluate investment opportunities and capital allocation decisions in Indonesia's ammonia sector.
- Agricultural Input Suppliers : Depend on country-level consumption trends and end-use application data to develop targeted product portfolios and marketing strategies for Indonesian farming communities.
- Government & Policy Makers : Utilize market intelligence to inform food security policies, industrial development strategies, and regulatory frameworks governing ammonia production and agricultural chemical usage in Indonesia.
- Strategic Business Consultants : Leverage Indonesia-specific market data and forecasts to advise clients on market entry, expansion strategies, and competitive positioning within Southeast Asia's ammonia supply ecosystem.
Reasons to Buy this Report
- Localized Market Intelligence : Gain country-specific insights into Indonesia's ammonia market dynamics, including production capacity, consumption patterns, and regional supply chain positioning unavailable in global reports.
- Agricultural Sector Opportunity Assessment : Understand the fertilizer industry's role as the primary ammonia end-use application in Indonesia, enabling targeted business development and market entry strategies for agricultural chemical suppliers.
- Competitive Positioning Data : Access detailed analysis of Indonesia's ammonia production landscape, regional competitors, and market share distribution to inform strategic planning and competitive benchmarking decisions.
- Growth Trajectory Forecasting : Leverage 5-year projections (2025-2030) with 2.96% CAGR to model revenue scenarios, investment returns, and expansion timelines specific to the Indonesian market context.
- Regulatory & Policy Insights : Understand Indonesia-specific government initiatives, food security policies, and industrial regulations affecting ammonia demand, production, and market opportunities through 2030.
Frequently asked questions
What is the current size of Indonesia's ammonia market?
Indonesia's ammonia market is estimated at USD 2,467.1 million in 2025, with verified data from KS table sources.
What is the projected market size for Indonesia's ammonia industry by 2030?
Indonesia's ammonia market is forecast to reach USD 2,938.3 million by 2030, representing growth from the 2025 baseline.
What is the growth rate of Indonesia's ammonia market?
Indonesia's ammonia market is expected to grow at a compound annual growth rate (CAGR) of 2.96% between 2025 and 2030.
Which sectors drive ammonia demand in Indonesia?
Agricultural fertilizer production is the primary driver of ammonia demand in Indonesia, followed by petrochemical manufacturing and industrial applications.
What factors support Indonesia's ammonia market growth?
Indonesia's ammonia market growth is supported by increasing agricultural output, expanding petrochemical production, infrastructure development, and regulatory improvements in the chemical sector.
RESEARCH METHODOLOGY
The study involved four major activities to estimate the current size of the global ammonia market. Exhaustive secondary research was carried out to collect information on the market, the peer product market, and the parent product group market. The next step was to validate these findings, assumptions, and sizes with industry experts across the ammonia value chain through primary research. The top-down and bottom-up approaches were employed to estimate the overall size of the ammonia market. Afterward, market breakdown and data triangulation were used to determine the size of market segments.
Secondary Research
The market for companies offering ammonia was determined by analyzing secondary data from paid and unpaid sources, reviewing the product portfolios of major companies in the ecosystem, and rating companies based on performance and quality. Various secondary sources, such as Business Standard, Bloomberg, World Bank, and Factiva, were referred to identify and collect information for this study on the ammonia market. In the secondary research process, various secondary sources were referred to identify and collect information related to the study. Secondary sources included annual reports, press releases, investor presentations, ammonia vendors, forums, certified publications, and white papers. Secondary research was used to obtain critical information on the industry’s value chain, the total pool of key players, market classification, and segmentation from both market- and technology-oriented perspectives.
Primary Research
In the primary research process, interviews with primary sources from the supply and demand sides were conducted to obtain qualitative and quantitative information for this report. The primary sources from the supply side included industry experts, such as Chief Executive Officers (CEOs), Vice Presidents (VPs), marketing directors, technology and innovation directors, and related key executives from several key companies and organizations operating in the ammonia market. After the completion of market engineering (calculations for market statistics, market breakdown, market size estimation, market forecasting, and data triangulation), extensive primary research was conducted to gather information and verify and validate the critical numbers derived. Primary research was also conducted to identify the segmentation types, industry trends, competitive landscape of ammonia offered by various market players, and key market dynamics, such as drivers, restraints, opportunities, challenges, industry trends, and key player strategies. In the complete market engineering process, the top-down and bottom-up approaches and several data triangulation methods were extensively used to perform the market estimation and market forecasting for the overall market segments and subsegments listed in this report. Extensive qualitative and quantitative analysis was performed on the complete market engineering process to list the key information/insights throughout the report.
Breakdown of Primary Interviews
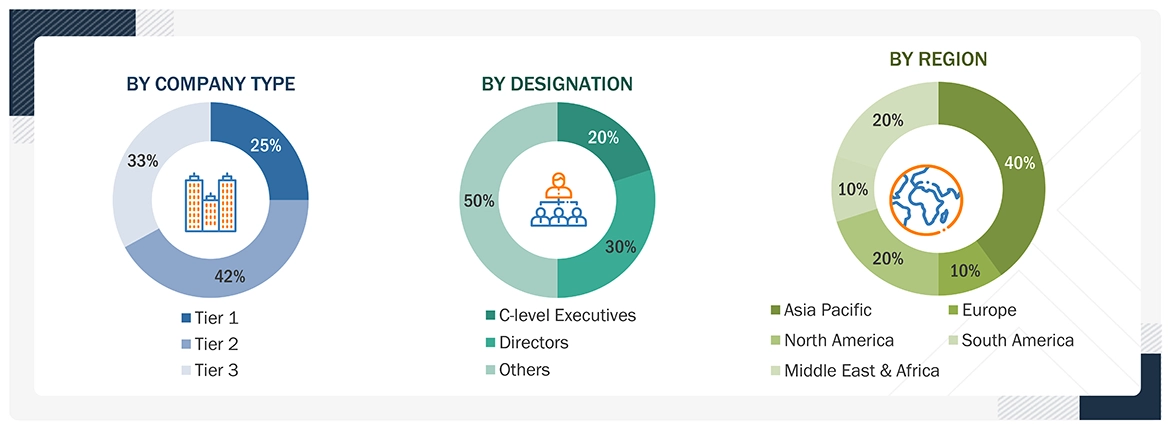
Notes:
Others include sales, marketing, and product managers.
Tier 1: > USD 1 billion; Tier 2: USD 500 million–1 billion; and Tier 3: < USD 500 million
To know about the assumptions considered for the study, download the pdf brochure
Market Size Estimation
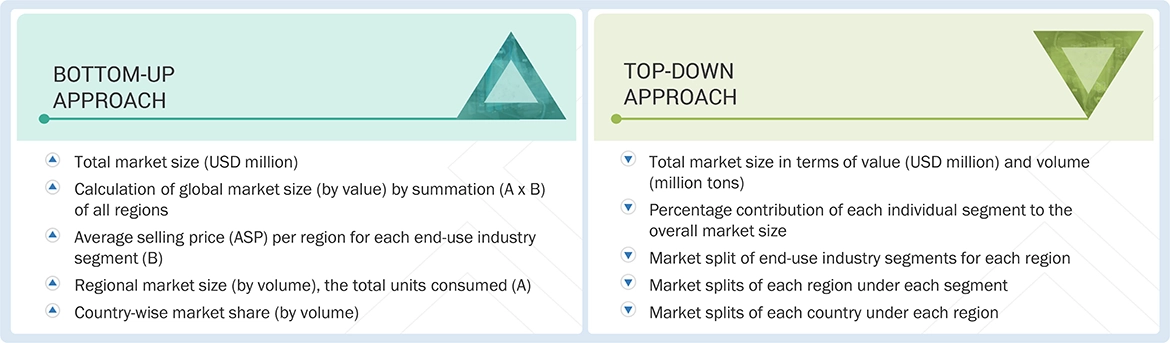
The top-down and bottom-up approaches were used to estimate and validate the size of the global ammonia market. These approaches were also used extensively to estimate the size of various dependent market segments.
The research methodology used to estimate the market size included the following approaches.
Data Triangulation
After arriving at the overall market size using the market size estimation processes, the market was split into several segments and subsegments. The data triangulation and market breakup procedures were employed, where applicable, to complete the overall market engineering process and determine the exact statistics for each market segment and subsegment. The data was triangulated by studying various factors and trends from both the demand and supply sides.
Market Definition
Ammonia is a colorless gas with a sharp, pungent smell, made of nitrogen and hydrogen. It is one of the most important industrial chemicals because it is used primarily to produce fertilizers that support global agriculture. It also has applications in textiles, refrigeration, mining, pharmaceuticals, and other uses. Ammonia is valuable in industry, but it must be handled carefully because it can be hazardous at high concentrations. It is also available in aqueous form for different uses.
Key Stakeholders
- Raw Material Suppliers
- Regulatory Bodies
- Government and Consulting Firms
- End Users
- Research and Development Organizations
- Ammonia Manufacturers, Dealers, Traders, and Suppliers.
Report Objectives
- To define, describe, and forecast the size of the global ammonia market based on type, sales channel, end-use industry, and region in terms of value and volume
- To provide detailed information on the significant drivers, restraints, opportunities, and challenges influencing the market
- To analyze and forecast the market based on type, sales channel, and end-use industry
- To strategically analyze micro markets concerning individual growth trends, prospects, and their contribution to the market
- To assess the growth opportunities in the market for stakeholders and provide details on the competitive landscape for market leaders
- To forecast the market size of segments for North America, Europe, Asia Pacific, South America, and the Middle East & Africa
- To strategically profile key players and comprehensively analyze their market shares and core competencies
- To analyze competitive developments, such as expansions, partnerships, and acquisitions in the ammonia market
- To provide the impact of AI on the ammonia market.
Available customizations:
With the given market data, MarketsandMarkets offers customizations according to client-specific needs.
The following customization options are available for the ammonia report:
Product Analysis
- A product matrix that gives a detailed comparison of the product portfolio of each company
Regional Analysis
- A further breakdown of the ammonia market for additional countries
Company Information
- Detailed analysis and profiling of additional market players (up to five)
Get the Full Ammonia Market Report
Full forecast, segment splits, and company analysis for all Ammonia Market.
- -Rest Of GCC Ammonia Market
- China Ammonia Market
- India Ammonia Market
- Japan Ammonia Market
- Germany Ammonia Market
- UK Ammonia Market
- France Ammonia Market
- Spain Ammonia Market
- Italy Ammonia Market
- Russia Ammonia Market
- Iran Ammonia Market
- US Ammonia Market
- Canada Ammonia Market
- Mexico Ammonia Market
- Brazil Ammonia Market
- Rest Of Europe Ammonia Market
- Rest Of Asia Pacific Ammonia Market
- GCC Countries Ammonia Market
- Rest Of Mea Ammonia Market
Need a Tailored Report?
Customize this report to your needs
Get 10% FREE Customization
Customize This Report
