
Europe Bubble Generator Market (2024-2029)

The Europe Bubble Generator Market was valued at $155 Million in 2024 and projected to reach to $202.6 Million by 2029, representing a compound annual growth rate of 5.5%. Europe's bubble generator market is poised for sustained growth through 2029, supported by increasing investments in water treatment infrastructure, pharmaceutical manufacturing expansion, and industrial process optimization.


| Market Size in | USD 26.32 MN |
| Market Forecast in | |
| CAGR | |
| Forecast Period | |
| Units Considered | Value (USD MN) |
Europe Bubble Generator Market Trends and Insights
- This growth trajectory reflects Europe's strong demand across industrial, pharmaceutical, and water treatment applications, where bubble generation technology plays a critical role in process efficiency and product quality.
- Europe maintains a mature market infrastructure with established manufacturing capabilities and stringent regulatory standards that drive innovation in bubble generator design and performance. The European market benefits from robust investment in environmental sustainability and industrial modernization across the region.
- Europe's commitment to reducing operational costs and improving process efficiency has accelerated adoption of advanced bubble generator systems in chemical processing, food and beverage, and wastewater management sectors.
- Between 2024 and 2029, Europe is expected to see increased competition from both established regional players and new entrants, alongside growing integration of automation and smart technologies in bubble generation systems..
Key Market Statistics
- CAGR (2024-2029) 5.5% CAGR
- Market Size, 2024 ~USD 155 Million
- Forecast, 2029 ~USD 202.6 Million
- Geography Europe
Europe Bubble Generator Market Overview
Market Valuation & Growth :
Europe's bubble generator market is valued at USD 155.0 million in 2024, with a projected CAGR of 5.5% through 2029, reaching USD 202.6 million. This steady growth outpaces several global regions and reflects strong industrial adoption.
Germany's Market Leadership :
Germany dominates Europe's bubble generator market with USD 55.1 million in market size, driven by advanced manufacturing, pharmaceutical production, and stringent water treatment standards that demand high-quality bubble generation technology.
Diverse Application Base :
Europe's bubble generator demand spans industrial processes, pharmaceutical manufacturing, water treatment, and environmental applications. This diversification across sectors provides stable growth opportunities and reduces dependency on single-industry cycles.
Regulatory & Quality Standards :
Europe's strict environmental regulations and quality standards in pharmaceuticals and water treatment drive adoption of advanced bubble generation solutions, positioning the region as a premium market with higher-value product demand.
Europe Bubble Generator Market Dynamics
- The region's mature industrial base and stringent regulatory environment create consistent demand for efficient bubble generation technologies.
- Key growth drivers include the EU's environmental directives, rising wastewater treatment requirements, and pharmaceutical sector expansion across Western and Central Europe. The market benefits from Europe's technological innovation ecosystem and established manufacturing capabilities.
- Countries like Germany, France, and Italy lead in adoption, while emerging Eastern European markets present expansion opportunities.
- The 5.5% CAGR reflects moderate but reliable growth, with premium product segments and specialized applications driving higher margins than global averages..
Market Ecosystem
Related Ecosystem
Decarbonization
- Battery Electric Vehicle (BEV)
- Energy Management Systems
- Fuel Cell
- Fuel Cell Electric Vehicle (FCEV)
- Geographical Information System (GIS)
- TotalEnergies SE
- Siemens ag
- Mitsui & Co., Ltd.
- General Electric Company
- Thyssenkrupp ag
Equipment Machine And Tooling
- Wastewater Treatment
- Air Cooled Heat Exchangers
- Diaphragm Pumps
- Fiberglass
- HVAC System
- Alfa Laval Corporate AB
- Johnson Controls International plc
- Veolia
- Daikin Industries,Ltd.
- Carrier Global Corporation
Fandb Processing And Technology
- Dairy Products
- Bakery Products
- Filtration Equipment
- Heat Exchanger
- Acetic Acid
- Gea group
- John Bean Technologies Corporation
- Alfa Laval Corporate AB
- AZELIS HOLDINGS SA
- SPX FLOW INC
Key Takeaways
- Europe's bubble generator market is valued at USD 155.0 million in 2024 and will grow to USD 202.6 million by 2029, representing a 5.5% CAGR.
- Europe's stringent environmental regulations and sustainability initiatives are driving demand for efficient bubble generation technologies across multiple industrial sectors.
- The European market is characterized by mature manufacturing infrastructure and established supply chains that support both regional and international bubble generator producers.
- Between 2024 and 2029, Europe will see increased adoption of automated and smart bubble generator systems in response to Industry 4.0 trends and operational efficiency demands.
Bubble Generator Market Report Scope
| Report Metric | Details |
|---|---|
| Base Year | 2024 |
| Fastest Growing Segment | MIXED VAPOR CONDENSATION BY DIRECT CONTACT WITH COOLANT WATER (Technology) |
| Forecast Period | 2024-2029 |
| Growth Rate | CAGR of 6.8% from 2024 to 2029 |
| Largest Segment | WATER & WASTEWATER TREATMENT (End User) |
| Market Size Base Year (Billions) | ~USD 1.3 (2024) |
| Revenue Forecast (Billions) | ~USD 1.8 (2029) |
| Segments Covered | Type, Technology, Function, End User, Application |
Europe Bubble Generator Market Report Segmentation
5 segment dimensions are covered across the global market.
By Type
- Fine Bubble
- Microbubble
- Nanobubble
- Other Types
By Technology
- Ejector
- Mixed Vapor Condensation By Direct Contact With Coolant Water
- Nanopores
- Pressure Dissolution
- Swirl Flow
- Ultrasonic Vibration
- Venturi
By Function
- Flotation
- Gas Liquid Mixing
- Other Functions
- Ozonation
- Particle Aggregation & Removal
By End User
- Agriculture & Aquaculture
- Chemicals
- Food & Beverage
- Mining & Mineral Processing
- Other End Users
- Other End-Users
- Power Generation
- Water & Wastewater Treatment
- -Beverage Processing
- -Food Processing
- -Industrial Wastewater Treatment
- -Municipal Wastewater Treatment
By Application
- Ejector
- Mixed Vapor Condensation By Direct Contact With Coolant Water
- Nanopores
- Pressure Dissolution
- Swirl Flow
- Ultrasonic Vibration
- Venturi
REST OF EUROPE: BUBBLE GENERATOR MARKET, BY END USER, 2024–2029
| Segment | 2024 | 2025 | 2026 | 2027 | 2028 | 2029 | CAGR (%) |
|---|---|---|---|---|---|---|---|
| AGRICULTURE & AQUACULTURE | 9.9 | 10.2 | 10.6 | 11 | 11.5 | 11.9 | 3.8 |
| CHEMICALS | 2.8 | 2.8 | 2.9 | 3 | 3 | 3.1 | 2 |
| FOOD & BEVERAGE | 6 | 6.2 | 6.4 | 6.7 | 6.9 | 7.1 | 3.4 |
| MINING & MINERAL PROCESSING | 2 | 2 | 2.1 | 2.1 | 2.2 | 2.2 | 2.5 |
| OTHER END USERS | 1.8 | 1.8 | 1.8 | 1.8 | 1.8 | 1.8 | 0.3 |
| POWER GENERATION | 5 | 5.2 | 5.3 | 5.5 | 5.6 | 5.8 | 2.9 |
| WATER & WASTEWATER TREATMENT | 19.1 | 19.7 | 20.3 | 21 | 21.6 | 22.4 | 3.2 |
| –BEVERAGE PROCESSING | 2.9 | 2.9 | 3 | 3.1 | 3.1 | 3.2 | 2.4 |
| –FOOD PROCESSING | 3.2 | 3.3 | 3.4 | 3.6 | 3.7 | 3.9 | 4.3 |
| –INDUSTRIAL WASTEWATER TREATMENT | 10.9 | 11.3 | 11.6 | 12 | 12.5 | 12.9 | 3.4 |
| –MUNICIPAL WASTEWATER TREATMENT | 8.2 | 8.4 | 8.7 | 8.9 | 9.2 | 9.5 | 2.8 |
| TOTAL | 46.7 | 48 | 49.5 | 51 | 52.6 | 54.4 | 3.1 |
EUROPE: BUBBLE GENERATOR MARKET, BY END USER, 2024–2029
| Segment | 2024 | 2025 | 2026 | 2027 | 2028 | 2029 | CAGR (%) |
|---|---|---|---|---|---|---|---|
| AGRICULTURE & AQUACULTURE | 39 | 40.8 | 42.8 | 45 | 47.3 | 49.7 | 5 |
| CHEMICALS | 11 | 11.3 | 11.7 | 12 | 12.4 | 12.9 | 3.2 |
| FOOD & BEVERAGE | 23.8 | 24.8 | 25.9 | 27.1 | 28.4 | 29.8 | 4.6 |
| MINING & MINERAL PROCESSING | 7.7 | 8 | 8.3 | 8.6 | 8.9 | 9.3 | 3.7 |
| OTHER END USERS | 7.1 | 7.1 | 7.1 | 7.2 | 7.2 | 7.3 | 0.5 |
| POWER GENERATION | 19.8 | 20.6 | 21.4 | 22.3 | 23.2 | 24.2 | 4.1 |
| WATER & WASTEWATER TREATMENT | 75.6 | 78.8 | 82.2 | 85.9 | 89.8 | 93.9 | 4.4 |
| –BEVERAGE PROCESSING | 11.3 | 11.6 | 12.1 | 12.5 | 12.9 | 13.4 | 3.6 |
| –FOOD PROCESSING | 12.5 | 13.2 | 13.9 | 14.6 | 15.5 | 16.3 | 5.5 |
| –INDUSTRIAL WASTEWATER TREATMENT | 43.1 | 44.9 | 47 | 49.1 | 51.4 | 53.9 | 4.6 |
| –MUNICIPAL WASTEWATER TREATMENT | 32.5 | 33.9 | 35.3 | 36.8 | 38.3 | 40 | 4.2 |
| TOTAL | 183.9 | 191.4 | 199.5 | 208.1 | 217.2 | 227 | 4.3 |
Target Audience
- Equipment Manufacturers : Bubble generator manufacturers need Europe-specific market data to optimize product portfolios, identify regional demand patterns, and align manufacturing capacity with growth projections across diverse industrial applications.
- Pharmaceutical Companies : Pharmaceutical manufacturers require insights into European bubble generation technology adoption for process optimization, compliance with regional quality standards, and supplier selection across major production hubs.
- Water Treatment Operators : Municipal and industrial water treatment facilities need market intelligence to evaluate bubble generation solutions, benchmark costs, and identify technology upgrades aligned with EU environmental compliance requirements.
- Investment & Private Equity Firms : Investors evaluating European industrial technology companies need detailed market sizing, growth forecasts, and competitive positioning data to assess acquisition targets and portfolio company growth potential.
- Consulting & Engineering Firms : Engineering consultants advising industrial clients require Europe-specific market trends, technology adoption rates, and regional cost structures to develop competitive project proposals and technology recommendations.
Countries within Europe - compare and drill down
| Country | 2025 size (native) |
|---|---|
| Germany | USD 55.1 Million |
| France | USD 42.4 Million |
| Italy | USD 29.6 Million |
| UK | USD 26.4 Million |
| Spain | USD 19.2 Million |
| Rest Of Europe | USD 54.4 Million |
Country market size visualization
Reasons to Buy this Report
- Country-Level Market Breakdown : Access detailed market sizing for Germany (USD 55.1M), France (USD 42.4M), Italy (USD 29.6M), UK (USD 26.4M), and Spain (USD 19.2M), enabling precise regional investment and expansion strategies.
- Competitive Landscape Intelligence : Understand Europe-specific competitive dynamics, market consolidation trends, and key player strategies tailored to regional regulatory requirements and customer preferences across pharmaceutical, industrial, and environmental sectors.
- Growth Opportunity Identification : Identify high-growth segments within Europe's 5.5% CAGR market, including emerging Eastern European markets and specialized applications in water treatment and pharmaceutical manufacturing with premium pricing potential.
- Regulatory & Compliance Insights : Gain comprehensive understanding of EU environmental directives, pharmaceutical standards, and water treatment regulations driving bubble generator adoption and influencing product development priorities across European markets.
- Strategic Market Forecasting : Leverage 2024-2029 forecast data (USD 155.0M to USD 202.6M) to inform capital allocation, product launches, and partnership strategies with confidence in Europe's steady growth trajectory and market maturity.
Frequently asked questions
What is the current size of Europe's bubble generator market?
Europe's bubble generator market was valued at USD 155.0 million in 2024 and is projected to reach USD 202.6 million by 2029.
What is the expected growth rate for Europe's bubble generator market?
Europe's bubble generator market is expected to grow at a compound annual growth rate (CAGR) of 5.5% from 2024 to 2029.
Which industries drive demand for bubble generators in Europe?
Europe's bubble generator demand is driven by industrial chemical processing, pharmaceutical manufacturing, water treatment, food and beverage production, and wastewater management sectors.
What factors are contributing to growth in Europe's bubble generator market?
Europe's market growth is driven by environmental regulations, sustainability initiatives, industrial modernization, automation trends, and the need for improved process efficiency across manufacturing sectors.
How is Europe's bubble generator market expected to evolve by 2029?
By 2029, Europe's bubble generator market will see increased competition, greater adoption of smart and automated systems, and continued innovation driven by regulatory compliance and operational efficiency demands.
RESEARCH METHODOLOGY
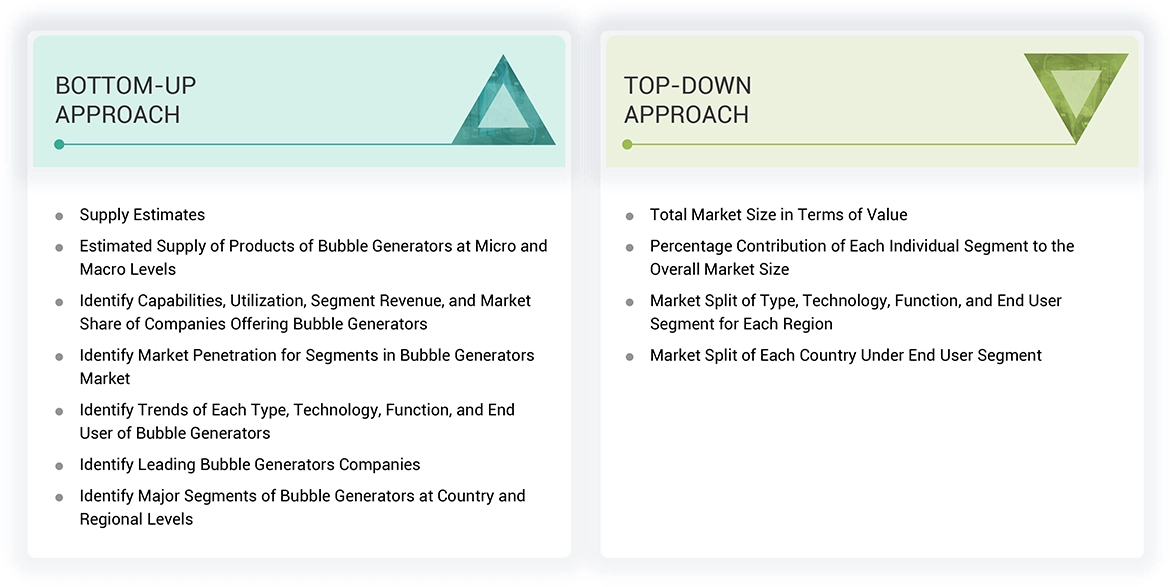
The study involved four major activities in estimating the market size of the bubble generators market. Exhaustive secondary research was done to collect information on the market, the peer market, and the parent market. The next step was to validate these findings, assumptions, and sizing with industry experts across the value chain through primary research. Both top-down and bottom-up approaches were employed to estimate the complete market size. Thereafter, the market breakdown and data triangulation procedures were used to estimate the market size of the segments and subsegments.
Secondary Research
In the secondary research process, various secondary sources have been referred to for identifying and collecting information for this study. These secondary sources include annual reports, press releases, investor presentations of companies, white papers, certified publications, trade directories, certified publications, articles from recognized authors, gold standard and silver standard websites, and databases.
Secondary research has been used to obtain key information about the value chain of the industry, monetary chain of the market, the total pool of key bubble generators, market classification and segmentation according to industry trends to the bottom-most level, and regional markets. It was also used to obtain information about the key developments from a market-oriented perspective.
Primary Research
The bubble generators market comprises several stakeholders in the value chain, which include raw material suppliers, manufacturers, and end users. Various primary sources from the supply and demand sides of the bubble generators market have been interviewed to obtain qualitative and quantitative information. The primary interviewees from the demand side include key opinion leaders in end-use sectors. The primary sources from the supply side include manufacturers, associations, and institutions involved in the bubble generators industry.
Primary interviews were conducted to gather insights such as market statistics, data of revenue collected from the products and services, market breakdowns, market size estimations, market forecasting, and data triangulation. Primary research also helped in understanding the various trends related to type, technology, function, end-user, and region. Stakeholders from the demand side, such as CIOs, CTOs, and CSOs were interviewed to understand the buyer’s perspective on the suppliers, products, component providers, and their current usage of bubble generators and the future outlook of their business which will affect the overall market.
The breakdown of profiles of the primary interviewees is illustrated in the figure below:
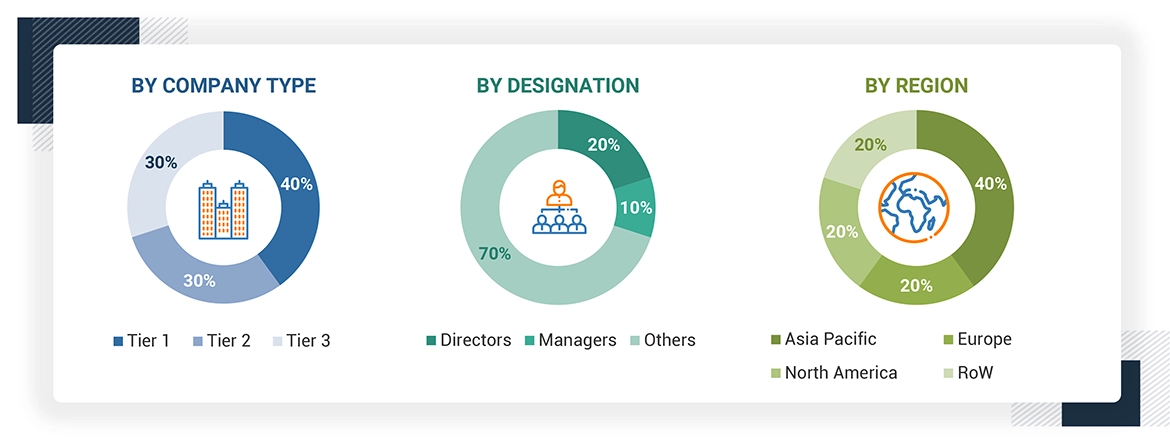
Note: Tier 1, Tier 2, and Tier 3 companies are classified based on their market revenue in 2023 available in the public domain, product portfolios, and geographical presence.
Other designations include sales representatives, production heads, and technicians.
To know about the assumptions considered for the study, download the pdf brochure
Market Size Estimation
The top-down approach was used to estimate and validate the size of various submarkets for bubble generators for each region. The research methodology used to estimate the market size included the following steps:
- The key players in the industry have been identified through extensive secondary research.
- The supply chain of the industry has been determined through primary and secondary research.
- The global market was then segmented into five major regions and validated by industry experts.
- All percentage shares, splits, and breakdowns based on type, technology, function, end-user, and region were determined using secondary sources and verified through primary sources.
- All possible parameters that affect the markets covered in this research study were accounted for, viewed in extensive detail, verified through primary research, and analyzed to get the final quantitative and qualitative data. This data was consolidated and added with detailed inputs and analysis and presented in this report.
Data Triangulation
After arriving at the total market size from the estimation process bubble generators above, the overall market has been split into several segments and sub-segments. To complete the overall market engineering process and arrive at the exact statistics for all the segments and sub-segments, the data triangulation and market breakdown procedures have been employed, wherever applicable. The data has been triangulated by studying various factors and trends from both the demand and supply sides. Along with this, the market size has been validated by using both the top-down and bottom-up approaches and primary interviews. Hence, for every data segment, there have been three sources—top-down approach, bottom-up approach, and expert interviews. The data was assumed correct when the values arrived from the three sources matched.
Market Definition
Bubble generators are machines that aim to create bubbles in the required sizes and characteristics for the most frequent uses: aeration, water purification, and energy extraction. They work on the premise where gas is compressed to form liquids that can improve physical, chemical as well as biological processes. That is why the technology of bubble generators has developed more than one type for use in various settings. Micro bubble generators create bubbles in the micron size range including 1-100 micron sizes and these small bubbles are suitable for aeration within the water treatment industry. Some of them are used in the field like aquaculture and wastewater treatment. Of these, the swirl type micro bubble generator is known for producing bubbles of a specific size with less complexity and with high efficiency. In contrast, nanobubble generators produce virtually tiny bubbles which aim at ranging between 70 and 120 nanometer size. The abovementioned THz nanobubbles have several unusual characteristics, including stability and neutral buoyancy, offering increased gaseous solubility in liquids. Some of uses are to increase the quality of water and enable chemical reactions to occur without the use of toxic agents.
Stakeholders
- Bubble Generator Manufacturers
- Bubble Generator Traders, Distributors, and Suppliers
- Raw Type Suppliers
- Government and Private Research Organizations
- Associations and Industrial Bodies
- R&D Institutions
- Environmental Support Agencies
Report Objectives
- To define, describe, and forecast the bubble generator market size in terms of value and volume
- To provide detailed information regarding the drivers, restraints, opportunities, and challenges influencing the growth of the bubble generator market
- To analyze and forecast the market by type, technology, function, end-user, and region
- To describe and forecast the market with respect to five main regions: North America, Europe, Asia Pacific, South America, and the Middle East & Africa, along with their key countries
- To analyze opportunities for stakeholders by identifying high-growth segments of the bubble generator market
- To strategically analyze the ecosystem, Porter’s Five Forces, technology analysis, tariffs and regulations, patent landscape, trade landscape, key conferences and events, and case studies/use cases pertaining to the market under study
- To strategically analyze micromarkets with respect to individual growth trends, prospects, and contributions to the overall market
- To strategically profile the key players and comprehensively analyze their market positions in terms of their ranking and core competencies, along with detailing the competitive landscape for market leaders
- To analyze competitive developments such as investments & expansions and mergers & acquisitions.
Get the Full Bubble Generator Market Report
Full forecast, segment splits, and company analysis for all Bubble Generator Market.
- UK Bubble Generator Market
- Italy Bubble Generator Market
- China Bubble Generator Market
- Japan Bubble Generator Market
- India Bubble Generator Market
- South Korea Bubble Generator Market
- Malaysia Bubble Generator Market
- South Africa Bubble Generator Market
- Brazil Bubble Generator Market
- Argentina Bubble Generator Market
- Rest Of Europe Bubble Generator Market
- Rest Of Asia Pacific Bubble Generator Market
- GCC Bubble Generator Market
- -Rest Of GCC Bubble Generator Market
- Rest Of South America Bubble Generator Market
- US Bubble Generator Market
- Canada Bubble Generator Market
- Mexico Bubble Generator Market
- Germany Bubble Generator Market
- France Bubble Generator Market
- Spain Bubble Generator Market
Need a Tailored Report?
Customize this report to your needs
Get 10% FREE Customization
Customize This Report
