
Rest Of Asia Pacific Computer-aided Engineering (CAE) Market (2025-2030)

The Rest Of Asia Pacific Computer-aided Engineering (CAE) Market was valued at $666.5 Million in 2025 and projected to reach to $1194.9 Million by 2030, representing a compound annual growth rate of 12.4%. Rest Of Asia Pacific represents a high-growth segment within the broader Asia Pacific CAE market, driven by rapid industrialization and digital transformation across manufacturing, automotive, and aerospace sectors.


| Market Size in | USD 26.32 MN |
| Market Forecast in | |
| CAGR | |
| Forecast Period | |
| Units Considered | Value (USD MN) |
Rest Of Asia Pacific Computer-aided Engineering (CAE) Market Trends and Insights
- In 2025, Rest Of Asia Pacific's CAE market is estimated at USD 666.5 million, reflecting strong adoption of digital engineering solutions across manufacturing, automotive, and aerospace sectors.
- Rest Of Asia Pacific is projected to expand significantly, reaching USD 1,194.9 million by 2030, driven by increasing industrialization, rising R&D investments, and the digital transformation of engineering workflows. The 12.4% compound annual growth rate (CAGR) for Rest Of Asia Pacific substantially outpaces the global average of 10.2%, underscoring the region's accelerating demand for simulation, modeling, and optimization tools.
- Rest Of Asia Pacific's growth trajectory reflects both the maturation of existing markets and the emergence of new industrial hubs seeking competitive advantages through advanced engineering technologies.
- Rest Of Asia Pacific's expanding middle class and growing technology infrastructure are catalyzing enterprise adoption of CAE solutions across diverse verticals..
Key Market Statistics
- CAGR (2025-2030) 12.4% CAGR
- Market Size, 2025 ~USD 666.5 Million
- Forecast, 2030 ~USD 1194.9 Million
- Country Rest Of Asia Pacific
Rest Of Asia Pacific Computer-aided Engineering (CAE) Market Overview
Rapid Market Expansion :
Rest Of Asia Pacific's CAE market is experiencing robust growth with a 12.4% CAGR, outpacing the global average of 10.2%, driven by increasing digitalization in manufacturing and engineering sectors across emerging economies.
Significant Market Valuation :
The market is valued at USD 666.5 million in 2025 and is projected to nearly double to USD 1,194.9 million by 2030, reflecting strong investment in digital engineering solutions and simulation technologies.
Sector-Specific Growth Drivers :
Automotive, aerospace, and manufacturing sectors in Rest Of Asia Pacific are accelerating CAE adoption to enhance product development efficiency, reduce time-to-market, and optimize design processes in competitive regional markets.
Emerging Market Opportunities :
Rising industrialization, government initiatives supporting manufacturing innovation, and increasing collaboration with global OEMs are creating substantial opportunities for CAE solution providers in Rest Of Asia Pacific.
Rest Of Asia Pacific Computer-aided Engineering (CAE) Market Dynamics
- The region's 12.4% CAGR significantly exceeds global growth rates, indicating strong market momentum and increasing adoption of advanced engineering simulation tools. By 2030, the market is expected to reach USD 1,194.9 million, nearly doubling from 2025 levels.
- This expansion is fueled by rising investments in R&D, growing demand for cost-effective product development solutions, and increasing integration of AI and cloud-based CAE platforms.
- Emerging economies in the region are prioritizing digital engineering capabilities to enhance competitiveness and support sustainable manufacturing practices..
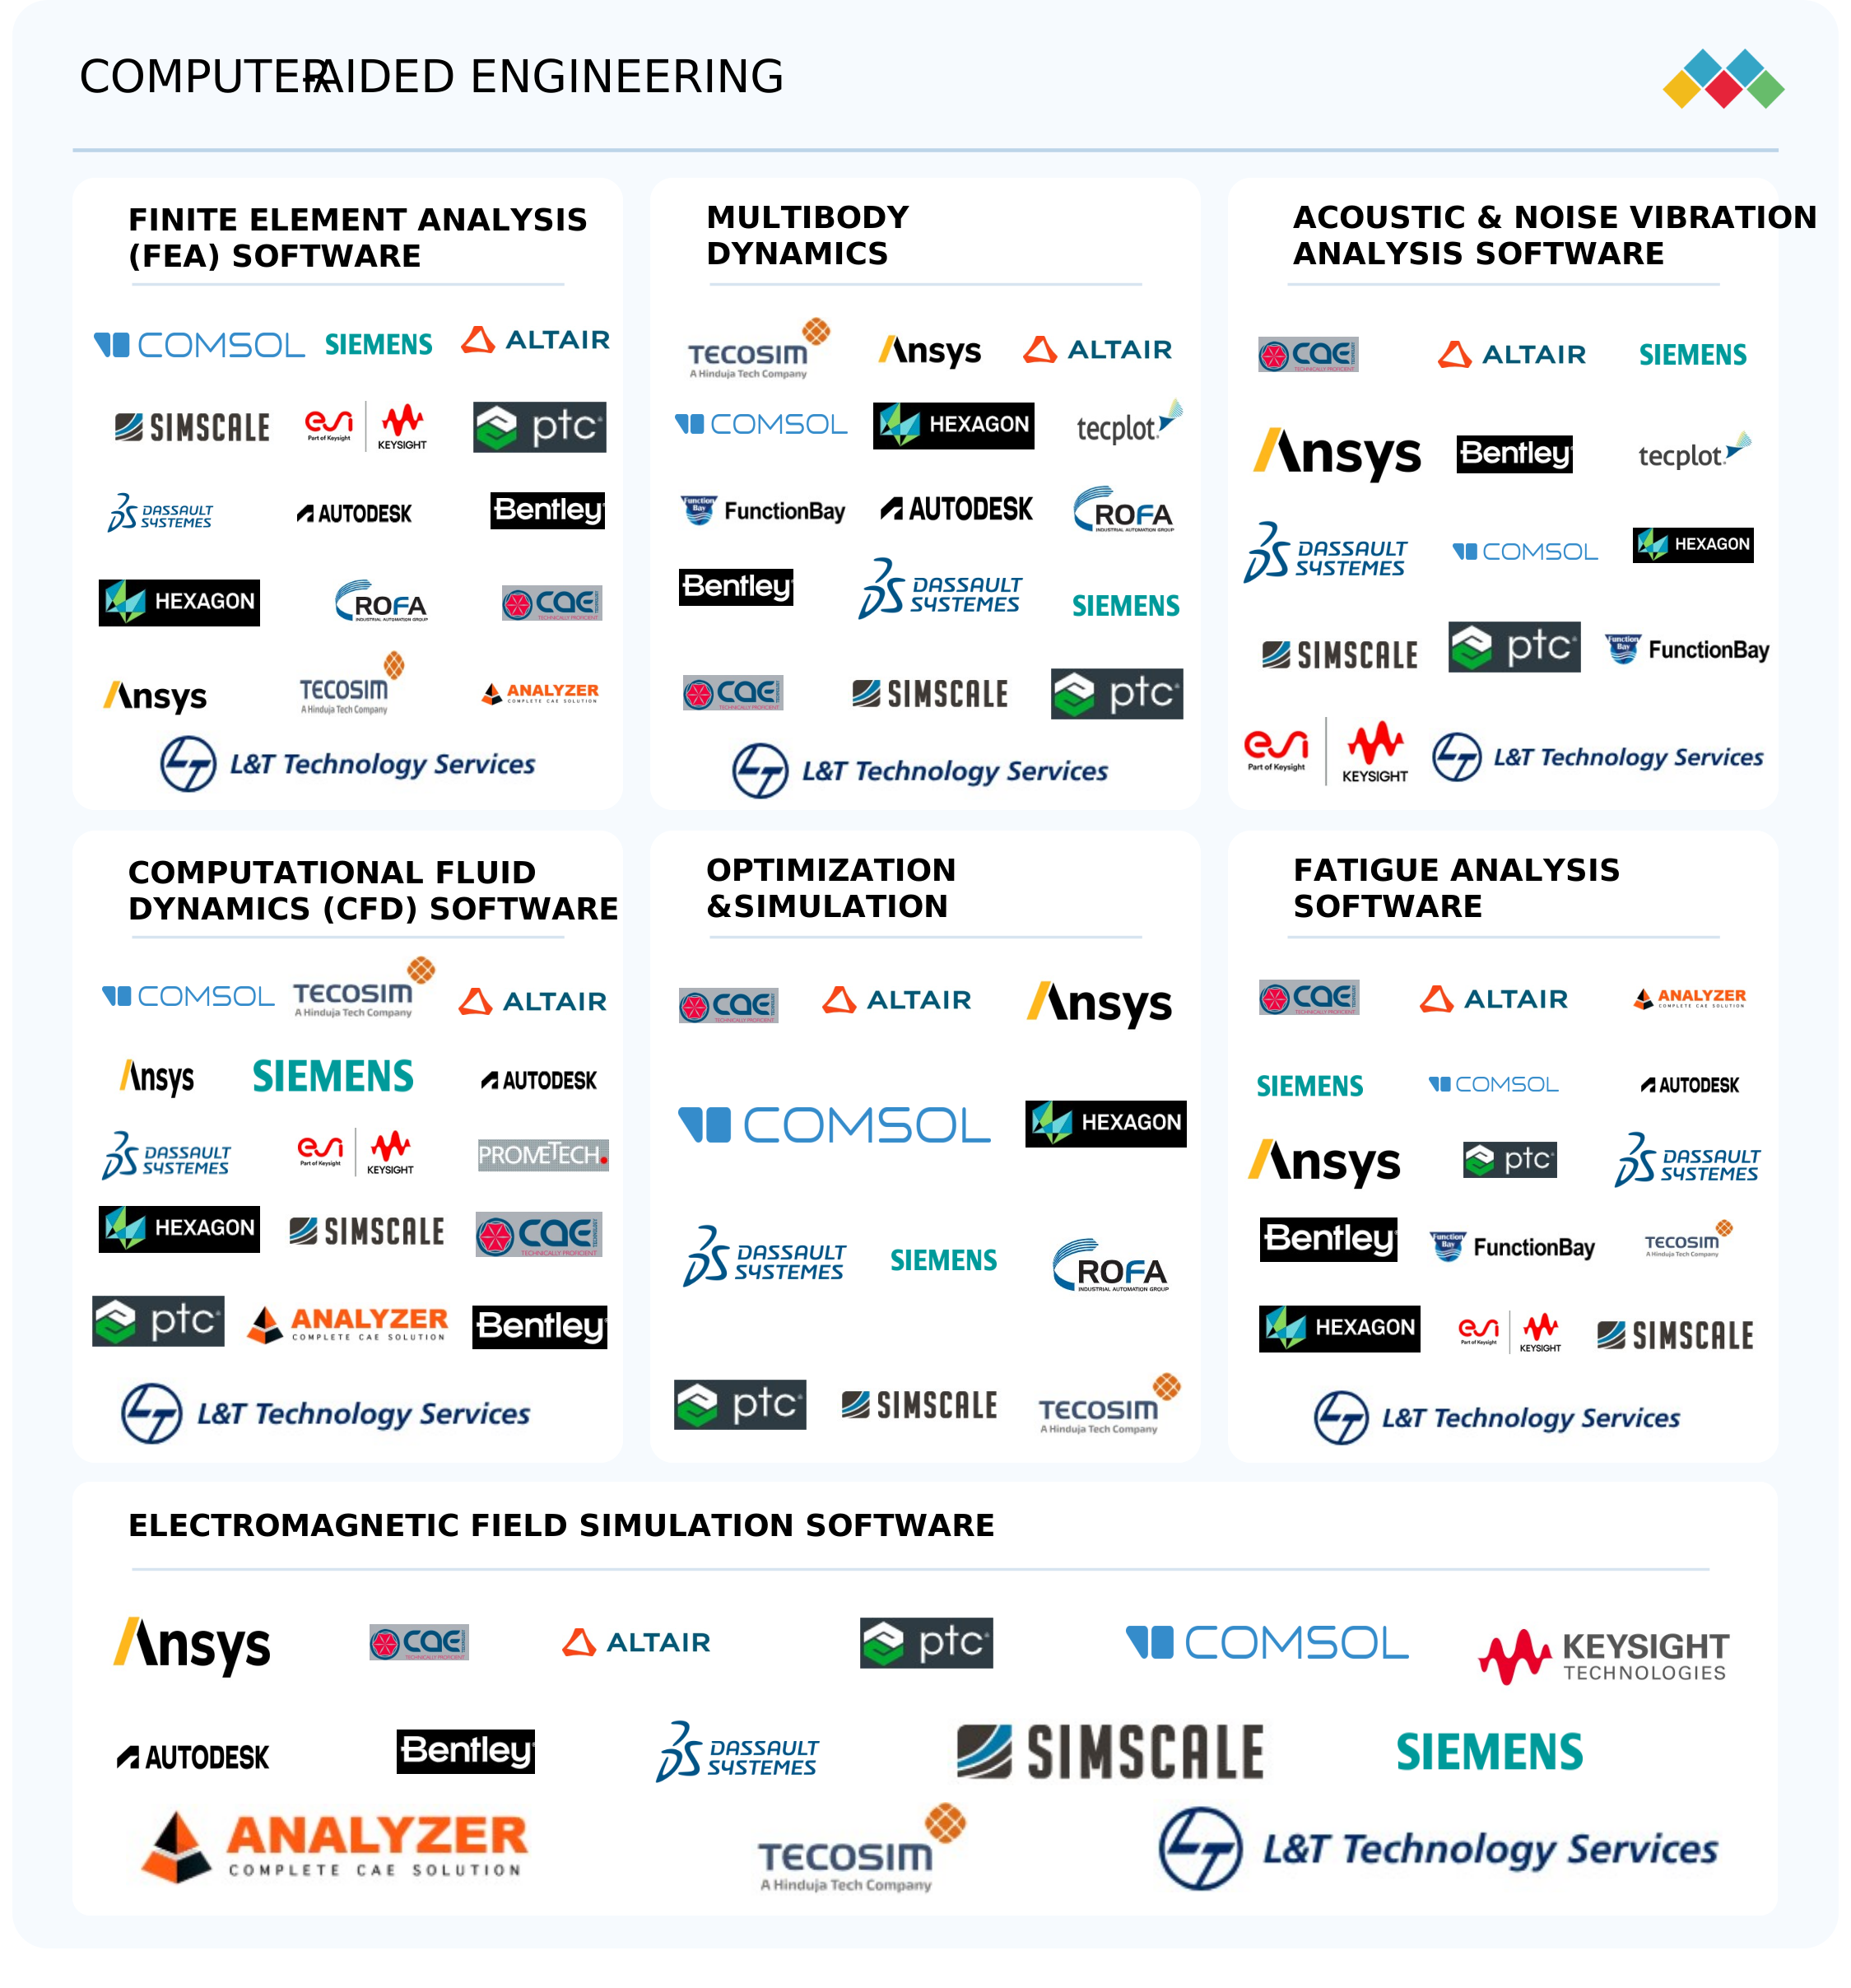
Market Ecosystem
COMMERCIAL USE CASES ACROSS INDUSTRIES
| COMPANY | USE CASE DESCRIPTION | BENEFITS |
|---|---|---|
 |
Doppelmayr enhances ski lift safety and efficiency using Altair’s advanced CFD simulations, reducing testing time and costs. | UltraFluidX simulations achieved <5% drag deviation, accelerated design cycles, lowered costs, and provided deeper aerodynamic insights beyond traditional wind tunnel testing. |
 |
PMF uses Dassault Systèmes’ 3DEXPERIENCE platform to design and manufacture innovative racing motorcycles, driving success in MotoStudent competitions. | PMF achieved a 50% reduction in rear swingarm weight, developed an aerodynamic airbrake device, streamlined collaboration, and ensured consistent competition success. |
 |
Plaintiffs leverage DocuSign eSignature to enforce tenancy-in-common agreements, with courts upholding the signatures as legal and binding under common law. | DocuSign court-confirmed enforceability of eSignatures, streamlined agreement management, and strengthened legal compliance in property disputes. |
 |
Bosch utilized Ansys Motor-CAD to enhance the design of electric motors, focusing on improving efficiency and performance across the full torque-speed operating range. | Ansys Motor-CAD helped Bosch speed up design cycles, improve motor efficiency, and enhance product reliability through advanced simulations. |
 |
CAE Value AB employed Siemens' Simcenter Amesim and Simcenter HEEDS to perform multi-attribute balancing of hybrid vehicles, optimizing various performance parameters simultaneously. | Siemens' solutions improved hybrid vehicle performance, reduced development time through streamlined optimization, and enabled engineers to meet diverse design requirements efficiently. |
Logos and trademarks shown above are the property of their respective owners. Their use here is for informational and illustrative purposes only.
Related Ecosystem
Software And Services
- Natural Language Processing (NLP)
- Machine Learning
- Supply Chain Management
- Predictive Analytics
- Image Sensors
- International Business Machines Corporation
- MICROSOFT CORPORATION
- Oracle Corporation
- SAP SE
- Amazon.com, Inc.
Key Takeaways
- Rest Of Asia Pacific's CAE market will nearly double from USD 666.5 million in 2025 to USD 1,194.9 million by 2030, representing a robust 12.4% CAGR.
- Rest Of Asia Pacific's growth rate significantly exceeds the global 10.2% CAGR, positioning the region as a key driver of worldwide CAE market expansion.
- Rest Of Asia Pacific's rapid industrialization and digital transformation initiatives are accelerating adoption of simulation and modeling technologies across manufacturing and engineering sectors.
- Rest Of Asia Pacific's competitive advantage lies in cost-effective engineering solutions and emerging technology hubs attracting multinational CAE vendors and local innovators.
Computer-aided Engineering (CAE) Market Report Scope
| Report Metric | Details |
|---|---|
| Base Year | 2025 |
| Fastest Growing Segment | HEALTHCARE & MEDICAL DEVICE SIMULATION (Application) |
| Forecast Period | 2025-2030 |
| Growth Rate | CAGR of 10.2% from 2025 to 2030 |
| Largest Segment | LARGE ENTERPRISES (Organization Size) |
| Market Size Base Year (Billions) | ~USD 12.28 (2025) |
| Revenue Forecast (Billions) | ~USD 19.96 (2030) |
| Segments Covered | Offering, Type, Deployment Mode, Organization Size, Vertical, Software Tool, Optimization & Simulation, Software Type, Application, Software, Capability |
Rest Of Asia Pacific Computer-aided Engineering (CAE) Market Report Segmentation
11 segment dimensions are covered across the global market.
By Offering
- Professional Services
- Services
- Software
- Software Tools
By Type
- Computational Fluid Dynamics (Cfd)
- Electromagnetics
- Finite Element Analysis (Fea)
- Multibody Dynamics
- Optimization & Simulation
- Other Software Tools
By Deployment Mode
- Cloud
- On-Premises
By Organization Size
- Large Enterprises
- Smes
By Vertical
- Aerospace
- Aerospace & Defense
- Architecture, Engineering, & Construction (Aec)
- Automotive
- Chemical
- Chemicals
- Construction
- Electrical & Electronics
- Electronics & Semiconductor
- Electronics & Semiconductors
- Energy & Power
- Energy & Process
- Food & Beverages
- Gaming
- Healthcare & Life Sciences
- Healthcare & Pharmaceuticals
- Heavy Industrial Equipment
- Heavy Machinery
- Marine & Offshore
- Medical Devices & Pharmaceuticals
- Metal & Mining
- Oil & Gas
- Oil, Gas, & Mining
- Other Verticals
- Pulp & Paper
- Shipbuilding & Marine Engineering
By Software Tool
- Computational Fluid Dynamics (Cfd)
- Electromagentics
- Finite Element Analysis (Fea)
- Multibody Dynamics
- Optimization & Simulation
- Other Software Tools
By Optimization & Simulation
- Discrete
- Process
By Software Type
- Cad Simulation Software
- Cfd
- Electromagnetic Simulation Software
- Electronic Simulation Software
- Fea
- Gaming, Ar, Vr, And Training Simulation Software
- Healthcare & Epidemiological Simulation Software
- Manufacturing Simulation Software
- Other Software Types
- Physics & Multiphysics Simulation Software
- Process Simulation Software
By Application
- Automotive & Vehicle Simulation
- Engineering, Research, Modeling, & Simulated Testing
- Gamification, Vr, Ar, & Immersive Experience
- Healthcare & Medical Device Simulation
- Machining & Production
- Manufacturing & Process Optimization
- Other Applications
- Product Design & Prototyping
- Quality Control & Inspection
- Supply Chain, Logistics Management, & Transportation
- Urban Planning
By Software
- Cad-Embedded Cam Software
- Independent Cam Software
By Capability
- 2D
- 3D
- Multi-Axis
Target Audience
- CAE Software Vendors : Identify market size, growth potential, and sector-specific demand in Rest Of Asia Pacific to develop localized product strategies, pricing models, and distribution channels for this high-growth region.
- Manufacturing & Automotive OEMs : Understand CAE market dynamics and technology adoption trends in Rest Of Asia Pacific to optimize engineering operations, reduce development costs, and enhance competitiveness in regional supply chains.
- Investment & Private Equity Firms : Evaluate market growth potential and investment opportunities in Rest Of Asia Pacific's CAE sector, with detailed forecasts and regional dynamics to support M&A and portfolio expansion decisions.
- Systems Integrators & Consultants : Access regional market intelligence to identify client opportunities, develop CAE implementation services, and position solutions aligned with Rest Of Asia Pacific's digital engineering transformation needs.
- Government & Policy Makers : Leverage market data on Rest Of Asia Pacific's CAE adoption to inform industrial policy, R&D funding initiatives, and manufacturing innovation programs supporting regional economic development.
Reasons to Buy this Report
- Regional Market Sizing & Forecasts : Obtain precise market valuation data specific to Rest Of Asia Pacific (USD 666.5M in 2025, USD 1,194.9M in 2030) with detailed CAGR analysis to support strategic planning and investment decisions.
- Competitive Benchmarking : Understand Rest Of Asia Pacific's growth trajectory (12.4% CAGR) relative to global benchmarks (10.2%), enabling identification of regional opportunities and competitive advantages in this high-growth segment.
- Sector-Specific Insights : Access detailed analysis of CAE adoption across automotive, aerospace, and manufacturing sectors in Rest Of Asia Pacific to identify target verticals and tailor solutions for maximum market penetration.
- Investment & Expansion Strategy : Leverage comprehensive market intelligence on Rest Of Asia Pacific's emerging economies to develop informed go-to-market strategies, partnership opportunities, and resource allocation plans for regional expansion.
- Technology Trend Analysis : Gain insights into digital transformation drivers, cloud-based CAE adoption, and AI integration trends specific to Rest Of Asia Pacific to align product development with regional market demands.
Frequently asked questions
What is the current market size of CAE in Rest Of Asia Pacific?
Rest Of Asia Pacific's CAE market is estimated at USD 666.5 million in 2025, with verified data confirming strong regional demand for engineering simulation and design optimization tools.
What is the projected market size for Rest Of Asia Pacific CAE by 2030?
Rest Of Asia Pacific's CAE market is forecasted to reach USD 1,194.9 million by 2030, representing nearly 80% growth over the five-year forecast period.
How does Rest Of Asia Pacific's CAE growth compare to global trends?
Rest Of Asia Pacific's 12.4% CAGR outpaces the global average of 10.2%, indicating the region is experiencing faster market expansion driven by industrialization and digital adoption.
What industries are driving CAE adoption in Rest Of Asia Pacific?
Rest Of Asia Pacific's CAE growth is primarily driven by manufacturing, automotive, aerospace, electronics, and heavy machinery sectors investing in simulation and optimization technologies.
What factors are accelerating CAE market growth in Rest Of Asia Pacific?
Rest Of Asia Pacific's market expansion is fueled by rising R&D investments, digital transformation initiatives, cost-competitive engineering services, and increasing adoption of Industry 4.0 practices.
RESEARCH METHODOLOGY
This study involved estimating the current CAE market size. Exhaustive secondary research was carried out to collect information on the CAE industry. The next step involved validating these findings and assumptions, and sizing with industry experts across the value chain using primary research. Different approaches, such as top-down and bottom-up, were employed to estimate the total market size. After that, the market breakup and data triangulation procedures were used to estimate the market size of segments and subsegments of the CAE market.
Secondary Research
The market for the companies offering CAE software tools and services was arrived at using secondary data available through paid and unpaid sources, analyzing the product portfolios of the major companies in the ecosystem, and rating the companies by their performance and quality. Various sources were referred to in the secondary research process to identify and collect information for this study. The secondary sources included annual reports, press releases, investor presentations of companies, white papers, journals, certified publications, and articles from recognized authors, directories, and databases.
In the secondary research process, various secondary sources were referred to to identify and collect information related to the study. Secondary sources included annual reports, press releases, and investor presentations of CAE vendors, forums, certified publications, and whitepapers. The secondary research was used to obtain essential information on the industry’s value chain, the total pool of key players, market classification, and segmentation from the market and technology-oriented perspectives.
Primary Research
In the primary research process, various supply and demand sources were interviewed to obtain qualitative and quantitative information for this report. The primary sources from the supply side included industry experts, such as Chief Executive Officers (CEOs), Vice Presidents (VPs), marketing directors, technology and innovation directors, and related key executives from various key companies and organizations operating in the CAE market.
After the complete market engineering (calculations for market statistics, market breakdown, market size estimations, market forecasting, and data triangulation), extensive primary research was conducted to gather information and verify and validate the critical numbers arrived at. Primary research was also undertaken to identify the segmentation types, industry trends, competitive landscape of CAE software tools and services offered by various market players, and fundamental market dynamics, such as drivers, restraints, opportunities, challenges, industry trends, and key player strategies.
In the complete market engineering process, the top-down and bottom-up approaches and several data triangulation methods were extensively used to perform the market estimation and market forecasting for the overall market segments and subsegments listed in this report. Extensive qualitative and quantitative analysis was performed on the complete market engineering process to list the key information/insights throughout the report.
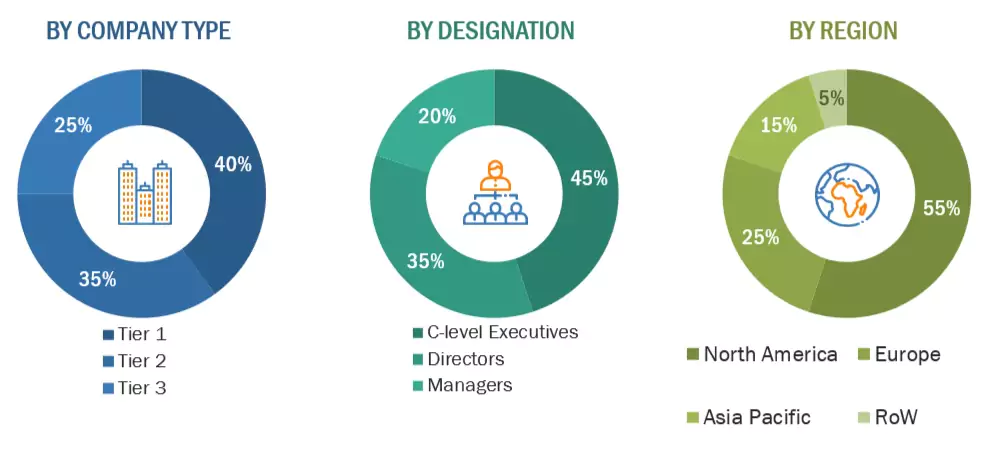
Note: The companies were categorized based on their total annual revenue; tier 1 companies = revenue
greater than USD 10 billion; tier 2 companies = revenue between USD 1 billion and USD 10 billion; tier 3
companies = revenue between USD 500 million and USD 1 billion.
Source: MarketsandMarkets Analysis
To know about the assumptions considered for the study, download the pdf brochure
Market Size Estimation
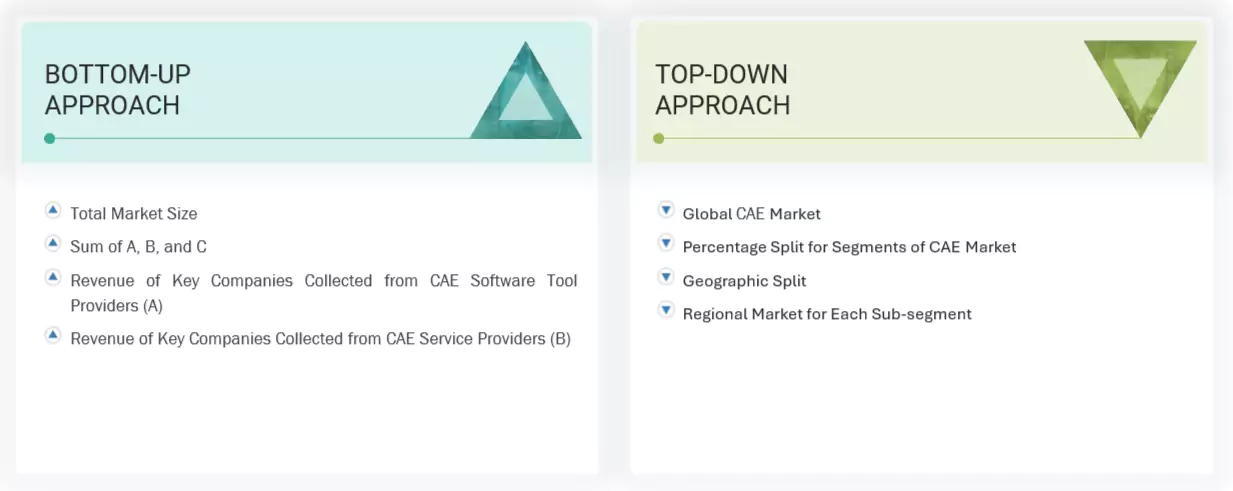
Top-down and bottom-up approaches were used to estimate and validate the size of the CAE market and the size of various other dependent sub-segments. The research methodology used to estimate the market size included the following details: key players in the market were identified through secondary research, and their market shares in the respective regions were determined through primary and secondary research. This entire procedure included the study of the annual and financial reports of the top market players, and extensive interviews were conducted for key insights from the industry leaders, such as CEOs, VPs, directors, and marketing executives.
All percentage splits and breakdowns were determined using secondary sources and verified through primary sources. All possible parameters that affect the market covered in this research study were accounted for, viewed in extensive detail, verified through primary research, and analyzed to get the final quantitative and qualitative data. This data was consolidated and added to detailed inputs and analysis from MarketsandMarkets.
Computer Aided Engineering (CAE) Market : Top-Down and Bottom-Up Approach
Data Triangulation
After arriving at the overall market size using the market size estimation processes explained above, the market was split into several segments and subsegments. The data triangulation and market breakup procedures were employed, wherever applicable, to complete the overall market engineering process and arrive at the exact statistics of each market segment and subsegment. The data was triangulated by studying various factors and trends from both the demand and supply sides.
Market Definition
According to MarketsandMarkets, Computer Aided Engineering (CAE) encompasses the entire product engineering process, from design and virtual testing to manufacturing planning. Initially based on finite element methods, CAE now integrates a wide range of performance analysis techniques, including structural, thermal, electromagnetic, aeronautic, and acoustic simulations. By leveraging advanced analytical algorithms, CAE streamlines product development and enhances the efficiency of the manufacturing process.
Stakeholders
- Technology Providers
- Business Analysts
- Third-party Vendors
- Investors and Venture Capitalists
- System Integrators
- Value-added Resellers (VARs)
- Information Technology (IT) Security Agencies
- Distribution Partners
- Product Designers and Engineers
- Manufacturers
- CAE Software Providers
- Quality Assurance Teams
- Research and Development (R&D) Departments
- Project Managers
- Industry Regulators and Standards Organizations
- Suppliers and Material Vendors
- Consultants and CAE Service Providers
- Customers and End Users
Report Objectives
- To define, describe, and forecast the CAE market based on offering, deployment mode, organization size, vertical, and region
- To forecast the market size of the five main regions: North America, Europe, Asia Pacific (APAC), Middle East & Africa (MEA), and Latin America
- To analyze the subsegments of the market concerning individual growth trends, prospects, and contributions to the overall market
- To provide detailed information related to the primary factors (drivers, restraints, opportunities, and challenges) influencing the growth of the market
- To analyze opportunities in the market for stakeholders by identifying high-growth segments of the market
- To profile the key players of the market and comprehensively analyze their market size and core competencies
- To track and analyze competitive developments, such as product launches, mergers and acquisitions, partnerships, agreements, and collaborations in the market
Available Customizations
With the given market data, MarketsandMarkets offers customizations based on company-specific needs. The following customization options are available for the report:
Geographic Analysis as per Feasibility
- Further breakup of the Asia Pacific market into countries contributing 75% to the regional market size
- Further breakup of the North American market into countries contributing 75% to the regional market size
- Further breakup of the Latin American market into countries contributing 75% to the regional market size
- Further breakup of the Middle Eastern and African market into countries contributing 75% to the regional market size
- Further breakup of the European market into countries contributing 75% to the regional market size
Company Information
- Detailed analysis and profiling of additional market players (up to 5)
Get the Full Computer-aided Engineering (CAE) Market Report
Full forecast, segment splits, and company analysis for all Computer-aided Engineering (CAE) Market.
- Canada Computer-aided Engineering (CAE) Market
- US Computer-aided Engineering (CAE) Market
- United Kingdom Computer-aided Engineering (CAE) Market
- Germany Computer-aided Engineering (CAE) Market
- France Computer-aided Engineering (CAE) Market
- Italy Computer-aided Engineering (CAE) Market
- China Computer-aided Engineering (CAE) Market
- Japan Computer-aided Engineering (CAE) Market
- India Computer-aided Engineering (CAE) Market
- Singapore Computer-aided Engineering (CAE) Market
- South Africa Computer-aided Engineering (CAE) Market
- Brazil Computer-aided Engineering (CAE) Market
- Mexico Computer-aided Engineering (CAE) Market
- Rest Of Europe Computer-aided Engineering (CAE) Market
- Rest Of Latin America Computer-aided Engineering (CAE) Market
- GCC Computer-aided Engineering (CAE) Market
- UK Computer-aided Engineering (CAE) Market
Need a Tailored Report?
Customize this report to your needs
Get 10% FREE Customization
Customize This Report
