
Rest Of Asia Pacific Contactless Connector Market (2024-2029)

The Rest Of Asia Pacific Contactless Connector Market was valued at $6.1 Million in 2024 and projected to reach to $12.1 Million by 2029, representing a compound annual growth rate of 14.5%. Rest Of Asia Pacific's contactless connector market is positioned for substantial growth through 2029, driven by rapid industrialization, increasing automation investments, and growing consumer demand for wireless connectivity solutions.


| Market Size in | USD 26.32 MN |
| Market Forecast in | |
| CAGR | |
| Forecast Period | |
| Units Considered | Value (USD MN) |
Rest Of Asia Pacific Contactless Connector Market Trends and Insights
- Rest Of Asia Pacific represents a critical emerging segment within the broader Asia Pacific region, driven by increasing adoption of contactless technologies across industrial, automotive, and consumer electronics applications.
- The region's expansion is fueled by rising digitalization initiatives, growing demand for wireless power transfer solutions, and heightened focus on hygiene-driven connectivity standards in the post-pandemic era. Rest Of Asia Pacific's 14.5% compound annual growth rate reflects strong market momentum as manufacturers and OEMs invest in next-generation connector technologies.
- The forecast period from 2024 to 2029 demonstrates Rest Of Asia Pacific's potential to capture significant market share through infrastructure modernization and supply chain diversification away from traditional manufacturing hubs.
- Rest Of Asia Pacific's growth trajectory is supported by favorable regulatory environments, increasing R&D investments, and strategic partnerships between local and international technology providers..
Key Market Statistics
- CAGR (2024-2029) 14.5% CAGR
- Market Size, 2024 ~USD 6.1 Million
- Forecast, 2029 ~USD 12.1 Million
- Country Rest Of Asia Pacific
Rest Of Asia Pacific Contactless Connector Market Overview
Rapid Market Expansion :
Rest Of Asia Pacific contactless connector market is growing at 14.5% CAGR, nearly matching the global growth rate of 16.9%, indicating strong regional momentum and increasing technology adoption across emerging economies.
Significant Value Growth :
Market valuation is expected to nearly double from $6.1 million in 2024 to $12.1 million by 2029, reflecting accelerating demand for contactless solutions in industrial automation and consumer electronics sectors.
Emerging Technology Hub :
Rest Of Asia Pacific represents a critical growth segment within the broader Asia Pacific region, driven by manufacturing expansion, rising IoT adoption, and increasing investment in smart infrastructure across developing nations.
Cross-Sector Adoption :
Contactless connector technology is gaining traction across industrial, automotive, and consumer electronics applications, with Rest Of Asia Pacific emerging as a key market for manufacturers seeking growth opportunities beyond mature markets.
Rest Of Asia Pacific Contactless Connector Market Dynamics
- The region's emerging economies are adopting contactless technologies at accelerating rates, supported by government initiatives promoting smart manufacturing and digital transformation.
- Key growth drivers include expanding automotive production, rising IoT deployments, and increasing adoption of contactless payment and identification systems across retail and logistics sectors. The competitive landscape in Rest Of Asia Pacific is becoming increasingly dynamic, with both global manufacturers and regional players establishing production facilities and distribution networks.
- Investment in R&D for miniaturized and cost-effective contactless connectors is intensifying, particularly targeting price-sensitive markets.
- Supply chain localization efforts and strategic partnerships with regional distributors are expected to enhance market penetration, while regulatory harmonization across ASEAN nations will further facilitate market expansion and standardization of contactless connector solutions..
Market Ecosystem
Related Ecosystem
Electronics System And Components
- Sensors
- Temperature Sensors
- Pressure Sensors
- Actuators
- Image Sensors
- Lenovo
- Samsung
- Texas Instruments Incorporated
- HONEYWELL INTERNATIONAL INC.
- Teledyne Technologies Incorporated
Automotive Electronics And Electrical Equipment
- Battery Electric Vehicle (BEV)
- Light Commercial Vehicles (LCVs)
- Fuel Cell Electric Vehicle (FCEV)
- Sensors
- Hybrid Electric Vehicle (HEV)
- BOSCH LIMITED
- DENSO Corporation
- Continental ag
- Panasonic Holdings Corporation
- Texas Instruments Incorporated
Communication And Connectivity Technology
- Sensors
- Smart Card & Readers
- Cellular Network
- Femtocell
- Image Sensors
- Cisco Systems, Inc.
- HUAWEI TECHNOLOGIES CO LTD
- Lenovo
- CommScope Holding Company, Inc.
- Texas Instruments Incorporated
Key Takeaways
- Rest Of Asia Pacific's contactless connector market will nearly double from $6.1M (2024) to $12.1M (2029), representing a 14.5% CAGR.
- Rest Of Asia Pacific is emerging as a high-growth region driven by industrial automation, automotive electrification, and consumer electronics demand.
- Rest Of Asia Pacific benefits from supply chain diversification strategies and increased foreign direct investment in semiconductor and electronics manufacturing.
- Rest Of Asia Pacific's market expansion is supported by regulatory support for wireless technologies and growing adoption of Industry 4.0 standards.
Contactless Connector Market Report Scope
| Report Metric | Details |
|---|---|
| Base Year | 2024 |
| Fastest Growing Segment | UP TO 6 GBPS (Data Rate) |
| Forecast Period | 2024-2029 |
| Growth Rate | CAGR of 16.9% from 2024 to 2029 |
| Largest Segment | 1 GBPS (Data Rate) |
| Market Size Base Year (Billions) | ~USD 0.22 (2024) |
| Revenue Forecast (Billions) | ~USD 0.48 (2029) |
| Segments Covered | Product Type, Technology, Vertical, Data Rate, North America, Europe, Asia Pacific, Row, Segment |
Rest Of Asia Pacific Contactless Connector Market Report Segmentation
9 segment dimensions are covered across the global market.
By Product Type
- Wireless Charging Connectors
- Wireless Data Transfer Connectors
By Technology
- Inductive Coupling
- Magnetic Field
- Radio Frequency
By Vertical
- Automotive
- Consumer Electronics
- Healthcare
- Industrial
By Data Rate
- 1 Gbps
- 3 Gbps
- Up To 6 Gbps
By North America
- Canada
- Mexico
- US
By Europe
- France
- Germany
- Rest Of Europe
- UK
By Asia Pacific
- China
- Japan
- Rest Of Asia Pacific
- South Korea
By Row
- Africa
- Middle East
- South America
By Segment
- Row
Target Audience
- Electronics Manufacturers : Manufacturers seeking to expand production capabilities in Rest Of Asia Pacific need detailed market insights to identify demand hotspots, assess local competition, and optimize product portfolios for regional customer requirements.
- Automotive Suppliers : Automotive component suppliers targeting Rest Of Asia Pacific's growing vehicle production require market data to understand contactless connector adoption rates, OEM specifications, and regional supply chain opportunities.
- Industrial Automation Companies : Industrial automation providers expanding into Rest Of Asia Pacific markets need regional market intelligence to identify IoT and smart manufacturing adoption trends, customer segments, and competitive positioning strategies.
- Investment & Strategy Teams : Corporate development and investment professionals evaluating market entry, acquisitions, or partnerships in Rest Of Asia Pacific require comprehensive market analysis to support due diligence and strategic planning decisions.
- Technology Distributors : Regional distributors and channel partners need market forecasts and segment analysis for Rest Of Asia Pacific to optimize inventory management, identify growth sectors, and develop targeted sales strategies for contactless connector solutions.
Reasons to Buy this Report
- Regional Market Sizing & Forecasts : Obtain precise valuation data specific to Rest Of Asia Pacific ($6.1M in 2024, $12.1M by 2029) with detailed year-by-year projections, enabling accurate budget allocation and revenue forecasting for regional expansion strategies.
- Competitive Landscape Intelligence : Understand regional competitive dynamics, identify key players establishing operations in Rest Of Asia Pacific, and assess market entry barriers specific to emerging economies within the region.
- Sector-Specific Growth Opportunities : Analyze contactless connector adoption patterns across industrial, automotive, and consumer electronics sectors in Rest Of Asia Pacific, identifying high-potential application areas and customer segments for targeted market penetration.
- Regulatory & Supply Chain Insights : Access region-specific regulatory requirements, tariff considerations, and supply chain localization trends affecting contactless connector distribution and manufacturing in Rest Of Asia Pacific markets.
- Strategic Investment Decisions : Make informed decisions on market entry timing, partnership opportunities, and resource allocation for Rest Of Asia Pacific based on comprehensive growth drivers, market maturity assessment, and competitive positioning analysis.
Frequently asked questions
What is the market size of contactless connectors in Rest Of Asia Pacific?
Rest Of Asia Pacific's contactless connector market was valued at $6.1 million in 2024 and is forecast to reach $12.1 million by 2029.
What is the growth rate for contactless connectors in Rest Of Asia Pacific?
Rest Of Asia Pacific is experiencing a compound annual growth rate (CAGR) of 14.5% from 2024 to 2029.
What are the primary drivers of growth in Rest Of Asia Pacific's contactless connector market?
Rest Of Asia Pacific's growth is driven by industrial automation adoption, automotive electrification, wireless power transfer demand, and post-pandemic hygiene-focused connectivity standards.
Which industries are adopting contactless connectors most rapidly in Rest Of Asia Pacific?
Rest Of Asia Pacific is seeing rapid adoption across industrial automation, automotive, consumer electronics, medical devices, and telecommunications sectors.
How does Rest Of Asia Pacific's growth compare to the global contactless connector market?
Rest Of Asia Pacific's 14.5% CAGR is competitive with the global market's 16.9% CAGR, positioning the region as a significant growth contributor within Asia Pacific.
RESEARCH METHODOLOGY
The study involved four major activities in estimating the current size of the contactless connector market. Exhaustive secondary research was done to collect information on the market, peer market, and parent market. The next step was to validate these findings, assumptions, and sizing with industry experts across the value chain through primary research. Both top-down and bottom-up approaches were employed to estimate the complete market size. After that, market breakdown and data triangulation were used to estimate the market size of segments and subsegments.
Secondary Research
Secondary sources for this research study included corporate filings (such as annual reports, investor presentations, and financial statements); trade, business, and professional associations; white papers; certified publications; articles by recognized authors; directories; and databases. The secondary data was collected and analyzed to determine the overall market size, further validated through primary research.
List of major secondary sources
|
SOURCE |
SWEB LINK |
|
Federal Communications Commission (FCC) |
|
|
National Institute of Standards and Technology (NIST) |
|
|
Ministry of Electronics and Information Technology (MeitY) |
|
|
Ministry of Industry and Information Technology (MIIT) |
|
|
Ministry of Internal Affairs and Communications (MIC) |
Primary Research
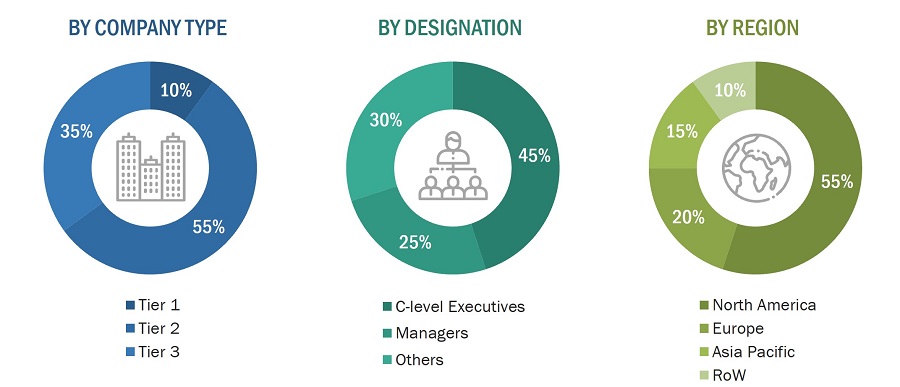
Extensive primary research was conducted after gaining knowledge about the current scenario of the contactless connector market through secondary research. Several primary interviews were conducted with experts from both demand and supply sides across four major regions—North America, Europe, Asia Pacific, and RoW. This primary data was collected through questionnaires, emails, and telephonic interviews.
To know about the assumptions considered for the study, download the pdf brochure
Market Size Estimation
Both top-down and bottom-up approaches were used to estimate and validate the size of the contactless connector market and its various dependent submarkets. The key players in the market were identified through secondary research, and their market share in the respective regions was determined through primary and secondary research. This entire procedure involved the study of annual and financial reports of top players and extensive interviews with industry leaders such as chief executive officers (CEOs), vice presidents (VPs), directors, and marketing executives. All percentage shares and breakdowns were determined using secondary sources and verified through primary sources. All the possible parameters that affect the markets covered in this research study were accounted for, viewed in extensive detail, verified through primary research, and analyzed to obtain the final quantitative and qualitative data. This data was consolidated and supplemented with detailed inputs and analysis from MarketsandMarkets and presented in this report.
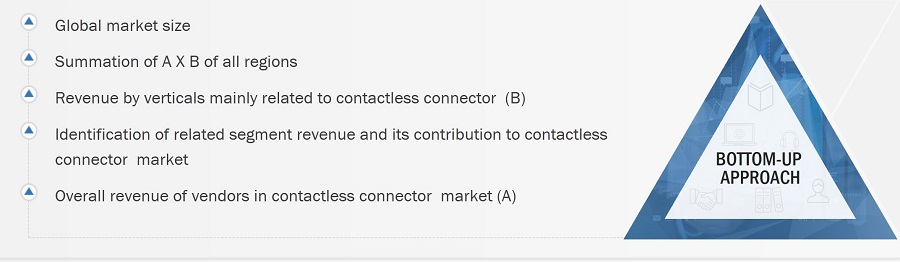
Bottom-Up Approach
The bottom-up approach was used to arrive at the overall size of the contactless connector market from the revenues of the key players and their shares in the market. The overall market size was calculated based on the revenues of the key players identified in the market.
- Identifying various verticals using or expected to implement Contactless connector
- Analyzing each verticals, along with the major related companies and Contactless connector providers
- Estimating the Contactless connector market for verticals
- Understanding the demand generated by companies operating across different verticals
- Tracking the ongoing and upcoming implementation of projects based on Contactless connector technology by vertical and forecasting the market based on these developments and other critical parameters
- Carrying out multiple discussions with the key opinion leaders to understand the type of Contactless connector products designed and developed vertically. This information would help analyze the breakdown of the scope of work carried out by each major company in the Contactless connector market
- Arriving at the market estimates by analyzing Contactless connector companies as per their countries, and subsequently combining this information to arrive at the market estimates by region
- Verifying and cross-checking the estimates at every level through discussions with the key opinion leaders, including CXOs, directors, and operations managers, and finally with domain experts at MarketsandMarkets
- Studying various paid and unpaid sources of information, such as annual reports, press releases, white papers, and databases
Top-Down Approach
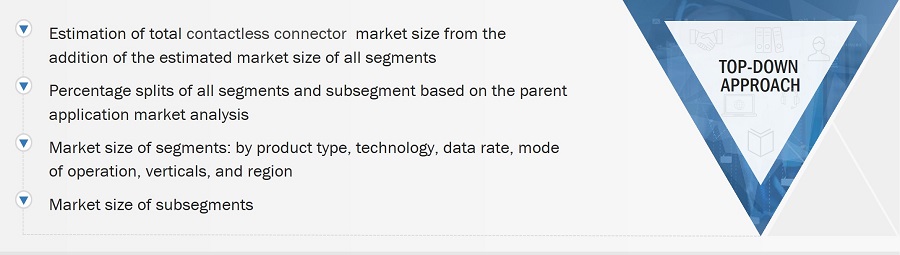
In the top-down approach, the overall market size has been used to estimate the size of the individual markets (mentioned in the market segmentation) through percentage splits from secondary and primary research.
To calculate the market size of specific segments, the most appropriate immediate parent market size has been used to implement the top-down approach. The top-down approach was implemented for the data extracted from the secondary research to validate the market size obtained.
The market share of each company was estimated to verify the revenue shares used earlier in the top-down approach. The overall parent market size and individual market sizes were determined and confirmed in this study by the data triangulation method and the validation of data through primaries. The data triangulation method used in this study is explained in the next section.
- Focusing on top-line investments and expenditures being made in the ecosystems of various verticals.
- Building and developing the information related to the market revenue generated by key Contactless connector manufacturers
- Conducting multiple on-field discussions with the key opinion leaders involved in the development of Contactless connector products in various verticals
- Estimating geographic splits using secondary sources based on various factors, such as the number of players in a specific country and region, the offering of Contactless connector, and the level of solutions offered in verticals
- Impact of the recession on the steps mentioned above has also been considered.
Data Triangulation
After arriving at the overall market size from the estimation process explained above, the overall market has been split into several segments and subsegments. To complete the overall market engineering process and arrive at the exact statistics for all segments and subsegments, the data triangulation procedure has been employed wherever applicable. The data has been triangulated by studying various factors and trends from both demand and supply sides. Along with this, the market size has been validated using top-down and bottom-up approaches.
Market Definition
Contactless connector encompass a comprehensive set of measures, technologies, and practices designed to protect physical assets, facilities, and individuals from unauthorized access, theft, vandalism, and other potential threats. These solutions often include a combination of hardware and software components such as access control systems, surveillance cameras, perimeter barriers (e.g., fences, gates), alarm systems, biometric identification systems, and visitor management systems. The primary goal is to create a secure environment that deters intrusions, monitors activities and responds promptly to security incidents. By deploying tailored physical contactless connector, organizations can safeguard their premises, assets, and personnel, thereby mitigating risks, ensuring safety compliance, and maintaining operational continuity.
Key Stakeholders
- Component Manufacturers
- End-User Organizations
- System Integrators
- Consumers
- Regulatory Bodies and Compliance Agencies
- Research Institutions
- Distributors and Resellers
- Industry Associations and Organizations
- Investors and Financial Institutions
Report Objectives
- To define, describe, and forecast the contactless connector market based on product type, technology, data rate, mode of operation, vertical, and region.
- To forecast the shipment data of contactless connector market.
- To forecast the size of the market segments for four major regions—North America, Europe, Asia Pacific (APAC), and the Rest of the World (RoW)
- To provide detailed information regarding the major factors influencing the growth of the market (drivers, restraints, opportunities, and challenges)
- To strategically analyze micro-markets with respect to individual growth trends, prospects, and contributions to the total market
- To study the complete value chain and allied industry segments and perform a value chain analysis of the market
- To strategically profile the key players and comprehensively analyze their market shares and core competencies
- To analyze the opportunities in the market for stakeholders and describe the competitive landscape of the market
- To analyze competitive developments such as collaborations, partnerships, product developments, and research & development (R&D) in the market
- To analyze the impact of the recession on the contactless connector market
Available Customizations
With the given market data, MarketsandMarkets offers customizations according to the specific requirements of companies. The following customization options are available for the report:
- Detailed analysis and profiling of additional market players (up to 5)
- Additional country-level analysis of the contactless connector market
Product Analysis
- Product matrix, which provides a detailed comparison of the product portfolio of each company in the contactless connector market.
Get the Full Contactless Connector Market Report
Full forecast, segment splits, and company analysis for all Contactless Connector Market.
- Canada Contactless Connector Market
- US Contactless Connector Market
- Mexico Contactless Connector Market
- UK Contactless Connector Market
- Germany Contactless Connector Market
- France Contactless Connector Market
- China Contactless Connector Market
- Japan Contactless Connector Market
- South Korea Contactless Connector Market
- Rest Of Europe Contactless Connector Market
Need a Tailored Report?
Customize this report to your needs
Get 10% FREE Customization
Customize This Report
