
South America DERMS Architecture & Edge Control Market (2026-2031)

The South America DERMS Architecture & Edge Control Market was valued at $31.6 Million in 2026 and projected to reach to $62.8 Million by 2031, representing a compound annual growth rate of 14.3%. South America's DERMS Architecture & Edge Control Market is positioned for significant expansion as the region prioritizes grid modernization and renewable energy integration.


| Market Size in | USD 26.32 MN |
| Market Forecast in | |
| CAGR | |
| Forecast Period | |
| Units Considered | Value (USD MN) |
South America DERMS Architecture & Edge Control Market Trends and Insights
- This 14.3% compound annual growth rate reflects South America's increasing investment in grid modernization and distributed energy resource management across the region.
- South America's energy transition is driving adoption of advanced control systems and edge computing architectures to optimize renewable integration and grid stability. The South America market benefits from rising renewable energy penetration, regulatory support for smart grid initiatives, and growing utility investment in digital infrastructure.
- South America's diverse geography and expanding electrification demands are accelerating the deployment of DERMS solutions to manage complex, distributed generation portfolios.
- By 2031, South America is expected to capture a larger share of regional energy technology spending as utilities prioritize real-time monitoring and autonomous edge control capabilities..
Key Market Statistics
- CAGR (2026-2031) 14.3% CAGR
- Market Size, 2026 ~USD 31.6 Million
- Forecast, 2031 ~USD 62.8 Million
- Geography South America
South America DERMS Architecture & Edge Control Market Overview
Rapid Market Expansion :
South America's DERMS Architecture & Edge Control Market is experiencing robust growth, expanding from $31.6 million in 2026 to $62.8 million by 2031, representing a 14.3% CAGR driven by regional grid modernization initiatives.
Brazil's Market Leadership :
Brazil dominates South America's DERMS market with $30.8 million in 2026, leveraging its advanced renewable energy infrastructure and commitment to distributed energy resource integration across its vast territory.
Energy Transition Catalyst :
South America's shift toward renewable energy sources and decentralized power systems is accelerating DERMS adoption, with utilities investing heavily in edge control technologies to optimize grid performance and reliability.
Regional Infrastructure Investment :
Government initiatives and private sector investments in smart grid infrastructure across South America are creating substantial opportunities for DERMS solutions, particularly in emerging markets like Argentina and Chile.
South America DERMS Architecture & Edge Control Market Dynamics
- The market's 14.3% CAGR reflects increasing investments in distributed energy resource management infrastructure, driven by regulatory frameworks supporting energy transition and the need for enhanced grid stability across diverse geographical terrains. The region's growing focus on sustainability and energy independence is propelling utilities and energy providers to adopt advanced DERMS solutions.
- With Brazil leading market adoption and emerging economies like Argentina expanding their renewable portfolios, South America presents substantial growth opportunities for technology providers and system integrators specializing in edge control and distributed energy management architectures..
Market Ecosystem
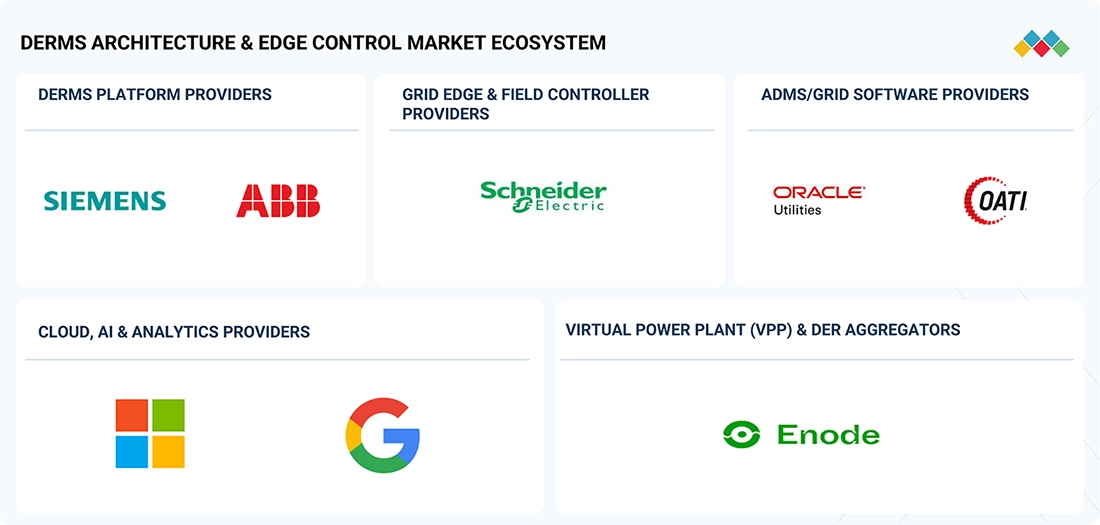
DERMS ARCHITECTURE & EDGE CONTROL MARKET: COMMERCIAL USE CASES ACROSS INDUSTRIES
| COMPANY | USE CASE DESCRIPTION | BENEFITS |
|---|---|---|
 |
North Carolina Electric Membership Corporation (NCEMC) deployed OATI webSmartEnergy® DERMS to coordinate distributed energy resources across its network of 26 electric cooperatives. The platform enables utilities to monitor, dispatch, and manage distributed assets, including battery storage, microgrids, rooftop solar, and smart thermostats, via a unified operational dashboard, while supporting real-time demand response and grid flexibility. | The deployment improved visibility and control of distributed energy resources, enabled centralized management of demand response programs across multiple cooperatives, enhanced grid reliability, and supported faster dispatch decisions during peak demand events. The solution also simplified DER integration and improved operational efficiency and system flexibility. |
 |
EnergyHub partnered with Oracle Utilities to integrate Mercury DERMS with Oracle's utility network management platform, enabling utilities to monitor and orchestrate customer-owned distributed energy resources, such as smart thermostats, electric vehicles, batteries, and solar systems. The integrated platform extends real-time visibility and control from customer devices to utility distribution operations. | The integrated solution improved customer participation in distributed energy programs, increased visibility into behind-the-meter assets, enabled real-time DER dispatch for load and voltage management, and helped utilities optimize distribution operations while supporting greater renewable energy integration and grid flexibility. |
Logos and trademarks shown above are the property of their respective owners. Their use here is for informational and illustrative purposes only.
Related Ecosystem
Smart Energy And Digital Solutions
- Cellular Network
- Analytics Software
- Geographical Information System (GIS)
- Meter Data Management (MDM)
- Smart Meters
- Siemens ag
- SCHNEIDER ELECTRIC SE
- ABB India Limited
- General Electric Company
- Eaton Corporation plc
Smart Grid
- Meter Data Management (MDM)
- Sensors
- Workforce Management
- Cellular Network
- Customer Analytics
- SCHNEIDER ELECTRIC SE
- Siemens ag
- ABB India Limited
- Eaton Corporation plc
- Hitachi Energy India Limited
Key Takeaways
- South America's DERMS market will double from $31.6M (2026) to $62.8M (2031), driven by renewable energy integration and grid modernization initiatives across the region.
- South America's 14.3% CAGR reflects accelerating utility investment in edge control architectures to manage distributed energy resources and improve grid resilience.
- South America's regulatory environment and renewable energy targets are catalyzing adoption of advanced DERMS solutions for real-time grid optimization.
- South America's market growth is supported by increasing electrification demands and the need for autonomous, decentralized control systems in complex energy networks.
DERMS Architecture & Edge Control Market Report Scope
| Report Metric | Details |
|---|---|
| Base Year | 2026 |
| Fastest Growing Segment | INDUSTRIAL MICROGRID OWNERS (Distributed Energy Asset Owner Type) |
| Forecast Period | 2026-2031 |
| Growth Rate | CAGR of 18.8% from 2026 to 2031 |
| Largest Segment | DISTRIBUTION SYSTEM OPERATORS (End User) |
| Market Size Base Year (Billions) | ~USD 1.72 (2026) |
| Revenue Forecast (Billions) | ~USD 4.07 (2031) |
| Segments Covered | Type, Application, Grid Flexibility & Network Optimization Application, End User, Distributed Energy Asset Owner Type, End User 2021-2025, Type 2021-2025, End User 2026-2031 |
South America DERMS Architecture & Edge Control Market Report Segmentation
8 segment dimensions are covered across the global market.
By Type
- Field Edge Controller
- Field Edge Controllers
- Grid Derms
- Hierarchical Derms
By Application
- Distributed Energy Resource Coordination
- Grid Flexibility & Network Optimization
- Grid Services & Demand Flexibility
- Microgrid & Local Energy Management
By Grid Flexibility & Network Optimization Application
- Active Network Management (Anm)
- Flexible Connections
By End User
- Distributed Energy Asset Owners
- Distribution System Operators
By Distributed Energy Asset Owner Type
- Industrial Microgrid Owners
- Utility-Scale Der Owners
By End User 2021-2025
- Distributed Energy Asset Owners
- Distribution System Operators
By Type 2021-2025
- Field Edge Controllers
- Grid Derms
- Hierarchical Derms
By End User 2026-2031
- Distributed Energy Asset Owners
- Distribution System Operators
Target Audience
- Utility Companies & Grid Operators : South American utilities require detailed market intelligence to plan DERMS investments, optimize grid operations, and align with regional energy transition mandates and regulatory requirements.
- Technology & Solution Providers : DERMS vendors and edge control technology companies need South America-specific market data to identify growth opportunities, assess competitive positioning, and develop region-tailored product strategies.
- Energy & Infrastructure Investors : Investment firms and private equity groups evaluating South American energy infrastructure opportunities require market sizing and growth forecasts to support investment thesis development and portfolio decisions.
- Government & Regulatory Bodies : South American energy regulators and government agencies need market intelligence to inform policy development, grid modernization initiatives, and renewable energy integration strategies across the region.
- Consulting & Advisory Firms : Management consultants and strategic advisors serving South American energy clients require authoritative market data to support client engagements, feasibility studies, and strategic recommendations.
Countries within South America - compare and drill down
| Country | 2025 size (native) |
|---|---|
| Brazil | USD 30.8 Million |
| Argentina | USD 7.2 Million |
| Rest Of South America | USD 13.3 Million |
Country market size visualization
Reasons to Buy this Report
- Market Size & Growth Trajectory : Gain precise market valuation data for South America's DERMS sector with detailed forecasts through 2031, enabling accurate investment planning and resource allocation decisions for regional expansion strategies.
- Country-Level Intelligence : Access granular market data for Brazil, Argentina, and other South American nations, identifying high-potential markets and understanding localized adoption patterns for targeted market entry strategies.
- Competitive Landscape Analysis : Understand regional competitive dynamics, key players, and market positioning within South America's DERMS sector to inform product development and go-to-market strategies specific to regional requirements.
- Investment & Growth Opportunities : Identify emerging opportunities in South America's energy transition, including government initiatives, utility partnerships, and infrastructure projects driving DERMS adoption across the region.
- Strategic Decision Support : Leverage comprehensive South America-specific insights to support board-level decisions, partnership evaluations, and market entry planning with confidence in regional market dynamics and growth potential.
Frequently asked questions
What is the projected market size for DERMS Architecture & Edge Control in South America by 2031?
South America's DERMS Architecture & Edge Control Market is forecast to reach $62.8 million by 2031, up from $31.6 million in 2026, representing a 14.3% CAGR.
What is driving DERMS adoption in South America?
South America's DERMS adoption is driven by renewable energy integration, grid modernization initiatives, regulatory support for smart grids, and the need to manage distributed energy resources efficiently.
How does South America's DERMS market growth compare to global trends?
South America's 14.3% CAGR is below the global 18.8% CAGR, reflecting regional differences in infrastructure maturity, investment capacity, and regulatory frameworks across the continent.
Which countries in South America are leading DERMS adoption?
South America's largest markets include Brazil, Chile, and Colombia, where utilities are investing heavily in grid modernization and renewable energy integration technologies.
What role does edge control play in South America's energy transition?
Edge control systems enable South America's utilities to manage distributed generation autonomously, reduce latency in grid operations, and optimize renewable energy dispatch in real-time across diverse regional networks.
RESEARCH METHODOLOGY
The research process for this technical, market-oriented, and commercial study of the DERMS architecture and edge control market involved systematic collection, validation, and analysis of information on distributed energy resource management technologies, grid-edge control solutions, and utility digitalization initiatives. Extensive secondary research drew on annual reports, investor presentations, technical papers, regulatory publications, industry databases, company websites, and financial reports to identify key market participants, technology trends, and competitive developments. Findings were further validated through primary interviews with executives from DERMS software providers, utilities, system integrators, and industry experts to confirm market estimates, technology adoption trends, and competitive positioning. Key market players and their market positions were established through a combination of secondary research and primary validation with senior executives, business development managers, and technology specialists across the DERMS ecosystem.
Secondary Research
In the secondary research process, various sources were consulted to identify and collect information relevant to this study. Secondary sources included annual reports, investor presentations, press releases, company websites, technical white papers, industry journals, regulatory publications, and recognized databases. Publications from organizations such as the US Department of Energy (DOE), National Renewable Energy Laboratory (NREL), Federal Energy Regulatory Commission (FERC), International Energy Agency (IEA), Electric Power Research Institute (EPRI), and IEEE were also reviewed to understand grid modernization initiatives, DER integration, and evolving DERMS architectures. Secondary research was primarily conducted to obtain information on the DERMS value chain, key market participants, technology trends, architecture evolution, market segmentation, regional adoption patterns, and recent developments from both market and technology perspectives.
Primary Research
During the primary research phase, key stakeholders from both the supply and demand sides were interviewed to obtain qualitative and quantitative information for this report. Throughout the market engineering process, a combination of top-down and bottom-up approaches, supported by data triangulation, was employed to estimate market sizes and forecast the value of all segments and subsegments covered in the study. Extensive primary discussions were conducted to validate market estimates, technology adoption trends, competitive positioning, and regional demand patterns. Following the market engineering process, which included market sizing, forecasting, segmentation, and data validation, interviews with industry experts were used to verify critical data points and refine the final estimates. Primary research also helped identify emerging technology trends, key applications, competitive developments, and the evolving adoption of DERMS architecture & edge control solutions across utilities, renewable energy developers, industrial microgrids, and other end users.
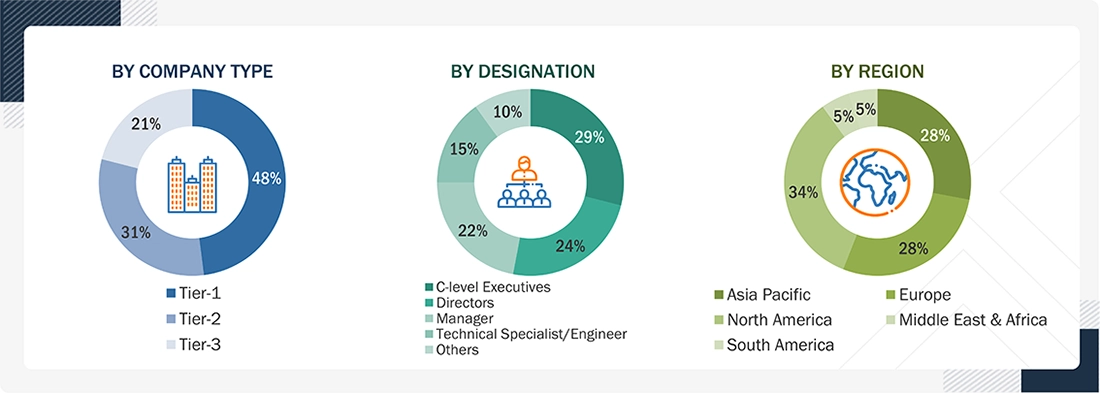
Note: Managers include sales managers, production managers, and regional managers.
Tier 1 company: revenue >USD 5 billion; tier 2 company: revenue between USD 1 and USD 5 billion; and tier 3 company: revenue <USD 1 billion in 2025
To know about the assumptions considered for the study, download the pdf brochure
Market Size Estimation
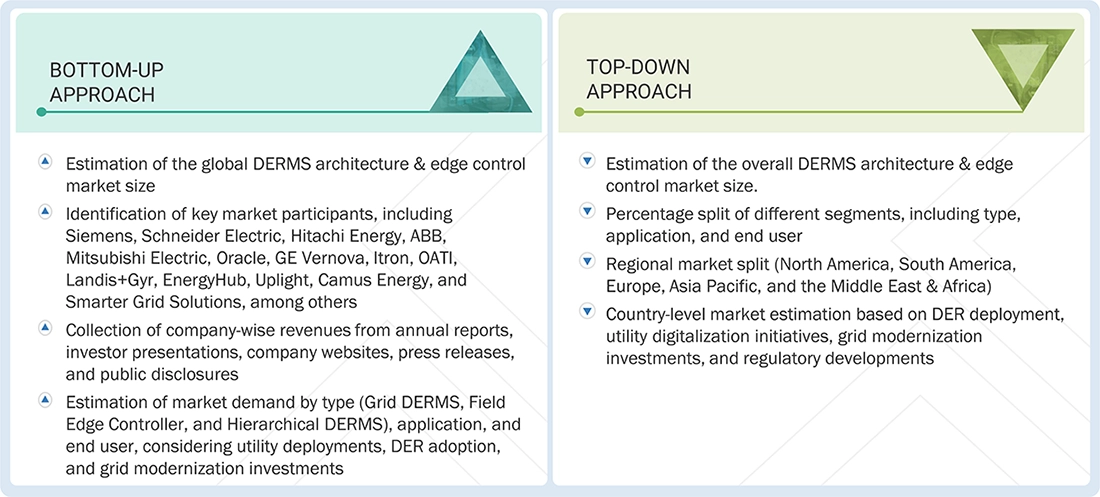
Bottom-up Approach
- Estimating the market size across architecture types, applications, and end-user segments by analyzing revenues generated from DERMS architecture & edge control solutions and consolidating them to derive the overall market size.
- Mapping leading market participants, including Siemens, Schneider Electric, Hitachi Energy, ABB, Mitsubishi Electric, Oracle, GE Vernova, Itron, OATI, Landis+Gyr, EnergyHub, Uplight, Camus Energy, and Smarter Grid Solutions, among others.
- Collecting segment-wise revenue information from annual reports, investor presentations, company websites, press releases, regulatory filings, and other publicly available disclosures.
- Estimating demand across major applications, including grid flexibility & network optimization (active network management and flexible connections), distributed energy resource coordination, microgrid & local energy management, and grid services & demand flexibility, based on utility deployments, project announcements, and technology adoption.
- Incorporating qualitative factors such as grid modernization investments, distributed energy resource penetration, utility digitalization initiatives, interoperability requirements, regulatory developments, and technology advancements into the market forecasting model.
Top-down Approach
- Estimating the overall DERMS architecture & edge control market by analyzing global investments in grid modernization, distributed energy resources (DERs), utility digitalization, and grid-edge technologies.
- Allocating the market across type (Grid DERMS, Field Edge Controller, and Hierarchical DERMS), application (Grid Flexibility & Network Optimization, Distributed Energy Resource Coordination, Microgrid & Local Energy Management, and Grid Services & Demand Flexibility), and end user (Distribution System Operators, Distributed Energy Asset Owners, Utility-scale DER Owners, Industrial Microgrid Owners, and Data Centers).
- Distributing market estimates across North America, South America, Europe, Asia Pacific, and the Middle East & Africa, followed by country-level analysis based on DER deployment, utility digitalization initiatives, grid modernization investments, and regulatory developments.
- Validating the final market estimates through primary interviews with DERMS software providers, utilities, system integrators, technology vendors, and industry experts, followed by data triangulation to ensure consistency and accuracy.
DERMS Architecture & Edge Control Market : Top-Down and Bottom-Up Approach
Data Triangulation
The process of determining the overall market size involved the methodologies described earlier, followed by segmenting the market into multiple segments and subsegments. To finalize the comprehensive market analysis and obtain precise statistics for each market segment and subsegment, data triangulation and market breakdown procedures were applied, wherever appropriate. Data triangulation was accomplished by examining various factors and trends from both the demand and supply sides of the DERMS architecture & edge control ecosystem, including technology adoption, utility investments, distributed energy resource deployment, competitive developments, and regional market dynamics.
Market Definition
The DERMS architecture & edge control market comprises revenues generated from software platforms, edge control solutions, and related services that enable utilities and grid operators to monitor, coordinate, and optimize distributed energy resources (DERs) across electricity distribution networks. The market includes Grid DERMS, Field Edge Controllers, and Hierarchical DERMS deployed to support grid flexibility, distributed energy resource coordination, microgrid and local energy management, and grid services. These solutions are used by distribution system operators, distributed energy asset owners, utility-scale DER owners, industrial microgrid operators, and data centers to improve grid visibility, reliability, and operational efficiency while enabling higher penetration of distributed energy resources.
Key Stakeholders
- Utilities & Distribution System Operators (DSOs)
- Utility-scale DER Owners
- Industrial Microgrid Operators
- Renewable Energy Developers
- Grid Technology Vendors
- System Integrators
- EPC & Engineering Firms
- Government & Regulatory Bodies
- Industry Associations
- Consulting & Advisory Firms
Report Objectives
- To describe and forecast the DERMS architecture & edge control market by type, application, and end user, in terms of value
- To forecast the market size across North America, South America, Europe, Asia Pacific, and the Middle East & Africa, along with country-level analysis for key markets
- To provide detailed information regarding the major drivers, restraints, opportunities, and challenges influencing market growth
- To analyze adoption trends across Grid DERMS, Field Edge Controllers, and Hierarchical DERMS architectures and identify high-growth application areas
- To analyze market opportunities for stakeholders and provide a comprehensive competitive landscape of key market participants
- To profile leading companies by evaluating their product portfolios, market positioning, competitive strategies, and core competencies
- To analyze competitive developments, including partnerships, agreements, collaborations, product launches, investments, and acquisitions undertaken by key players
Available customizations:
With the given market data, MarketsandMarkets offers customizations based on the company’s specific needs. The following customization options are available for the report:
Product Analysis
- Product Matrix, which provides a detailed comparison of the product portfolio of each company
Company Information
-
Detailed analyses and profiling of additional market players (up to 5)
Get the Full DERMS Architecture & Edge Control Market Report
Full forecast, segment splits, and company analysis for all DERMS Architecture & Edge Control Market.
- US DERMS Architecture & Edge Control Market
- Canada DERMS Architecture & Edge Control Market
- Mexico DERMS Architecture & Edge Control Market
- Germany DERMS Architecture & Edge Control Market
- Denmark DERMS Architecture & Edge Control Market
- UK DERMS Architecture & Edge Control Market
- France DERMS Architecture & Edge Control Market
- China DERMS Architecture & Edge Control Market
- Australia DERMS Architecture & Edge Control Market
- South Korea DERMS Architecture & Edge Control Market
- Japan DERMS Architecture & Edge Control Market
- Brazil DERMS Architecture & Edge Control Market
- Argentina DERMS Architecture & Edge Control Market
- South Africa DERMS Architecture & Edge Control Market
- Rest Of Europe DERMS Architecture & Edge Control Market
- Rest Of Asia Pacific DERMS Architecture & Edge Control Market
- GCC DERMS Architecture & Edge Control Market
- Rest Of South America DERMS Architecture & Edge Control Market
Need a Tailored Report?
Customize this report to your needs
Get 10% FREE Customization
Customize This Report
