
Asia Pacific Digital Denture Market (2026-2031)

The Asia Pacific Digital Denture Market was valued at $229.2 Million in 2026 and projected to reach to $337.4 Million by 2031, representing a compound annual growth rate of 8.0%. The Asia Pacific digital denture market is positioned for sustained growth through 2031, fueled by demographic trends and technological advancement.


| Market Size in | USD 26.32 MN |
| Market Forecast in | |
| CAGR | |
| Forecast Period | |
| Units Considered | Value (USD MN) |
Asia Pacific Digital Denture Market Trends and Insights
- Asia Pacific's market expansion is driven by rising geriatric populations, increasing dental awareness, and rapid adoption of CAD/CAM technologies across the region.
- The region's growing middle class and improving healthcare infrastructure are accelerating demand for advanced prosthodontic solutions. Asia Pacific's digital denture sector benefits from lower manufacturing costs and expanding dental tourism, positioning the region as a key growth hub.
- Major markets within Asia Pacific, including China, India, and Japan, are investing heavily in digital dentistry infrastructure.
- The 8.0% CAGR reflects Asia Pacific's strong potential as manufacturers and dental practitioners increasingly transition from traditional to digital denture fabrication methods..
Key Market Statistics
- CAGR (2026-2031) 8.0% CAGR
- Market Size, 2026 ~USD 229.2 Million
- Forecast, 2031 ~USD 337.4 Million
- Geography Asia Pacific
Asia Pacific Digital Denture Market Overview
Market Valuation Growth :
Asia Pacific digital denture market valued at $229.2 million in 2026, expanding to $337.4 million by 2031, representing an 8% CAGR driven by regional technological adoption and demographic shifts.
Geriatric Population Surge :
Rising geriatric populations across Asia Pacific nations are significantly driving demand for advanced denture solutions, with aging demographics creating sustained market opportunities through 2031.
CAD/CAM Technology Adoption :
Rapid adoption of CAD/CAM technologies across Asia Pacific is revolutionizing denture manufacturing, improving precision, reducing production time, and enhancing patient outcomes in the region.
Healthcare Infrastructure Expansion :
Improving healthcare infrastructure and growing middle-class populations in Asia Pacific countries are increasing accessibility to digital denture solutions and driving market penetration.
Asia Pacific Digital Denture Market Dynamics
- The region's expanding geriatric population, coupled with increasing dental awareness and rising disposable incomes, creates a favorable environment for digital denture adoption.
- Healthcare infrastructure improvements across major Asia Pacific economies are enabling broader access to advanced dental technologies. Key growth drivers include the rapid integration of CAD/CAM systems in dental laboratories, growing patient preference for precision-engineered dentures, and supportive government healthcare initiatives.
- The region's competitive manufacturing landscape and cost advantages position Asia Pacific as a critical hub for digital denture innovation and production, attracting both regional and global market participants..
Market Ecosystem
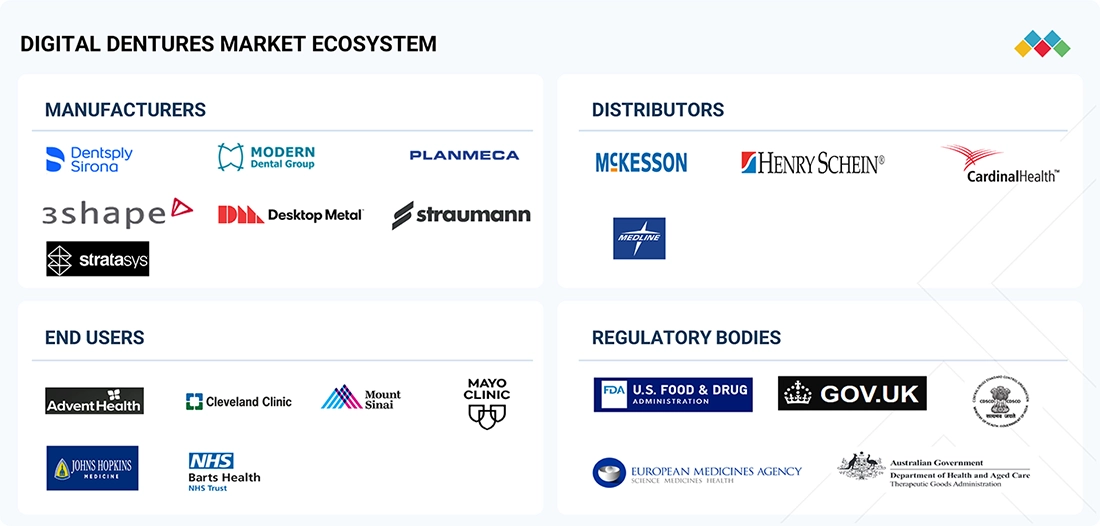
DIGITAL DENTURE MARKET: COMMERCIAL USE CASES ACROSS INDUSTRIES
| COMPANY | USE CASE DESCRIPTION | BENEFITS |
|---|---|---|
 |
3Shape offers advanced intraoral scanning technology that facilitates the creation of a digital impression for denture planning and production. These intraoral scanning systems are commonly employed in dental and hospital settings to precisely capture intraoral information for patients requiring partial or complete dentures. This marks the initial step in a fully digital denture production chain. | 3Shape intraoral scanners can enhance the accuracy of impressions, patient comfort, and consistency of data, and at the same time, they completely remove the need for traditional impression materials. The digital scans can be used for the accurate design of dentures, thus the number of remakes is decreased, the treatment time is shortened, and the CAD/CAM and 3D printing systems can be integrated seamlessly. |
 |
The company, Dentsply Sirona, provides digital denture base materials required for CAD/CAM and 3D printing to create custom denture bases. The product helps dental labs and dental clinics in producing aesthetically attractive and strong digital dentures. | High strength, excellent fit, and natural aesthetics are some of the characteristics that the digital denture base materials have; patient comfort and satisfaction are greatly improved. Their compatibility with digital manufacturing also helps increase production efficiency, reduce manual work, and maintain consistent quality in denture cases. |
 |
Straumann manufactures advanced dental resin materials. These materials are applied in the production of digital dentures by using additive manufacturing and milling technologies. Such materials have the capability to create partial and full dentures with a high degree of accuracy. | Straumann's resin materials are characterized by superior biocompatibility, mechanical stability, and color accuracy, enabling users to achieve comfortable, durable dentures. These materials facilitate high-speed production, are highly reproducible, and can be integrated into digital workflows in a very straightforward way, thereby improving clinical outcomes and laboratory efficiency. |
 |
The company offers specialized dental materials suitable for 3D printing in digital denture production. The materials are used in large-scale production in dental labs focused on denture bases and teeth production. | Desktop Metals' dental materials enable high-speed printing, reduced material waste, and economical mass production of digital dentures. Their consistency, longevity, and compliance with regulatory requirements enable more efficient workflows, faster turnaround times, and dependable denture quality. |
 |
Modern Dental Group provides digital dental prosthetics, including digital dentures, through its global laboratory network. The company combines digital scanning, design, and manufacturing capabilities to provide customized denture care. | Modern Dental Group's digital prosthetics offer excellent precision, consistent quality, and enhanced aesthetics on a large scale. The company's powerful production facilities enable quicker delivery, lower costs, and broader market access, thereby supporting the growing use of digital dentures in both developed and emerging regions. |
Logos and trademarks shown above are the property of their respective owners. Their use here is for informational and illustrative purposes only.
Related Ecosystem
Dental Devices
- Dental Implants
- Dental Bone Grafts
- Dental Crowns
- Dental Prosthetics
- Zirconium Implants
- DENTSPLY SIRONA Inc.
- Henry Schein, Inc.
- KAVO KERR GROUP
- PLANMECA GROUP
- Patterson Companies, Inc.
Medical Devices
- Polymerase Chain Reaction (PCR)
- Magnetic Resonance Imaging (MRI)
- Disposable Autoinjectors
- Pulse Oximeters
- Blood Pressure Monitors
- Medtronic plc
- Abbott Laboratories
- Stryker Corporation
- Becton, Dickinson and Company
- CONMED Corporation
Key Takeaways
- Asia Pacific digital denture market grows from $229.2M (2026) to $337.4M (2031) at 8.0% CAGR
- Asia Pacific's aging population and rising dental awareness drive sustained market expansion
- Asia Pacific benefits from cost-competitive manufacturing and growing dental technology adoption
- Asia Pacific emerging markets, particularly China and India, represent significant growth opportunities
Digital Denture Market Report Scope
| Report Metric | Details |
|---|---|
| Base Year | 2026 |
| Fastest Growing Segment | INTRAORAL SCANNERS (Type) |
| Forecast Period | 2026–2031 |
| Growth Rate | CAGR of 8.1% from 2026 to 2031 |
| Largest Segment | FIXED DENTURES (Usability) |
| Market Size Base Year (Billions) | ~USD 1.13 (2026) |
| Revenue Forecast (Billions) | ~USD 1.67 (2031) |
| Segments Covered | Product, Type, Usability, End User |
Asia Pacific Digital Denture Market Report Segmentation
4 segment dimensions are covered across the global market.
By Product
- Equipment
- Materials
- Software
By Type
- 3D Printers
- Complete Dentures
- Diagnostic Software
- Intraoral Scanners
- Manufacturing Software
- Metals
- Milling Machines
- Other Materials
- Partial Dentures
- Plastics
- Resins
By Usability
- Fixed Dentures
- Removable Dentures
By End User
- Dental Hospitals & Clinics
- Dental Laboratories
- Other End Users
Target Audience
- Dental Device Manufacturers : Manufacturers need Asia Pacific market data to identify expansion opportunities, understand regional demand for digital denture solutions, and develop localized product strategies for high-growth markets.
- Healthcare Investors & PE Firms : Investment professionals require detailed Asia Pacific market forecasts and growth drivers to evaluate portfolio opportunities, assess market attractiveness, and make informed capital deployment decisions.
- Dental Laboratory Operators : Lab operators need regional market insights to understand technology adoption trends, competitive dynamics, and growth opportunities for digital denture services across Asia Pacific countries.
- Healthcare Consultants & Advisors : Consultants require Asia Pacific-specific market intelligence to advise clients on market entry strategies, competitive positioning, and growth opportunities in the digital denture sector.
- Government & Healthcare Policy Makers : Policy makers need market data to understand digital denture adoption trends, healthcare infrastructure needs, and opportunities to support dental technology advancement across Asia Pacific regions.
Key Companies in the Asia Pacific Digital Denture Market
| Company | HQ | Ownership | Strongest segments |
|---|---|---|---|
| DENTSPLY SIRONA | United States | Public Company | Connected Technology Solutions (imaging, CAD/CAM, treatment centers, DS Core),Essential Dental Solutions (endodontics, restorative, preventive, anesthetics),Orthodontic and Implant Solutions (SureSmile, implants, digital dentures, prosthetics), |
| MODERN DENTAL GROUP LIMITED | Hong Kong | Public Company | Fixed Prosthetic Devices (crowns, bridges, implants),Removable Prosthetic Devices (full and partial dentures),Orthodontic Devices & Clear Aligners, |
| STRATASYS | United States | Public Company | FDM printers and consumables,PolyJet printers, dental/medical systems, and consumables,SLA (Neo range) and Origin P3/SAF industrial systems, |
| 3D SYSTEMS, INC. | United States | Public Company | Healthcare Solutions (medical and dental printers, materials, software, services),Industrial Solutions (polymer and metal printers, materials, services),Software platforms (3D Sprint, 3DXpert, Oqton and related tools), |
DENTSPLY SIRONA
DENTSPLY SIRONA is a United States-based public company founded in 1877 with 14,000 employees. The company operates as a major dental equipment and supplies manufacturer serving the global dental industry.
MODERN DENTAL GROUP LIMITED
MODERN DENTAL GROUP LIMITED is a Hong Kong-based public company founded in 1986 with 8,538 employees. The company operates as a dental services and products provider.
STRATASYS
STRATASYS is a United States-based public company with 1,757 employees. The company operates in the 3D printing and additive manufacturing industry.
3D SYSTEMS, INC.
3D SYSTEMS, INC. is a United States-based public company founded in 1986 with 1,418 employees. The company specializes in 3D printing and digital manufacturing technologies.
Countries within Asia Pacific - compare and drill down
| Country | 2025 size (native) |
|---|---|
| China | USD 34.41 Million |
| Japan | USD 32.46 Million |
| India | USD 14 Million |
| Australia | USD 8.73 Million |
| South Korea | USD 6.57 Million |
| Rest Of Asia Pacific | USD 8.02 Million |
Country market size visualization
Reasons to Buy this Report
- Regional Market Sizing & Forecasts : Obtain precise market valuations for Asia Pacific ($229.2M in 2026) with detailed 5-year forecasts to 2031, enabling accurate business planning and investment decisions specific to the region.
- Country-Level Intelligence : Access granular market data across major Asia Pacific economies including China, Japan, India, Australia, and South Korea to identify high-growth opportunities and market entry strategies.
- Growth Driver Analysis : Understand key regional growth catalysts including geriatric population trends, healthcare infrastructure development, and CAD/CAM technology adoption rates across Asia Pacific markets.
- Competitive Landscape Insights : Benchmark against regional competitors and identify market gaps in Asia Pacific's digital denture sector to develop targeted go-to-market strategies and competitive positioning.
- Investment & Expansion Strategy : Leverage Asia Pacific-specific market intelligence to guide capital allocation, partnership development, and expansion decisions in the fastest-growing digital denture region globally.
Frequently asked questions
What is the current size of the Asia Pacific digital denture market?
The Asia Pacific digital denture market is valued at $229.2 million in 2026 and is expected to grow to $337.4 million by 2031.
What is the projected growth rate for Asia Pacific digital dentures?
Asia Pacific's digital denture market is projected to grow at a compound annual growth rate (CAGR) of 8.0% from 2026 to 2031.
Which countries in Asia Pacific are driving digital denture market growth?
China, India, and Japan are leading Asia Pacific's digital denture market growth due to aging populations, rising healthcare spending, and increasing adoption of digital dental technologies.
What factors are accelerating Asia Pacific's digital denture adoption?
Key drivers include rising geriatric populations, improved healthcare infrastructure, growing dental awareness, cost-competitive manufacturing, and expanding dental tourism across Asia Pacific.
How does Asia Pacific's digital denture market compare to global trends?
Asia Pacific's 8.0% CAGR aligns closely with the global 8.1% CAGR, reflecting the region's significant contribution to worldwide digital denture market expansion.
RESEARCH METHODOLOGY
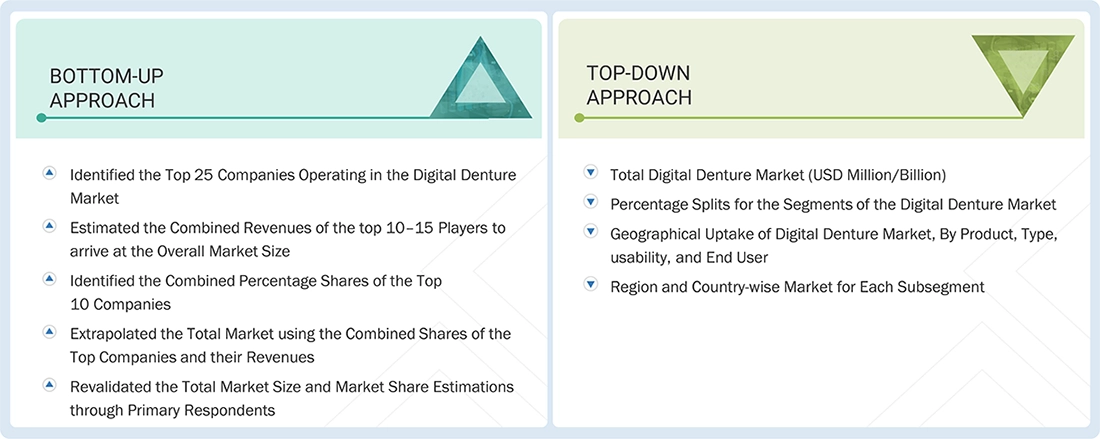
This study involved four major activities in estimating the current digital denture market size. First, extensive secondary research was conducted to gather information on the market, including related and parent markets. The next step was to validate these findings, assumptions, and sizing with industry experts across the value chain through primary research. Both top-down and bottom-up approaches were employed to estimate the complete market size. After that, market breakdown and data triangulation were used to estimate the market size of segments and subsegments.
Secondary Research
The secondary research process involved the extensive use of secondary sources, directories, databases (such as Bloomberg Businessweek, Factiva, and D&B Hoovers), white papers, annual reports, Companies House documents, investor presentations, and SEC filings. Secondary research was used to identify and collect information useful for the extensive, technical, market-oriented, and commercial study of the digital denture market. It was also used to obtain important information about key players, market classification, and segmentation according to industry trends down to the bottom level, and key developments from market and technology perspectives. A database of the key industry leaders was also prepared using secondary research.
Primary Research
In the primary research process, various sources from both the supply and demand sides were interviewed to obtain qualitative and quantitative information for this report. The primary sources from the supply side include industry experts such as CEOs, vice presidents, marketing and sales directors, technology & innovation directors, and related key executives from various key companies and organizations operating in the digital denture market. The primary sources on the demand side included industry experts, purchasing and sales managers, doctors, and personnel from research organizations. Primary research was conducted to validate the market segmentation, identify key players in the market, and gather insights on key industry trends and key market dynamics.
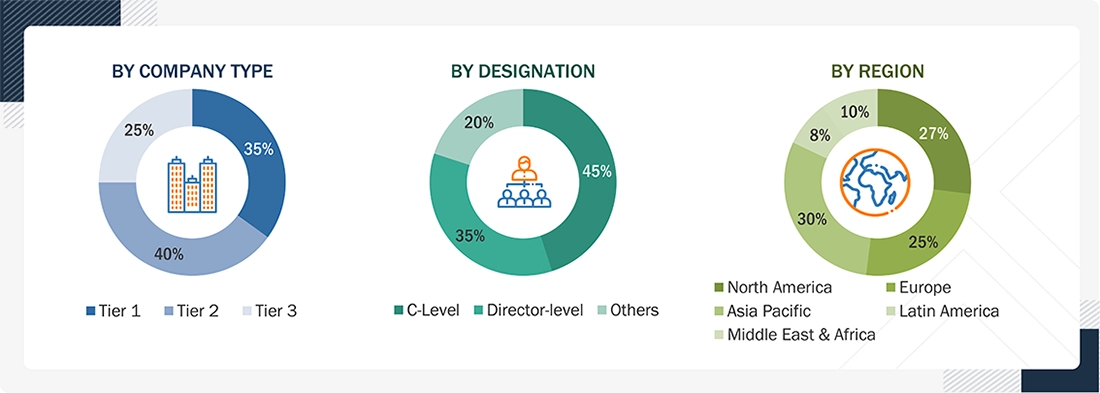
Note 1: C-level primaries include CEOs, CFOs, COOs, and VPs.
Note 2: Other designations include sales managers, marketing managers, business development managers, product managers, distributors, and suppliers.
Note 3: Companies are classified into tiers based on their total revenue. As of 2023, Tier 1 = >USD 10 billion, Tier 2 = USD 1 billion to USD 10 billion, and Tier 3 = <USD 1 billion.
Source: MarketsandMarkets Analysis
To know about the assumptions considered for the study, download the pdf brochure
Market Size Estimation
For the global market value, annual revenues were calculated using revenue mappings of major product manufacturers and OEMs active in the global digital denture market. All the major product manufacturers were identified at the global and/or country/regional level. Revenue mapping for the respective business segments/sub-segments was done for the major players. Also, the global digital denture market was split into various segments and sub-segments based on:
- List of major players operating in the products market at the regional and/or country level
- Product mapping of various digital denture manufacturers at the regional and/or country level
- Mapping of annual revenue generated by listed major players from digital denture (or the nearest reported business unit/product category)
- Revenue mapping of major players to be covered.
- Extrapolation of the revenue mapping of the listed major players to derive the global market value of the respective segments/subsegments
- Summation of the market value of all segments/subsegments to arrive at the global digital denture market
The above-mentioned data was consolidated and added with detailed inputs and analysis from MarketsandMarkets and presented in this report.
Data Triangulation
After determining the overall size of the global digital denture market using the aforementioned methodology, the market was segmented into several subsegments. The data triangulation and market breakdown procedures were employed, where applicable, to complete the overall market engineering process and derive the exact market value data for the key segments and subsegments. The extrapolated market data was triangulated by studying various macroindicators and regional trends from both demand- and supply-side participants.
Market Definition
Digital dentures are dental prostheses created using scanners, design software, and mills or printers. These digital tools can provide greater accuracy, efficiency, and often more comfort for the patient. The digital denture workflow can start in different ways. For example, sometimes a conventional impression is still needed; sometimes a direct scan in the patient’s mouth can be done to create a digital impression for a denture; and sometimes an impression is not needed because the clinician duplicates an existing denture. The way the workflow looks depends entirely on the clinical situation and the type of denture that is created.
Key Stakeholders
- Manufacturers and distributors of medical devices
- Manufacturers and distributors of medical device components
- Digital denture companies
- Healthcare institutes
- Diagnostic laboratories
- Hospitals and clinics
- Academic institutes
- Research institutes
- Government associations
- Market research and consulting firms
- Venture capitalists and investors
Report Objectives
- To define, describe, segment, analyze, and forecast the global digital denture market product, type, usability, end user, and region
- To provide detailed information about the factors influencing the market growth (drivers, restraints, opportunities, and challenges)
- To analyze micromarkets concerning individual growth trends, prospects, and contributions to the overall market
- To analyze market opportunities for stakeholders and provide details of the competitive landscape for key players
- To forecast the size of the digital denture market in North America, Europe, the Asia Pacific, Latin America, and the Middle East & Africa
- To profile the key players in the digital denture market and comprehensively analyze their core competencies.
- To track and analyze competitive developments such as agreements, collaborations, and partnerships; expansions; acquisitions; and product launches and approvals in the market.
Available customizations:
With the given market data, MarketsandMarkets offers customizations as per your company’s specific needs. The following customization options are available for the report:
GEOGRAPHIC ANALYSIS
- Further breakdown of the Rest of Europe digital denture market into Russia, Switzerland, Denmark, Austria, and others
- Further breakdown of the Rest of Asia Pacific digital denture market into South Korea, Taiwan, and others
- Further breakdown of the Rest of Latin America digital denture market into Argentina, Colombia, Chile, Ecuador, and others
- Further breakdown of the Southeast Asia digital denture market into Malaysia, Singapore, New Zealand, and others
COMPETITIVE LANDSCAPE ASSESSMENT
- Market share analysis, by region (North America, Europe, Asia Pacific, Latin America, Middle East, and Africa), which provides market shares of the top 3-5 key players in the digital denture market
- Competitive leadership mapping for established players in the US
Get the Full Digital Denture Market Report
Full forecast, segment splits, and company analysis for all Digital Denture Market.
- Canada Digital Denture Market
- US Digital Denture Market
- Germany Digital Denture Market
- France Digital Denture Market
- UK Digital Denture Market
- Italy Digital Denture Market
- Spain Digital Denture Market
- China Digital Denture Market
- Japan Digital Denture Market
- India Digital Denture Market
- Australia Digital Denture Market
- South Korea Digital Denture Market
- Brazil Digital Denture Market
- Mexico Digital Denture Market
- Argentina Digital Denture Market
- GCC Countries Digital Denture Market
- Rest Of Europe Digital Denture Market
- Rest Of Asia Pacific Digital Denture Market
- Rest Of Latin America Digital Denture Market
Need a Tailored Report?
Customize this report to your needs
Get 10% FREE Customization
Customize This Report
