
Asia Pacific Eco-Friendly Plasticizers Market (2024-2029)

The Asia Pacific Eco-Friendly Plasticizers Market was valued at $1128.4 Million in 2024 and projected to reach to $1271.5 Million by 2029, representing a compound annual growth rate of 6.0%. Asia Pacific's eco-friendly plasticizers market is poised for sustained growth through 2029, supported by increasingly stringent environmental regulations and corporate sustainability commitments across the region.


| Market Size in | USD 26.32 MN |
| Market Forecast in | |
| CAGR | |
| Forecast Period | |
| Units Considered | Value (USD MN) |
Asia Pacific Eco-Friendly Plasticizers Market Trends and Insights
- The region's expansion is driven by stringent environmental regulations, rising consumer awareness of sustainable materials, and increasing adoption of bio-based and non-toxic plasticizers across packaging, automotive, and consumer goods sectors.
- Asia Pacific's manufacturing base and growing middle-class population create substantial demand for compliant, environmentally responsible plastic products. The Asia Pacific eco-friendly plasticizers market is experiencing steady growth at a 6.0% compound annual growth rate through the forecast period.
- Key markets within Asia Pacific, including China, India, and Southeast Asia, are accelerating investments in green chemistry and sustainable production technologies.
- Asia Pacific's regulatory landscape, particularly in the European Union-aligned standards and domestic environmental policies, is compelling manufacturers to transition from conventional phthalate-based plasticizers to safer alternatives. Asia Pacific's competitive advantage lies in its cost-effective production capabilities and proximity to raw material sources.
- The region's commitment to circular economy principles and corporate sustainability initiatives is reshaping the eco-friendly plasticizers landscape, positioning Asia Pacific as a critical hub for innovation and market expansion through 2029..
Key Market Statistics
- CAGR (2024-2029) 6.0% CAGR
- Market Size, 2024 ~USD 1128.4 Million
- Forecast, 2029 ~USD 1271.5 Million
- Geography Asia Pacific
Asia Pacific Eco-Friendly Plasticizers Market Overview
Market Valuation & Growth :
Asia Pacific eco-friendly plasticizers market valued at USD 1,128.4 million in 2024, with projected growth to USD 1,271.5 million by 2029, representing a steady 6% CAGR driven by regional sustainability initiatives.
Regulatory Drivers :
Stringent environmental regulations across Asia Pacific nations, including restrictions on phthalates and bisphenol compounds, are accelerating the shift toward bio-based and non-toxic plasticizer alternatives in manufacturing.
Consumer Awareness & Demand :
Rising consumer consciousness regarding sustainable materials in Asia Pacific is fueling demand for eco-friendly plasticizers across packaging, automotive, and consumer goods sectors, particularly in developed economies.
Industry Adoption Trends :
Increasing adoption of bio-based and non-toxic plasticizers by manufacturers in packaging, automotive, and electronics industries reflects Asia Pacific's commitment to circular economy principles and sustainable production practices.
Asia Pacific Eco-Friendly Plasticizers Market Dynamics
- China and India are emerging as key growth engines, driven by expanding manufacturing sectors and rising environmental compliance standards.
- The automotive and packaging industries are leading adoption, with manufacturers transitioning to bio-based alternatives to meet regulatory requirements and consumer expectations. The region's growth trajectory will be further accelerated by technological advancements in bio-plasticizer production, government incentives for green chemistry, and collaborative efforts between industry stakeholders.
- Investment in R&D for innovative, cost-competitive eco-friendly solutions will be critical to capturing market share.
- By 2029, Asia Pacific is expected to solidify its position as a major hub for sustainable plasticizer innovation and consumption..
Market Ecosystem
Related Ecosystem
Green Bio Chemicals
- Animal-Based Sealants
- Bacterial Fermentation
- Corrosion Inhibitors
- Hydrogen Peroxide
- Nitrile Butadiene Rubber (NBR)
- Basf se
- Evonik industries ag
- Solvay sa
- AZELIS HOLDINGS SA
- CARGILL, INCORPORATED
Key Takeaways
- Asia Pacific's eco-friendly plasticizers market is valued at USD 1,128.4 million in 2024 and will reach USD 1,271.5 million by 2029, growing at a 6.0% CAGR.
- Regulatory pressures and environmental compliance requirements across Asia Pacific are accelerating the shift from conventional to bio-based and non-toxic plasticizers.
- Asia Pacific's manufacturing infrastructure and cost advantages position the region as a global leader in sustainable plasticizer production and innovation.
- Growing consumer demand for eco-friendly products in Asia Pacific's packaging, automotive, and consumer goods sectors is driving market expansion through 2029.
Eco-Friendly Plasticizers Market Report Scope
| Report Metric | Details |
|---|---|
| Base Year | 2024 |
| Fastest Growing Segment | -CASTOR OIL (Product) |
| Forecast Period | 2024-2029 |
| Growth Rate | CAGR of 6.7% from 2024 to 2029 |
| Largest Segment | NON-PHTHALATE PLASTICIZERS (Product) |
| Market Size Base Year (Billions) | ~USD 1.78 (2024) |
| Revenue Forecast (Billions) | ~USD 2.46 (2029) |
| Segments Covered | Product, Application |
Asia Pacific Eco-Friendly Plasticizers Market Report Segmentation
2 segment dimensions are covered across the global market.
By Product
- Bio-Based Plasticizers
- Non-Phthalate Plasticizers
- -Adipates
- -Benzoates
- -Castor Oil
- -Citrate
- -Epoxidized Soyabean Oil (Esbo)
- -Epoxies
- -Other Bio-Based Plasticizers
- -Other Non-Phthalate Plasticizers
- -Succinic Acid
- -Trimellitates
By Application
- Agriculture & Horticulture
- Automotive & Transportation
- Building & Construction
- Consumer Goods
- Other Applications
- Packaging
- Textile
Target Audience
- Chemical Manufacturers & Suppliers : Plasticizer producers need Asia Pacific market intelligence to optimize product portfolios, identify regulatory compliance requirements, and capitalize on the 6% CAGR growth opportunity in bio-based alternatives.
- Packaging & Automotive OEMs : Manufacturers in packaging and automotive sectors require detailed market data to source sustainable plasticizers, understand regional supplier landscapes, and meet environmental compliance standards.
- Investment & Private Equity Firms : Investors evaluating opportunities in Asia Pacific's green chemistry sector need comprehensive market sizing, growth forecasts, and competitive analysis to make informed funding and acquisition decisions.
- Regulatory & Compliance Officers : Corporate compliance teams need region-specific regulatory insights and market trends to ensure adherence to Asia Pacific environmental standards and guide sustainable material sourcing strategies.
- Market Researchers & Consultants : Research professionals require detailed Asia Pacific market data, country-level breakdowns, and trend analysis to support client advisory services, strategic planning, and competitive benchmarking.
Countries within Asia Pacific - compare and drill down
| Country | 2025 size (native) |
|---|---|
| China | USD 2547.8 Million |
| Japan | USD 207.6 Million |
| India | USD 654.6 Million |
| South Korea | USD 160 Million |
| Rest Of Asia Pacific | USD 467 Million |
Country market size visualization
Reasons to Buy this Report
- Regional Market Sizing & Forecasts : Obtain precise market valuation data for Asia Pacific (USD 1,128.4M in 2024) with country-level breakdowns for China, India, Japan, and South Korea, enabling accurate business planning and investment decisions.
- Regulatory & Compliance Insights : Understand stringent environmental regulations driving eco-friendly plasticizer adoption across Asia Pacific, helping manufacturers align production strategies with regional compliance requirements and avoid market entry barriers.
- Competitive Landscape Analysis : Identify key market players, emerging competitors, and strategic partnerships within Asia Pacific's eco-friendly plasticizers sector to benchmark performance and identify growth opportunities.
- Industry-Specific Demand Trends : Analyze sector-specific adoption patterns in packaging, automotive, and electronics industries across Asia Pacific, enabling targeted product development and market penetration strategies.
- Investment & Growth Opportunities : Discover high-potential markets and emerging segments within Asia Pacific for expansion, partnerships, and M&A activities, supported by comprehensive growth projections through 2029.
Frequently asked questions
What is the current market size of eco-friendly plasticizers in Asia Pacific?
Asia Pacific's eco-friendly plasticizers market was valued at USD 1,128.4 million in 2024 and is expected to grow to USD 1,271.5 million by 2029.
What is the projected growth rate for Asia Pacific's eco-friendly plasticizers market?
Asia Pacific's eco-friendly plasticizers market is projected to grow at a compound annual growth rate (CAGR) of 6.0% from 2024 to 2029.
Which countries in Asia Pacific are driving eco-friendly plasticizers demand?
Key markets within Asia Pacific, including China, India, and Southeast Asian nations, are driving demand through regulatory compliance, manufacturing expansion, and sustainability initiatives.
What factors are driving the growth of eco-friendly plasticizers in Asia Pacific?
Growth drivers in Asia Pacific include stringent environmental regulations, rising consumer awareness, increasing adoption across packaging and automotive sectors, and corporate sustainability commitments.
What types of eco-friendly plasticizers are most popular in Asia Pacific?
Bio-based plasticizers, non-toxic alternatives to phthalates, and citrate-based compounds are gaining traction in Asia Pacific due to regulatory compliance and consumer preference for safer materials.
RESEARCH METHODOLOGY
The study involved four major activities for estimating the current size of the global flexible eco-friendly plasticizers market. Exhaustive secondary research was conducted to collect information on the market, the peer product market, and the parent product group market. The next step was to validate these findings, assumptions, and sizes with the industry experts across the value chain of eco-friendly plasticizers through primary research. Both the top-down and bottom-up approaches were employed to estimate the overall size of the eco-friendly plasticizers market. After that, market breakdown and data triangulation procedures were used to determine the size of different segments and sub-segments of the market.
Secondary Research
In the secondary research process, various secondary sources such as Hoovers, Factiva, Bloomberg BusinessWeek, and Dun & Bradstreet were referred, to identify and collect information for this study on the eco-friendly plasticizers market. These secondary sources included annual reports, press releases & investor presentations of companies; white papers; certified publications; articles by recognized authors; regulatory bodies, trade directories, and databases.
Primary Research
The eco-friendly plasticizers market comprises several stakeholders in the supply chain, which include raw material suppliers, processors, end-product manufacturers, buyers, and regulatory organizations. Various primary sources from the supply and demand sides of the markets have been interviewed to obtain qualitative and quantitative information. The primary participants from the demand side include key opinion leaders, executives, vice presidents, and CEOs of companies in the eco-friendly plasticizers market. Primary sources from the supply side include associations and institutions involved in the eco-friendly plasticizers market, key opinion leaders, and processing players.
Following is the breakdown of primary respondents:
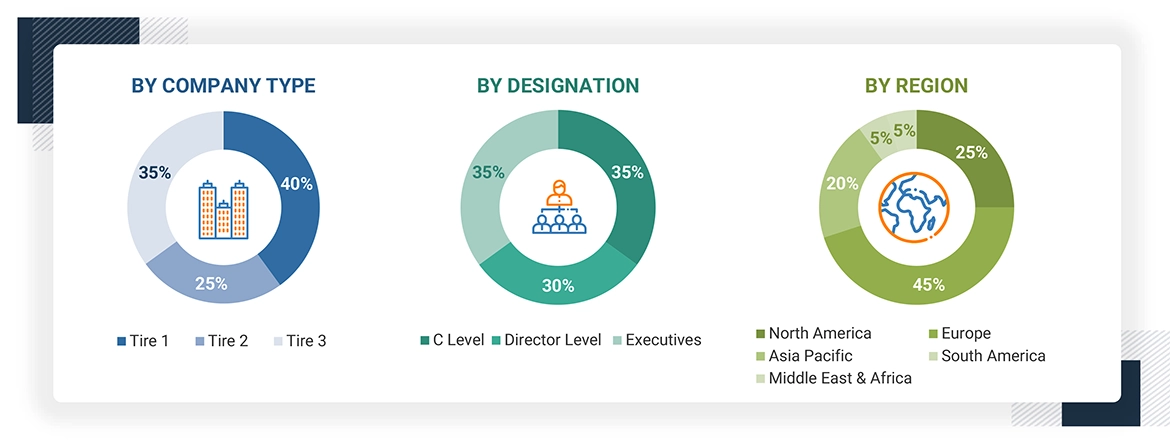
To know about the assumptions considered for the study, download the pdf brochure
Market Size Estimation
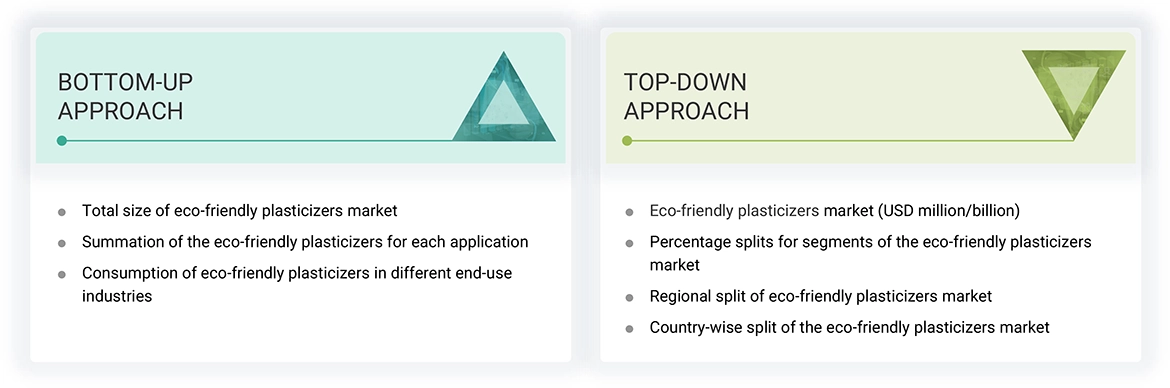
The bottom-up and top-down approaches have been used to estimate the eco-friendly plasticizers market by packaging product, application, and region. The research methodology used to calculate the market size includes the following steps:
- The key players in the industry and markets were identified through extensive secondary research.
- In terms of value, the industry’s supply chain and market size were determined through primary and secondary research processes.
- All percentage shares, splits, and breakdowns were determined using secondary sources and verified through primary sources.
- All possible parameters that affect the markets covered in this research study were accounted for, viewed in extensive detail, verified through primary research, and analyzed to obtain the final quantitative and qualitative data.
- The research included studying reports, reviews, and newsletters of top market players and extensive interviews with leaders such as directors and marketing executives to obtain opinions.
The following figure illustrates the overall market size estimation process employed for this study.
Data Triangulation
After arriving at the overall size of the eco-friendly plasticizer market from the estimation process explained above, the total market was split into several segments and sub-segments. The data triangulation and market breakdown procedures were employed, wherever applicable, to complete the overall market engineering process and arrive at the exact statistics for all segments and subsegments. The data was triangulated by studying various factors and trends from both the demand and supply sides. Along with this, the market size was validated using both the top-down and bottom-up approaches.
Market Definition
The definition of eco-friendly plasticizers is additives that enhance the flexibility and workability of plastic materials, bringing a very minimal effect on the environment and health. The basis of these plasticizers is renewable sources or such that they are known to be nontoxic, providing safer alternatives in contrast to traditional phthalate-based plasticizers that have been linked to various health risks, including endocrine disruption. There is building momentum within the eco-friendly plasticizer space from growing consumer awareness around sustainability, stringent regulatory requirements, and upticks in demand for greener products across multiple industries including packaging, automotive, and construction. As the carbon footprint of industries continues to minimize and conform to standards based on environmental regulations, the presence of ecological plasticizers is turning into a vital component of creating sustainable materials that will significantly promote innovation and growth in this market.
Stakeholders
- Eco-Friendly Plasticizer Manufacturers
- Raw Material Suppliers
- Regulatory Bodies and Government Agencies
- Distributors and Suppliers
- End-Use Industries
- Associations and Industrial Bodies
- Market Research and Consulting Firms
Report Objectives
- To define, describe, and forecast the size of the eco-friendly plasticizers market in terms of value and volume.
- To provide detailed information regarding the key factors influencing the growth of the market (drivers, restraints, opportunities, and challenges).
- To forecast the market size based on product, application and region.
- To forecast the market size for the five main regions—North America, Europe, Asia Pacific (APAC), South America and the Middle East & Africa (MEA),—along with their key countries.
- To strategically analyze micro markets with respect to individual growth trends, prospects, and contributions to the total market.
- To analyze the opportunities in the market for stakeholders and provide details of the competitive landscape for the market leaders.
- To strategically profile leading players and comprehensively analyze their key developments such as new product launches, expansions, and deals in the eco-friendly plasticizers market.
- To strategically profile key players and comprehensively analyze their market shares and core competencies.
- To study the impact of AI/Gen AI on the market under study, along with the macroeconomic outlook.
Get the Full Eco-Friendly Plasticizers Market Report
Full forecast, segment splits, and company analysis for all Eco-Friendly Plasticizers Market.
- US Eco-Friendly Plasticizers Market
- Canada Eco-Friendly Plasticizers Market
- Mexico Eco-Friendly Plasticizers Market
- Germany Eco-Friendly Plasticizers Market
- France Eco-Friendly Plasticizers Market
- Spain Eco-Friendly Plasticizers Market
- UK Eco-Friendly Plasticizers Market
- Italy Eco-Friendly Plasticizers Market
- China Eco-Friendly Plasticizers Market
- Japan Eco-Friendly Plasticizers Market
- India Eco-Friendly Plasticizers Market
- South Korea Eco-Friendly Plasticizers Market
- Brazil Eco-Friendly Plasticizers Market
- Argentina Eco-Friendly Plasticizers Market
- South Africa Eco-Friendly Plasticizers Market
- Rest Of Europe Eco-Friendly Plasticizers Market
- Rest Of Asia Pacific Eco-Friendly Plasticizers Market
- GCC Countries Eco-Friendly Plasticizers Market
- -Rest Of GCC Countries Eco-Friendly Plasticizers Market
- Rest Of South America Eco-Friendly Plasticizers Market
Need a Tailored Report?
Customize this report to your needs
Get 10% FREE Customization
Customize This Report
