
Peru Fishery By-products Market (2025-2030)

The Peru Fishery By-products Market was valued at $637.7 Million in 2025 and projected to reach to $829.5 Million by 2030, representing a compound annual growth rate of 5.4%. Peru's fishery by-products market is positioned for sustained growth driven by the country's exceptional marine resources and established fishing infrastructure.


| Market Size in | USD 26.32 MN |
| Market Forecast in | |
| CAGR | |
| Forecast Period | |
| Units Considered | Value (USD MN) |
Peru Fishery By-products Market Trends and Insights
- Peru's position as a leading global fishing nation drives significant demand for value-added by-products including fish meal, fish oil, and collagen-based ingredients.
- The market in Peru benefits from abundant marine resources and established processing infrastructure that converts fishing waste into high-value commodities for animal feed, pharmaceuticals, and nutraceutical applications. Growth in Peru's fishery by-products sector is supported by rising global demand for sustainable protein sources and increasing adoption of circular economy practices in the fishing industry.
- Peru's processors are expanding capacity to meet international standards for quality and traceability, particularly in premium fish oil and specialized protein markets.
- Between 2025 and 2030, Peru is expected to capitalize on growing export opportunities and domestic consumption trends, positioning the country as a key supplier of fishery by-products in South America and globally..
Key Market Statistics
- CAGR (2025-2030) 5.4% CAGR
- Market Size, 2025 ~USD 637.7 Million
- Forecast, 2030 ~USD 829.5 Million
- Country Peru
Peru Fishery By-products Market Overview
Market Valuation :
Peru's fishery by-products market is valued at USD 637.7 million in 2025, with projections reaching USD 829.5 million by 2030, demonstrating steady growth in this specialized sector.
Global Leadership Position :
Peru ranks among the world's leading fishing nations, with abundant marine resources that generate substantial volumes of by-products including fish meal, fish oil, and collagen-based ingredients for domestic and export markets.
Growth Trajectory :
The Peruvian market is expanding at a CAGR of 5.4% through 2030, outpacing many regional competitors and reflecting increasing demand for sustainable value-added fishery products.
Product Diversification :
Peru's fishery by-products sector encompasses fish meal for animal feed, omega-3 rich fish oil for nutraceuticals, and collagen derivatives for cosmetics and pharmaceuticals, creating multiple revenue streams.
Peru Fishery By-products Market Dynamics
- The 5.4% CAGR through 2030 reflects growing global demand for sustainable protein sources and functional ingredients derived from fish processing waste.
- Peru's competitive advantage lies in its abundant fish stocks, particularly anchoveta, which generates significant by-product volumes for conversion into high-value ingredients. The market outlook is supported by increasing applications in animal nutrition, dietary supplements, and cosmetic formulations.
- Export opportunities remain strong as international markets seek reliable suppliers of fish meal and fish oil.
- Regulatory support for sustainable fishing practices and value-addition initiatives further enhance Peru's market position, attracting investment in processing infrastructure and product innovation..
Market Ecosystem
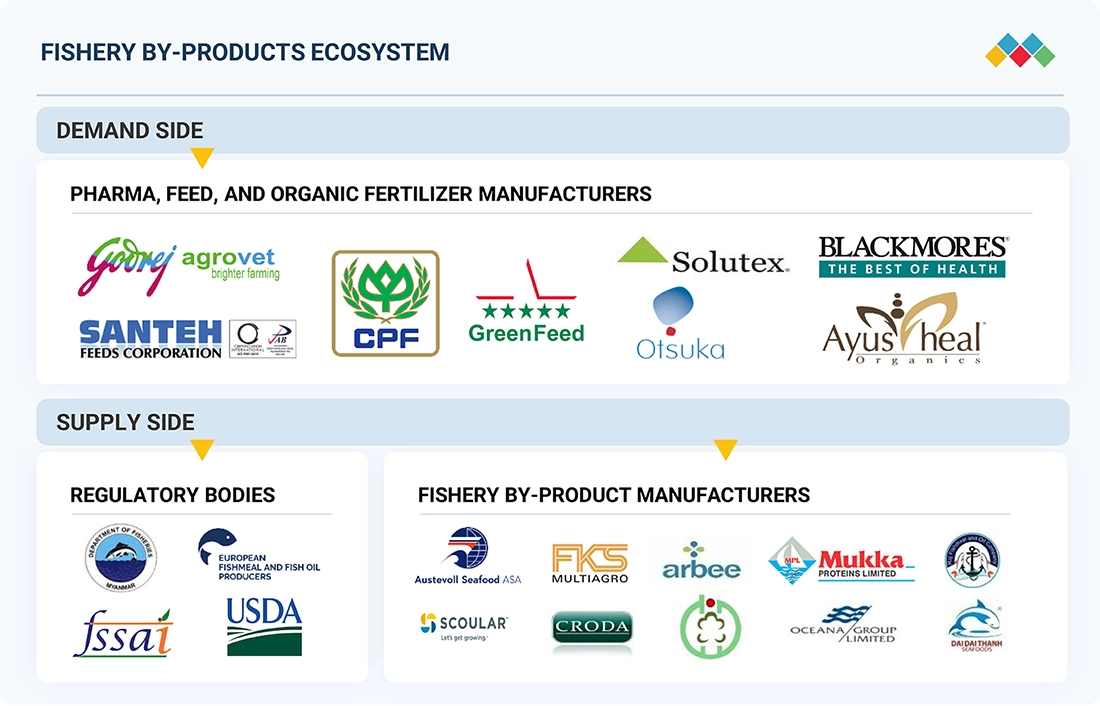
Fishery By-products Market: COMMERCIAL USE CASES ACROSS INDUSTRIES
| COMPANY | USE CASE DESCRIPTION | BENEFITS |
|---|---|---|
 |
Development of sustainable fishmeal and fish oil alternatives for aquaculture feed using advanced processing of by-products | Supports global aquaculture growth, reduces reliance on wild catch, enhances feed efficiency, and positions Scoular in circular economy solutions |
 |
Production of marine collagen peptides and functional ingredients from fish scales and skins for nutraceuticals and cosmetics | Creates premium revenue streams in health and beauty, leverages Japan’s regulatory credibility, and strengthens sustainable innovation branding |
 |
Extraction of tuna oil rich in omega-3s and bioactive compounds for infant formula, dietary supplements, and functional foods | Delivers clinically validated health benefits, taps into high-growth Omega-3 market, ensures traceability, and diversifies revenue beyond canned tuna |
 |
Development of pharmaceutical-grade EPA products and specialty marine-derived bioactives from by-products | Positions Nissui in premium pharma and nutraceutical markets, builds IP-protected product pipeline, and enhances competitiveness with clinically backed ingredients |
Logos and trademarks shown above are the property of their respective owners. Their use here is for informational and illustrative purposes only.
Related Ecosystem
Key Takeaways
- Peru's fishery by-products market reaches USD 637.7 million in 2025 with projected growth to USD 829.5 million by 2030.
- Peru's 5.4% CAGR reflects steady expansion driven by sustainable fishing practices and circular economy adoption.
- Peru's abundant marine resources and processing infrastructure position the country as a leading regional supplier.
- Peru's market growth is fueled by rising global demand for fish meal, fish oil, and specialty protein ingredients.
Fishery By-products Market Report Scope
| Report Metric | Details |
|---|---|
| Base Year | 2025 |
| Fastest Growing Segment | PHARMACEUTICALS & NUTRACEUTICALS (End-Use Industry) |
| Forecast Period | 2025-2030 |
| Growth Rate | CAGR of 7.3% from 2025 to 2030 |
| Largest Segment | CAPTURE FISHERIES (Source) |
| Market Size Base Year (Billions) | ~USD 26.34 (2025) |
| Revenue Forecast (Billions) | ~USD 37.46 (2030) |
| Segments Covered | Type, Subtype, Source, End-Use Industry, Industrial Application |
Peru Fishery By-products Market Report Segmentation
5 segment dimensions are covered across the global market.
By Type
- Bioactives & Specialty Compounds
- Fish Oil
- Minerals
- Other Types
- Protein & Derivatives
- Protein & Protein Derivatives
- Type-I
- Type-Iii
By Subtype
- Aquaculture Feed
- Bone Powder
- Carotenoids
- Cartilage
- Chitin
- Chitosan
- Collagen
- Collagen Peptide
- Enzymes
- Fish Hydrolysate
- Fish Meal
- Fish Silage
- Flavor Enhancers
- Flavour Enhancers
- Fortified Food & Beverages
- Gelatin
- Inland
- Livestock Feed
- Marine
- Nutritional Supplements
- Pet Food Additives
- Squalene
By Source
- Aquaculture
- Capture Fisheries
By End-Use Industry
- Agriculture
- Animal Feed
- Cosmetics & Personal Care
- Food & Beverage
- Industrial Applications
- Pharmaceuticals & Nutraceuticals
By Industrial Application
- Aquaculture
- Fertilizers
- Pharma
PERU: FISHERY BY-PRODUCTS MARKET, BY END-USE INDUSTRY, 2025–2030
| Segment | 2025 | 2026 | 2027 | 2028 | 2029 | 2030 | CAGR (%) |
|---|---|---|---|---|---|---|---|
| AGRICULTURE | 48 | 49.2 | 50.6 | 52 | 53.6 | 55.4 | 2.9 |
| ANIMAL FEED | 407.2 | 431 | 457 | 485.3 | 516.3 | 550.2 | 6.2 |
| COSMETICS & PERSONAL CARE | 18.1 | 18.7 | 19.2 | 19.9 | 20.6 | 21.3 | 3.3 |
| FOOD & BEVERAGE | 55.5 | 57.6 | 59.8 | 62.3 | 65 | 67.9 | 4.1 |
| INDUSTRIAL APPLICATIONS | 5.4 | 5.6 | 5.8 | 6 | 6.2 | 6.5 | 3.7 |
| PHARMACEUTICALS & NUTRACEUTICALS | 103.3 | 107.5 | 112 | 116.9 | 122.3 | 128.2 | 4.4 |
| TOTAL | 637.67 | 669.55 | 704.37 | 742.41 | 783.98 | 829.45 | 5.4 |
Target Audience
- Animal Feed Manufacturers : Require Peru-specific fish meal sourcing data, supply reliability metrics, and pricing trends to secure sustainable protein ingredients for livestock and aquaculture feed formulations.
- Nutraceutical & Supplement Companies : Need detailed insights into Peru's fish oil production capacity, omega-3 content specifications, and export availability to develop omega-3 supplement product lines and meet growing consumer demand.
- Cosmetics & Personal Care Brands : Seek Peru-specific collagen and fish-derived ingredient sourcing information, quality standards, and supplier networks to incorporate sustainable marine collagen into skincare and beauty products.
- Pharmaceutical Manufacturers : Require market data on Peru's fish oil and collagen by-products for pharmaceutical applications, including regulatory compliance, purity standards, and long-term supply agreements.
- Import/Export Traders & Distributors : Need Peru market size data, growth forecasts, and competitive landscape analysis to identify profitable trading opportunities and establish distribution networks for fishery by-products in regional and global markets.
Reasons to Buy this Report
- Market Size & Growth Data : Access precise valuation figures for Peru's fishery by-products market (USD 637.7M in 2025) with detailed forecasts through 2030, enabling accurate business planning and investment decisions specific to this high-growth sector.
- Competitive Intelligence : Understand Peru's position as a global fishing leader and identify competitive advantages in fish meal, fish oil, and collagen production. Benchmark against regional performance and global CAGR of 7.3%.
- Product Segment Insights : Gain detailed analysis of Peru's key by-product categories including fish meal for animal feed, omega-3 fish oil for nutraceuticals, and collagen-based ingredients for cosmetics and pharmaceuticals.
- Export & Supply Chain Opportunities : Identify export potential and supply chain dynamics specific to Peru's fishery by-products sector, including sourcing strategies, logistics, and market entry pathways for international buyers and distributors.
- Strategic Investment Guidance : Make informed investment decisions with Peru-specific market data, growth projections, and regulatory landscape analysis to capitalize on the 5.4% CAGR expansion through 2030.
Frequently asked questions
What is the current size of Peru's fishery by-products market?
Peru's fishery by-products market is valued at USD 637.7 million in 2025.
What is the projected market size for Peru's fishery by-products by 2030?
Peru's fishery by-products market is forecast to reach USD 829.5 million by 2030.
What is the growth rate of Peru's fishery by-products market?
Peru's fishery by-products market is expected to grow at a CAGR of 5.4% from 2025 to 2030.
What are the main by-products driving Peru's market?
Peru's market is primarily driven by fish meal, fish oil, collagen-based ingredients, and specialized proteins for animal feed and nutraceutical applications.
Why is Peru a significant player in the global fishery by-products market?
Peru's position as a leading global fishing nation, combined with established processing infrastructure and abundant marine resources, makes it a key supplier of high-quality fishery by-products.
RESEARCH METHODOLOGY
The study involved two major approaches in estimating the current size of the fishery by-products market. Exhaustive secondary research was done to collect information on the market, peer, and parent markets. The next step was to validate these findings, assumptions, and sizing with industry experts across the value chain through primary research. Both top-down and bottom-up approaches were employed to estimate the complete market size. After that, market breakdown and data triangulation were used to estimate the market size of segments and subsegments.
Secondary Research
This research study involved the extensive use of secondary sources—directories and databases such as Bloomberg Businessweek and Factiva—to identify and collect information useful for a technical, market-oriented, and commercial study of the market.
In the secondary research process, various sources such as annual reports, press releases & investor presentations of companies, white papers, food journals, certified publications, articles from recognized authors, directories, and databases were referred to to identify and collect information.
Secondary research was mainly used to obtain key information about the industry’s supply chain, the total pool of key players, and market classification and segmentation as per the industry trends to the bottom-most level, regional markets, and key developments from both market- and technology-oriented perspectives.
Primary Research
Extensive primary research was conducted after obtaining information regarding the fishery by-products market scenario through secondary research. Several primary interviews were conducted with market experts from both the demand and supply sides across major countries of North America, Europe, Asia Pacific, South America, and the Rest of the World. Primary data was collected through questionnaires, emails, and telephonic interviews. The primary sources from the supply side included various industry experts, such as Chief X Officers (CXOs), Vice Presidents (VPs), Directors from business development, marketing, research, and development teams, and related key executives from distributors and key opinion leaders. Primary interviews were conducted to gather insights such as market statistics, data on revenue collected from the products and services, market breakdowns, market size estimations, market forecasting, and data triangulation. Primary research also helped in understanding the various trends related to fishery by-products type, end-user industry, and region. Stakeholders from the demand side, such as livestock rearing flocks, dairy farms, and the poultry industry, were interviewed to understand the buyer’s perspective on the suppliers, products, and their current usage of fishery by-products and the outlook of their business, which will affect the overall market.
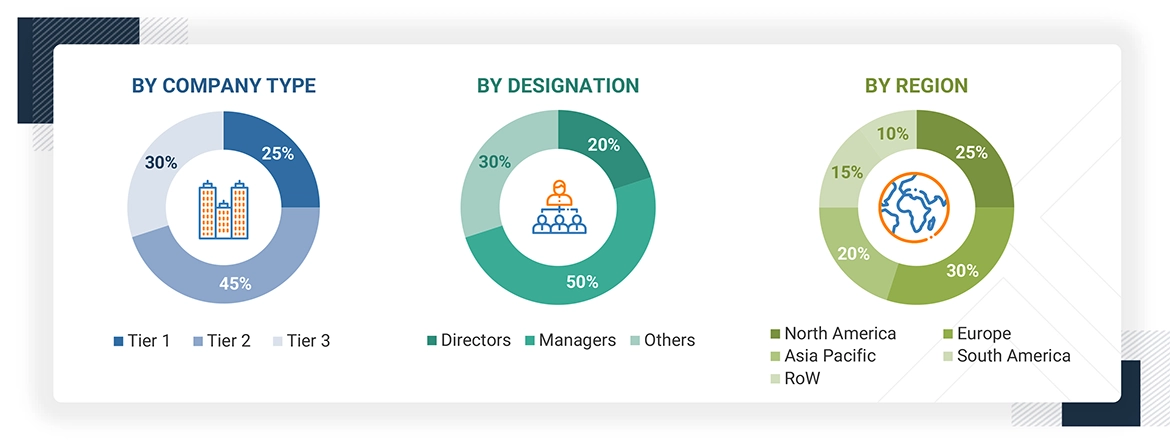
Note: The three tiers of the companies are defined based on their total revenues in 2023 or 2024,
as per the availability of financial data: Tier 1: Revenue >USD 1 billion; Tier 2: USD 100 million = Revenue = USD 1 billion;
Tier 3: Revenue
To know about the assumptions considered for the study, download the pdf brochure
|
COMPANY |
DESIGNATION |
|
Thai Union Ingredients (Thailand) |
General Manager |
|
Sopropêche (France) |
Sales Manager |
|
Pesquera Diamante Peru (Peru) |
Manager |
|
Oceana Group Limited (South Africa) |
Head of processing department |
|
Austevoll Seafood A (Norway) |
Marketing Manager |
|
Maruha Nichiro Corporation (Japan) |
Sales Executive |
Market Size Estimation
Both the top-down and bottom-up approaches were used to estimate and validate the total size of the fishery by-products market. These approaches were also used extensively to determine the size of various subsegments in the market. The research methodology used to estimate the market size includes the following details:
- The key players in the industry and the overall markets were identified through extensive secondary research.
- All shares, splits, and breakdowns were determined using secondary sources and verified through primary sources.
- All possible parameters that affect the market covered in this research study were accounted for, viewed in extensive detail, verified through primary research, and analyzed to obtain final quantitative and qualitative data.
- The research included the study of reports, reviews, and newsletters of top market players, along with extensive interviews for opinions from leaders, such as CEOs, directors, and marketing executives.
Fishery By-products Market : Top-Down and Bottom-Up Approach
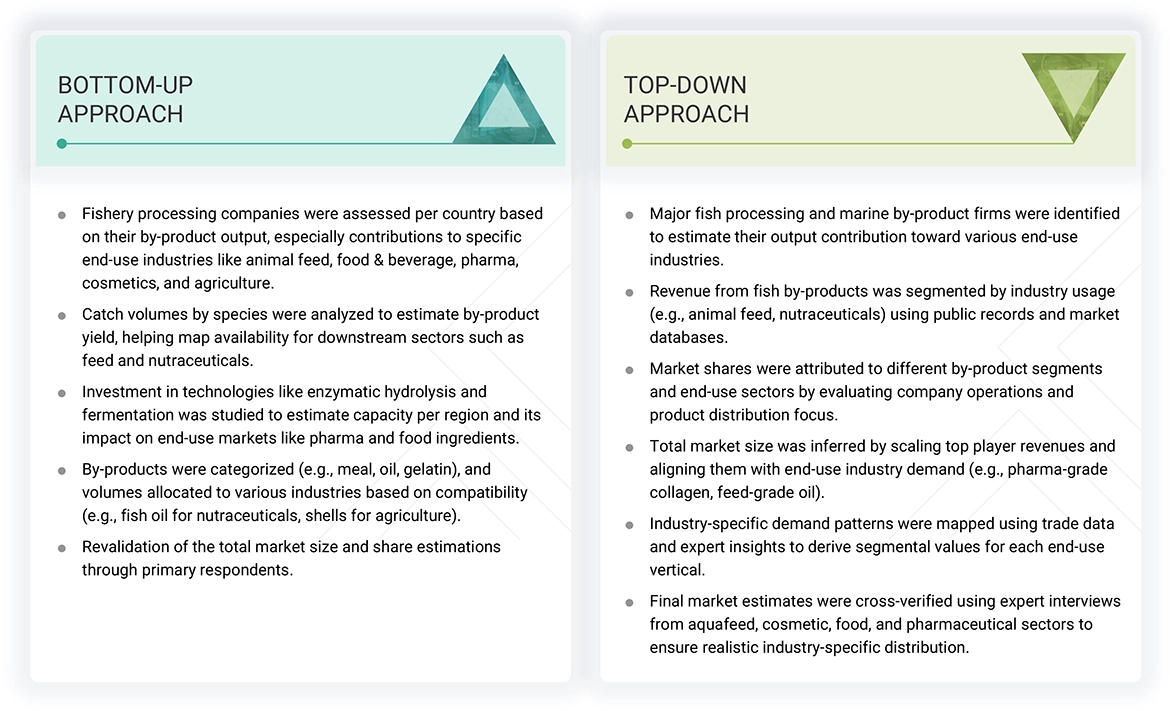
Data Triangulation
After arriving at the overall market size from the estimation process explained above, the total market was split into several segments and subsegments. The data triangulation and market breakdown procedures were employed, wherever applicable, to estimate the overall fishery by-products market and arrive at the exact statistics for all segments and subsegments. The data was triangulated by studying various factors and trends from the demand and supply sides. The market size was also validated using both the top-down and bottom-up approaches.
Market Definition
According to FAO, fishery by-products refer to the non-edible or secondary components of fish and aquatic animals generated during processing or harvesting. These include heads, bones, skins, viscera, blood, scales, shells, and frames, which are commonly repurposed for animal feed, fertilizers, pharmaceuticals, collagen, gelatin, and bioactive compounds.
Stakeholders
- Fishmeal & fish oil manufacturers
- Fishmeal & fish oil traders, distributors, and suppliers
- Fish farmers
- Government and research organizations
- Associations and industry bodies
- Agricultural universities
- Intermediate suppliers such as retailers, wholesalers, and distributors
- Raw material suppliers
- Technology providers
- Industry associations
-
Regulatory bodies and institutions:
- Food and Agriculture Organization (FAO)
- United States Department of Agriculture (USDA)
- Compound Livestock Feed Manufacturers Association of India (CLFMA)
- International Feed Industry Federation (IFIF)
- American Feed Industry Association (AFIA)
- Animal Feed Manufacturers Association (AFMA)
- Organization for Economic Cooperation and Development (OECD)
- Marine Ingredients Organisation (IFFO)
- European Market Observatory for Fisheries and Aquaculture Products
- Logistics providers & transporters
-
Research institutes and organizations
- Consulting companies/consultants in the agricultural technology sector
Report Objectives
- To determine and project the size of the fishery by-products market based on type, end-user industry, and region in terms of value over five years, ranging from 2025 to 2030
- To identify the attractive opportunities in the market by determining the largest and fastest-growing segments across regions
- To provide detailed information about the key factors influencing market growth (drivers, restraints, opportunities, and challenges)
- To analyze the opportunities in the market for stakeholders and provide details of the competitive landscape for market leaders
- To analyze the micro-markets with respect to individual growth trends, prospects, and their contribution to the total market
- To identify and profile the key players in the fishery by-products market
- To understand the competitive landscape and identify the major growth strategies adopted by players across the key regions
Available Customizations
With the given market data, MarketsandMarkets offers customizations according to company-specific scientific needs. The following customization options are available for the report:
Product Analysis
- Product Matrix, which gives a detailed comparison of the product portfolio of each company.
Geographic Analysis as per Feasibility
With the given market data, MarketsandMarkets offers customizations according to company-specific scientific needs.
- Further breakdown of the Rest of Europe fishery by-products market into key countries.
- Further breakdown of the Rest of Asia Pacific fishery by-products market into key countries.
- Further breakdown of the Rest of South America fishery by-products market into key countries.
Company Information
- Detailed analyses and profiling of additional market players (up to five)
Get the Full Fishery By-products Market Report
Full forecast, segment splits, and company analysis for all Fishery By-products Market.
- Canada Fishery By-products Market
- Mexico Fishery By-products Market
- US Fishery By-products Market
- Germany Fishery By-products Market
- UK Fishery By-products Market
- France Fishery By-products Market
- Italy Fishery By-products Market
- Spain Fishery By-products Market
- Norway Fishery By-products Market
- Denmark Fishery By-products Market
- China Fishery By-products Market
- India Fishery By-products Market
- Japan Fishery By-products Market
- Vietnam Fishery By-products Market
- Thailand Fishery By-products Market
- South Korea Fishery By-products Market
- Brazil Fishery By-products Market
- Chile Fishery By-products Market
- Rest Of Europe Fishery By-products Market
- Rest Of Asia Pacific Fishery By-products Market
- Africa Fishery By-products Market
- Middle East Fishery By-products Market
- Rest Of South America Fishery By-products Market
Need a Tailored Report?
Customize this report to your needs
Get 10% FREE Customization
Customize This Report
