
UK Industrial Utility Communication Market (2023-2028)

The UK Industrial Utility Communication Market was valued at $82.5 Million in 2023 and projected to reach to $110.3 Million by 2028, representing a compound annual growth rate of 6.0%. The UK Industrial Utility Communication Market is positioned for sustained growth as chemical and materials manufacturers prioritize digital infrastructure investments.


| Market Size in | USD 26.32 MN |
| Market Forecast in | |
| CAGR | |
| Forecast Period | |
| Units Considered | Value (USD MN) |
UK Industrial Utility Communication Market Trends and Insights
- The UK market is driven by increasing digitalization of utility infrastructure and the chemical and materials sector's demand for real-time operational visibility.
- In 2023, the UK established itself as a key European hub for industrial communication solutions, with manufacturers investing heavily in smart grid technologies and IoT-enabled monitoring systems. By 2028, the UK market is expected to benefit from regulatory pressures around carbon reporting and energy efficiency mandates specific to British industry.
- The UK's commitment to net-zero targets is accelerating adoption of advanced communication platforms that enable utilities and chemical processors to optimize resource consumption.
- Growth is further supported by aging infrastructure modernization initiatives and the integration of renewable energy sources into the UK's industrial utility networks..
Key Market Statistics
- CAGR (2023-2028) 6.0% CAGR
- Market Size, 2023 ~USD 82.5 Million
- Forecast, 2028 ~USD 110.3 Million
- Country UK
UK Industrial Utility Communication Market Overview
Market Valuation :
The UK Industrial Utility Communication Market reached £82.5 million in 2023, with projections to grow to £110.3 million by 2028, driven by infrastructure modernization and regulatory compliance requirements.
Consistent Growth Trajectory :
The UK market maintains a steady 6% CAGR through 2028, aligning with global growth rates and reflecting sustained investment in digital transformation across UK chemical and materials facilities.
Digitalization of Utility Infrastructure :
UK utilities and chemical manufacturers are accelerating adoption of advanced communication systems to enable real-time operational visibility, predictive maintenance, and enhanced safety protocols across production networks.
Chemical & Materials Sector Leadership :
The UK chemical and materials industry is driving demand for integrated utility communication solutions, with major facilities requiring sophisticated monitoring systems to optimize resource management and meet environmental standards.
UK Industrial Utility Communication Market Dynamics
- Regulatory pressures around emissions monitoring, energy efficiency, and operational safety are compelling UK facilities to upgrade legacy communication systems with modern, integrated solutions that provide real-time data analytics and remote management capabilities. By 2028, the market will be shaped by increasing adoption of IoT-enabled devices, cloud-based monitoring platforms, and AI-driven predictive analytics.
- UK enterprises are expected to invest heavily in cybersecurity measures and interoperable communication standards to protect critical utility infrastructure while maintaining competitive advantage in the global chemicals sector..
Market Ecosystem
Related Ecosystem
Equipment Machine And Tooling
- Wastewater Treatment
- Air Cooled Heat Exchangers
- Diaphragm Pumps
- Fiberglass
- HVAC System
- Alfa Laval Corporate AB
- Johnson Controls International plc
- Veolia
- Daikin Industries,Ltd.
- Carrier Global Corporation
Smart Grid
- Meter Data Management (MDM)
- Sensors
- Workforce Management
- Cellular Network
- Customer Analytics
- SCHNEIDER ELECTRIC SE
- Siemens ag
- ABB India Limited
- Eaton Corporation plc
- General Electric Company
Key Takeaways
- The UK Industrial Utility Communication Market reached £82.5 million in 2023 and will expand to £110.3 million by 2028 at a 6.0% CAGR.
- UK regulatory frameworks and net-zero commitments are primary drivers of industrial communication technology adoption across utilities and chemicals sectors.
- The UK market benefits from substantial infrastructure modernization investments and the transition to renewable energy integration.
- Real-time operational visibility and IoT-enabled monitoring systems are becoming essential competitive requirements for UK industrial operators.
Industrial Utility Communication Market Report Scope
| Report Metric | Details |
|---|---|
| Base Year | 2023 |
| Fastest Growing Segment | - OPTICAL-IP/MPLS (Component) |
| Forecast Period | 2023-2028 |
| Growth Rate | CAGR of 6% from 2023 to 2028 |
| Largest Segment | WIRED (Technology) |
| Market Size Base Year (Billions) | ~USD 3.14 (2023) |
| Revenue Forecast (Billions) | ~USD 4.2 (2028) |
| Segments Covered | Component, Technology, End-Use Industry |
UK Industrial Utility Communication Market Report Segmentation
3 segment dimensions are covered across the global market.
By Component
- Hardware
- Services
- Software
- - Consulting
- - Ethernet Switches
- - High Voltage Power Line Carriers
- - Installation
- - Low/Medium Voltage Power Line Carriers
- - Maintenance
- - Optical -Sonet/Sdh Mux
- - Optical-Ip/Mpls
- - Optical-Mpls-Tp
- - Tele-Protection Signaling
- - Time Sync Devices
- - Wireless Licensed Narrowband
- - Wireless-Private Cellular
- - Wireless-Public Cellular
- - Wireless-Unlicensed
By Technology
- Wired
- Wireless
By End-Use Industry
- Ac Transmission
- EV Charging
- Hvdc Transmission
- Mining
- Oil & Gas
- Other End-Use Industries
- Power Distribution
- Power Generation
- Renewable Power Generation
- Transportation (Rail)
- Transportation(Rail)
- Water/Wastewater
UK: INDUSTRIAL UTILITY COMMUNICATION MARKET, BY END-USE INDUSTRY, 2023–2028
| Segment | 2023 | 2024 | 2025 | 2026 | 2027 | 2028 | CAGR (%) |
|---|---|---|---|---|---|---|---|
| AC TRANSMISSION | 8 | 8.5 | 9 | 9.5 | 10.1 | 10.7 | 5.9 |
| EV CHARGING | 8 | 8.4 | 9 | 9.5 | 10.1 | 10.8 | 6.2 |
| HVDC TRANSMISSION | 6.8 | 7.2 | 7.7 | 8.1 | 8.6 | 9.2 | 6 |
| MINING | 7.8 | 8.3 | 8.8 | 9.4 | 10 | 10.6 | 6.3 |
| OIL & GAS | 10.3 | 10.9 | 11.6 | 12.3 | 13.1 | 13.9 | 6.2 |
| OTHER END-USE INDUSTRIES | 2.1 | 2.1 | 2.1 | 2.1 | 2.1 | 2.2 | 0.5 |
| POWER DISTRIBUTION | 7.4 | 7.8 | 8.3 | 8.8 | 9.3 | 9.9 | 6.1 |
| POWER GENERATION | 9.3 | 9.9 | 10.5 | 11.1 | 11.8 | 12.6 | 6.2 |
| RENEWABLE POWER GENERATION | 7.2 | 7.6 | 8 | 8.5 | 9 | 9.5 | 5.7 |
| TRANSPORTATION (RAIL) | 8 | 8.4 | 8.9 | 9.5 | 10.1 | 10.7 | 6.1 |
| WATER/WASTEWATER | 7.5 | 8 | 8.5 | 9 | 9.6 | 10.3 | 6.4 |
| TOTAL | 82.5 | 87.2 | 92.4 | 97.9 | 103.9 | 110.3 | 6 |
Target Audience
- UK Chemical Manufacturers : Chemical producers need detailed market intelligence to evaluate utility communication technology investments, benchmark against industry peers, and plan digital transformation roadmaps aligned with UK regulatory requirements.
- Materials & Processing Companies : UK-based materials processors require market data to assess communication system upgrades, understand competitive technology adoption rates, and justify capital expenditures to stakeholders.
- Industrial Technology Vendors : Solution providers targeting the UK market need precise market sizing, growth forecasts, and sector-specific demand drivers to develop go-to-market strategies and sales projections.
- Utility & Infrastructure Operators : UK utility companies serving industrial clients need market insights to understand customer demand for advanced communication solutions and identify revenue growth opportunities in the chemicals sector.
- Investment & Strategy Consultants : Consultants advising UK industrial clients require authoritative market data, CAGR analysis, and trend forecasts to support strategic planning, M&A evaluation, and technology investment recommendations.
Reasons to Buy this Report
- UK-Specific Market Sizing : Access precise valuation data for the UK market (£82.5M in 2023) with detailed forecasts through 2028, enabling accurate budget allocation and investment planning for UK-based operations.
- Competitive Landscape Intelligence : Understand UK market dynamics, key players, and competitive positioning specific to the chemicals and materials sector, helping identify partnership and acquisition opportunities in the region.
- Regulatory & Compliance Insights : Gain clarity on UK-specific regulatory drivers, environmental standards, and compliance requirements shaping utility communication investments in the chemical and materials industries.
- Growth Opportunity Identification : Identify high-potential segments and subsectors within the UK market where utility communication solutions are experiencing accelerated adoption and premium pricing opportunities.
- Strategic Decision Support : Leverage UK market trends, CAGR projections, and sector-specific insights to inform go-to-market strategies, product development priorities, and resource allocation decisions.
Frequently asked questions
What is the current size of the UK Industrial Utility Communication Market?
The UK Industrial Utility Communication Market was valued at £82.5 million in 2023 and is expected to reach £110.3 million by 2028.
What is the projected growth rate for the UK market through 2028?
The UK market is projected to grow at a compound annual growth rate (CAGR) of 6.0% from 2023 to 2028.
What are the main drivers of growth in the UK Industrial Utility Communication Market?
Key drivers include UK net-zero regulatory mandates, infrastructure modernization, renewable energy integration, and the chemical and materials sector's demand for real-time operational monitoring.
How does the UK market compare to other European markets?
The UK is a key European hub for industrial communication solutions, with significant investments in smart grid technologies and IoT-enabled monitoring systems that support its 6.0% CAGR growth trajectory.
Which industries are driving demand in the UK market?
The chemicals and materials sector, along with utilities and energy companies, are primary drivers of demand for industrial utility communication solutions in the UK.
RESEARCH METHODOLOGY
The study involved four major activities in estimating the market size of the industrial utility communication market. Exhaustive secondary research was done to collect information on the market, the peer market, and the parent market. The next step was to validate these findings, assumptions, and sizing with industry experts across the value chain through primary research. Both top-down and bottom-up approaches were employed to estimate the complete market size. Thereafter, the market breakdown and data triangulation procedures were used to estimate the market size of the segments and subsegments.
Secondary Research
In the secondary research process, various secondary sources have been referred to for identifying and collecting information for this study. These secondary sources include annual reports, press releases, investor presentations of companies, white papers, certified publications, trade directories, articles from recognized authors, the gold standard and silver standard websites, and databases.
Secondary research has been used to obtain key information about the value chain of the industry, the monetary chain of the market, the total pool of key players, market classification, and segmentation according to industry trends to the bottom-most level and regional markets. It was also used to obtain information about the key developments from a market-oriented perspective.
Primary Research
The industrial utility communication market comprises several stakeholders in the value chain, which include input suppliers, equipment manufacturers, technology providers, service providers, distribution and logistics, and end users. Various primary sources from the supply and demand sides of the industrial utility communication market have been interviewed to obtain qualitative and quantitative information. The primary interviewees from the demand side include key opinion leaders in end-use sectors. The primary sources from the supply side include manufacturers, associations, and institutions involved in the industrial utility communication industry.
Primary interviews were conducted to gather insights such as market statistics, data on revenue collected from the products and services, market breakdowns, market size estimations, market forecasting, and data triangulation. Primary research also helped in understanding the various trends related to technology, type, application, and region. Stakeholders from the demand side, such as CIOs, CTOs, and CSOs, were interviewed to understand the buyer’s perspective on the suppliers, products, component providers, and their current usage of industrial utility communication the outlook of their business, which will affect the overall market.
The breakdown of profiles of the primary interviewees is illustrated in the figure below:
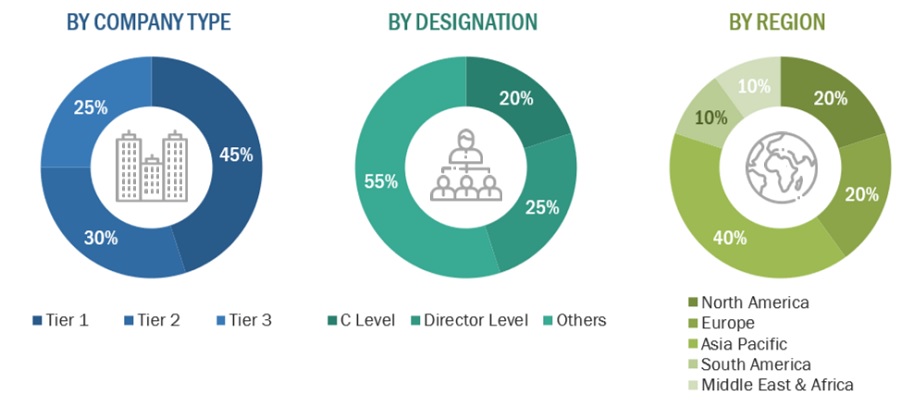
Note: Tier 1, Tier 2, and Tier 3 companies are classified based on their market revenue in 2022, available in the public domain, product portfolios, and geographical presence.
Other designations include consultants and sales, marketing, and procurement managers.
To know about the assumptions considered for the study, download the pdf brochure
|
Company name |
Designation |
|
Schneider Electric |
Head of Partnerships for Digital Grid |
|
Siemens |
Head of Industrial Engineering and Planning |
|
General Electric |
R&D Manager |
|
Nokia |
Marketing Manager |
|
Hitachi Energy Ltd. |
Product & Sales Manager |
Market Size Estimation
The top-down and bottom-up approaches have been used to estimate and validate the size of the industrial utility communication market.
- The key players in the industry have been identified through extensive secondary research.
- The industry's supply chain has been determined through primary and secondary research.
- All percentage shares, splits, and breakdowns have been determined using secondary sources and verified through primary sources.
- All possible parameters that affect the markets covered in this research study have been accounted for, viewed in extensive detail, verified through primary research, and analyzed to obtain the final quantitative and qualitative data.
- The research includes the study of reports, reviews, and newsletters of the key market players, along with extensive interviews for opinions with leaders such as directors and marketing executives.
Industrial Utility Communication Market: Bottum-Up Approach
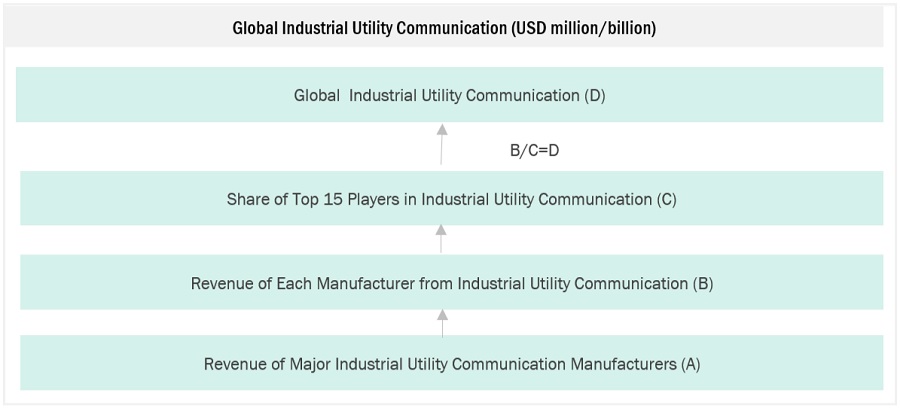
Note: All the shares are based on the global market size.
Source: Secondary Research, Interviews with Experts, and MarketsandMarkets Analysis
To know about the assumptions considered for the study, Request for Free Sample Report
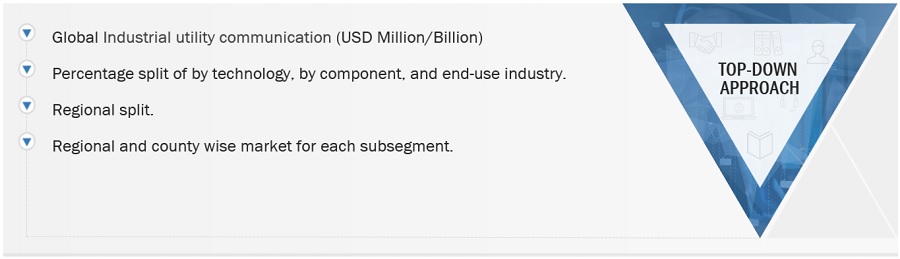
Industrial Utility Communication Market: Top-Down Approach
Data Triangulation
After arriving at the total market size from the estimation process explained above, the overall market has been split into several segments and sub-segments. To complete the overall market engineering process and arrive at the exact statistics for all the segments and sub-segments, the data triangulation and market breakdown procedures have been employed, wherever applicable. The data has been triangulated by studying various factors and trends from both the demand and supply sides. Along with this, the market size has been validated by using both the top-down and bottom-up approaches and primary interviews. Hence, for every data segment, there have been three sources—top-down approach, bottom-up approach, and expert interviews. The data was assumed correct when the values arrived from the three sources matched.
Market Definition
The global industrial utility communication market is a thriving industry fueled by the escalating demand for communication products across various end use industries. This market focuses on establishing robust, reliable, and efficient communication infrastructures that facilitate seamless data transmission, control, and monitoring within industrial environments. The market features a multitude of regional and global players, each offering a diverse range of industrial utility communication products. Geographically, the Asia-Pacific region dominates the global industrial utility communication market, followed by North America and Europe. Asia-Pacific is the largest regional market, fueled by the rapid industrialization and urbanization in the region. China and India are the major contributors to the growth of the industrial utility communication market in Asia-Pacific. Europe holds the second-largest market share, with a strong presence of global and regional players. North America is a mature market but is witnessing steady growth due to government investments and rising demand for advanced communication technologies.
Key Stakeholders
- Raw material suppliers.
- Industrial utility communication manufacturers, software suppliers.
- Service Providers & Grid Operators.
- End-use industry participants.
- Government and research organizations.
- Associations and industrial bodies.
- Research & development (R&D) institutions.
- Environmental support agencies.
Report Objectives
- To define, describe, and forecast the size of the Industrial utility communication market, in terms of value.
- To provide detailed information regarding the major factors (drivers, opportunities, restraints, and challenges) influencing the growth of the market
- To estimate and forecast the market size based on by technology, by component, end-use industry and region.
- To forecast the size of the market with respect to major regions, namely, Europe, North America, Asia Pacific, Middle East & Africa, and South America, along with their key countries.
- To strategically analyze micromarkets1 with respect to individual growth trends, prospects, and their contribution to the overall market.
- To analyze opportunities in the market for stakeholders and provide a competitive landscape of market leaders.
- To track and analyze recent developments such as expansions, new product launches, partnerships & agreements, and acquisitions in the market.
- To strategically profile key market players and comprehensively analyze their core competencies.
Available Customizations
Along with the given market data, MarketsandMarkets offers customizations according to the company’s specific needs. The following customization options are available for the report:
Regional Analysis
- Further breakdown of a region with respect to a particular country or additional application
Company Information
- Detailed analysis and profiles of additional market players
Get the Full Industrial Utility Communication Market Report
Full forecast, segment splits, and company analysis for all Industrial Utility Communication Market.
- China Industrial Utility Communication Market
- Japan Industrial Utility Communication Market
- India Industrial Utility Communication Market
- South Korea Industrial Utility Communication Market
- Malaysia Industrial Utility Communication Market
- Australia Industrial Utility Communication Market
- Germany Industrial Utility Communication Market
- Italy Industrial Utility Communication Market
- France Industrial Utility Communication Market
- Spain Industrial Utility Communication Market
- Canada Industrial Utility Communication Market
- Mexico Industrial Utility Communication Market
- US Industrial Utility Communication Market
- Brazil Industrial Utility Communication Market
- Argentina Industrial Utility Communication Market
- Saudi Arabia Industrial Utility Communication Market
- UAE Industrial Utility Communication Market
- South Africa Industrial Utility Communication Market
- Rest Of Europe Industrial Utility Communication Market
- Rest Of Asia Pacific Industrial Utility Communication Market
- Rest Of GCC Industrial Utility Communication Market
- Rest Of South America Industrial Utility Communication Market
Need a Tailored Report?
Customize this report to your needs
Get 10% FREE Customization
Customize This Report
