
Asia Pacific Medical Display Market (2025-2030)

The Asia Pacific Medical Display Market was valued at $564.7 Million in 2025 and projected to reach to $764 Million by 2030, representing a compound annual growth rate of 6.2%. The Asia Pacific medical display market is positioned for sustained growth through 2030, driven by increasing diagnostic imaging demand and healthcare modernization initiatives across the region.


| Market Size in | USD 26.32 MN |
| Market Forecast in | |
| CAGR | |
| Forecast Period | |
| Units Considered | Value (USD MN) |
Asia Pacific Medical Display Market Trends and Insights
- Asia Pacific's growth trajectory reflects increasing healthcare infrastructure investments, rising diagnostic imaging demand, and digital transformation across the region's medical facilities.
- The 6.2% compound annual growth rate in Asia Pacific outpaces global trends, driven by expanding hospital networks and adoption of advanced visualization technologies in countries including China, India, Japan, and South Korea. Asia Pacific's medical display sector benefits from growing patient populations, aging demographics, and regulatory emphasis on diagnostic accuracy.
- Between 2025 and 2030, Asia Pacific is expected to capture significant market share through modernization of radiology departments, surgical suites, and clinical workstations.
- The region's competitive landscape features both established manufacturers and emerging local players, intensifying innovation in display resolution, color accuracy, and connectivity standards tailored to Asia Pacific healthcare environments..
Key Market Statistics
- CAGR (2025-2030) 6.2% CAGR
- Market Size, 2025 ~USD 564.7 Million
- Forecast, 2030 ~USD 764 Million
- Geography Asia Pacific
Asia Pacific Medical Display Market Overview
Market Valuation & Growth :
Asia Pacific medical display market valued at $564.7 million in 2025, expanding at 6.2% CAGR through 2030, outpacing the global growth rate of 5.5%.
Healthcare Infrastructure Investment :
Rapid expansion driven by substantial investments in healthcare infrastructure across emerging economies, modernizing diagnostic imaging capabilities and clinical workflows.
Digital Transformation Momentum :
Accelerating digital transformation in medical facilities across Asia Pacific is driving adoption of advanced display technologies for enhanced diagnostic accuracy and patient outcomes.
Regional Market Leaders :
Japan leads the region with $167.9 million market share, followed by China at $102.5 million, reflecting strong healthcare technology adoption and investment capacity.
Asia Pacific Medical Display Market Dynamics
- Rising healthcare expenditure, coupled with government initiatives to expand medical infrastructure in emerging markets, creates significant opportunities for display technology providers.
- The region's growing aging population and prevalence of chronic diseases further accelerate demand for advanced diagnostic and surgical display solutions. Key growth catalysts include digital health adoption, telemedicine expansion, and integration of AI-powered diagnostic tools requiring high-performance display systems.
- Japan and China remain innovation hubs, while India and Southeast Asian markets present emerging opportunities.
- Strategic partnerships with healthcare providers and localized product offerings will be critical for capturing market share in this dynamic and rapidly evolving region..
Market Ecosystem
Related Ecosystem
Key Takeaways
- Asia Pacific medical display market grows from $564.7M (2025) to $764.0M (2030) at 6.2% CAGR, outpacing global growth rates.
- Healthcare infrastructure expansion and diagnostic imaging adoption are primary growth catalysts across Asia Pacific nations.
- Asia Pacific demand is concentrated in radiology, surgical visualization, and clinical workstation applications requiring high-resolution displays.
- Emerging Asia Pacific markets and regulatory compliance requirements drive innovation in display technology and regional manufacturing capacity.
Medical Display Market Report Scope
| Report Metric | Details |
|---|---|
| Base Year | 2025 |
| Fastest Growing Segment | OLED (Technology) |
| Forecast Period | 2025–2030 |
| Growth Rate | CAGR of 5.5% from 2025 to 2030 |
| Largest Segment | COLOR (Color) |
| Market Size Base Year (Billions) | ~USD 2.64 (2025) |
| Revenue Forecast (Billions) | ~USD 3.45 (2030) |
| Segments Covered | Technology, Panel Size, Resolution, Type, Color, Application |
Asia Pacific Medical Display Market Report Segmentation
6 segment dimensions are covered across the global market.
By Technology
- Ccfl-Backlit Lcd
- Led-Backlit Lcd
- Oled
By Panel Size
- 23.0–26.9 Inches
- 27.0–41.9 Inches
- Above 42 Inches
- Under 22.9 Inches
By Resolution
- 2.1–4Mp
- 4.1–8Mp
- Above 8Mp
- Up To 2Mp
By Type
- 4K
- 8K
- Digital Pathology
- General Radiology
- Mammography
- Multimodality
By Color
- Color
- Monochrome & Grayscale
By Application
- Dentistry
- Diagnostic
- Other Applications
- Surgical/Interventional
Target Audience
- Medical Device Manufacturers : Manufacturers of diagnostic imaging and surgical display systems need Asia Pacific market intelligence to identify growth opportunities, optimize product portfolios, and plan regional expansion strategies.
- Healthcare Facility Operators : Hospital administrators and healthcare facility managers require market insights to make informed procurement decisions, evaluate display technology investments, and benchmark regional spending patterns.
- Technology Investors & PE Firms : Investment professionals evaluating healthcare technology opportunities in Asia Pacific need detailed market data, growth forecasts, and competitive analysis to assess portfolio companies and investment potential.
- Healthcare IT Consultants : Consultants advising healthcare organizations on digital transformation and infrastructure modernization require Asia Pacific-specific market data to guide technology recommendations and implementation strategies.
- Distribution & Channel Partners : Distributors and resellers of medical display equipment need regional market insights to identify demand drivers, optimize inventory, and develop targeted sales strategies across Asia Pacific markets.
Key Companies in the Asia Pacific Medical Display Market
| Company | HQ | Ownership | Strongest segments |
|---|---|---|---|
| GODREJ GROUP | India | Private Company | LED-Backlit LCD Display, Under 22.9 Inch Panels,4.1-8 MP Resolution Color Displays for Diagnostics,4.1-8 MP Resolution Monochrome Displays for Diagnostics, |
| TIANMA MICROELECTRONICS | China | Public Company | Diagnostics applications – color LED-backlit LCD (4.1–8 MP, <22.9"),Diagnostics applications – monochrome LED-backlit LCD (4.1–8 MP, <22.9"),Dentistry – integrated chair and intraoral system displays (color), |
| BARCO NV | Belgium | Public Company | Diagnostic radiology displays (4.1–8 MP, sub-22.9", color & monochrome),Breast imaging and multimodality diagnostic displays,Dentistry imaging displays, |
| EIZO INC. | Japan | Public Company | LED-backlit LCD diagnostic displays (4.1–8 MP, under 22.9 inch),Dental imaging displays (under 22.9 inch, color),Monochrome specialty diagnostic displays, |
| NOVANTA INC. | United States | Public Company | LED-Backlit LCD Displays for Diagnostics Applications (4.1–8 MP, color & monochrome, under 22.9"),LED-Backlit LCD Displays for Dentistry (4.1–8 MP, color, under 22.9"),Integrated OR and Medical System Subassemblies Including Displays, |
| LG ELECTRONICS | South Korea | Public Company | LED-backlit LCD, color, 4.1–8 MP, under 22.9-inch – diagnostics,LED-backlit LCD, color, under 22.9-inch – dentistry,LED-backlit LCD, monochrome, 4.1–8 MP – diagnostics, |
| ADVANTECH CO., LTD. | Taiwan | Public Company | Diagnostics applications – color LED-backlit LCD, 4.1–8 MP, under 22.9 inch,Diagnostics applications – monochrome LED-backlit LCD, 4.1–8 MP, under 22.9 inch,Dentistry – chairside color displays and panel PCs, |
| STERIS | Ireland | Public Company | Diagnostics applications – under 22.9-inch LED-backlit LCD color displays (4.1–8 MP),Diagnostics applications – under 22.9-inch LED-backlit LCD monochrome displays (4.1–8 MP),Dentistry – under 22.9-inch LED-backlit LCD color displays (4.1–8 MP), |
| SIEMENS HEALTHINEERS | Germany |
GODREJ GROUP
Godrej Group is a private Indian conglomerate founded in 1897 with 13,316 employees. The company operates across multiple business sectors serving domestic and international markets.
TIANMA MICROELECTRONICS
Tianma Microelectronics is a public Chinese company founded in 1983 with 23,538 employees. The company specializes in microelectronics manufacturing and related technologies.
BARCO NV
Barco NV is a public Belgian company founded in 1934 with 3,673 employees. The company designs and manufactures visualization and display technology solutions for professional markets.
EIZO INC.
Eizo Inc. is a public Japanese company founded in 1968 with 2,289 employees. The company manufactures high-quality display monitors and imaging solutions for professional and commercial applications.
NOVANTA INC.
Novanta Inc. is a public United States company founded in 1968 with 3,000 employees. The company provides precision motion control, imaging, and laser-based solutions for industrial and medical markets.
LG ELECTRONICS
LG Electronics is a public South Korean company founded in 1958 with 34,884 employees. The company manufactures consumer electronics, home appliances, displays, and related technology products.
ADVANTECH CO., LTD.
Advantech Co., Ltd. is a public Taiwanese company founded in 1981 with 2,526 employees. The company develops and manufactures industrial computing and automation solutions.
STERIS
Steris is a public company founded in 1985 with headquarters in Ireland. The company provides sterilization and contamination control solutions.
SIEMENS HEALTHINEERS
Siemens Healthineers is a company based in Germany. The company operates in the healthcare and medical technology sector.
Countries within Asia Pacific - compare and drill down
| Country | 2025 size (native) |
|---|---|
| China | USD 102.5 Million |
| Japan | USD 167.9 Million |
| India | USD 49.4 Million |
| South Korea | USD 38.9 Million |
| Australia | USD 32.9 Million |
| Rest Of Asia Pacific | USD 125.6 Million |
Country market size visualization
Reasons to Buy this Report
- Regional Market Segmentation : Gain detailed insights into Asia Pacific's medical display market dynamics, including country-level analysis of Japan, China, India, South Korea, and Australia with specific market valuations.
- Growth Opportunity Identification : Identify high-growth segments and emerging markets within Asia Pacific where healthcare infrastructure investments and digital transformation initiatives are creating demand for advanced display technologies.
- Competitive Landscape Analysis : Understand regional competitive dynamics, key players, and market positioning strategies specific to Asia Pacific's unique healthcare regulatory environment and technology adoption patterns.
- Strategic Market Entry Planning : Develop informed market entry and expansion strategies for Asia Pacific with data-driven insights on regional preferences, healthcare spending patterns, and technology adoption rates by country.
- Investment & Partnership Decisions : Support investment decisions and partnership evaluations with comprehensive market forecasts, growth projections through 2030, and analysis of regional healthcare infrastructure development trends.
Frequently asked questions
What is the current size of the Asia Pacific medical display market?
The Asia Pacific medical display market is valued at $564.7 million in 2025, with expectations to grow to $764.0 million by 2030.
What is the projected growth rate for Asia Pacific medical displays?
Asia Pacific medical displays are projected to grow at a compound annual growth rate (CAGR) of 6.2% from 2025 to 2030.
Which countries drive the Asia Pacific medical display market?
Key markets in Asia Pacific include China, India, Japan, South Korea, and Southeast Asian nations, each contributing to regional growth through healthcare modernization initiatives.
What applications dominate Asia Pacific medical display demand?
Asia Pacific medical display demand is strongest in radiology departments, surgical suites, diagnostic imaging centers, and clinical workstations requiring high-resolution visualization.
What factors are driving growth in the Asia Pacific medical display market?
Growth drivers in Asia Pacific include expanding healthcare infrastructure, aging populations, increased diagnostic imaging adoption, digital health transformation, and regulatory emphasis on diagnostic accuracy.
RESEARCH METHODOLOGY
The study focused on estimating the current size of the medical displays market through several key activities. Comprehensive secondary research was conducted to gather relevant information. Following this, the findings, assumptions, and estimates were validated by consulting with industry experts throughout the value chain using primary research methods. Various approaches, including top-down and bottom-up methods, were utilized to determine the overall market size. Subsequently, market segmentation and data triangulation procedures were employed to estimate the sizes of different segments and subsegments of the medical displays market.
Secondary Research
This research study extensively utilized secondary sources, including directories, databases such as Dun & Bradstreet, Bloomberg Business, Factiva, whitepapers, and documents from companies' houses. The secondary research aimed to gather information for a comprehensive technical, market-oriented, and commercial analysis of the medical displays market. It also provided crucial insights about the leading companies, market classification, segmentation based on industry trends down to the smallest details, geographic markets, and significant developments related to the market. Additionally, a database of key industry leaders was compiled using the information obtained through secondary research.
Primary Research
Various supply-side and demand-side sources were interviewed in the primary research process to gather qualitative and quantitative information for this report. On the supply side, primary sources included industry experts such as CEOs, vice presidents, marketing and sales directors, technology and innovation directors, engineers, and other key executives from companies and organizations within the medical displays market. On the demand side, primary sources comprised hospitals, clinics, researchers, lab technicians, purchasing managers, and stakeholders from corporate and government bodies.
Breakdown of Primary Interviews
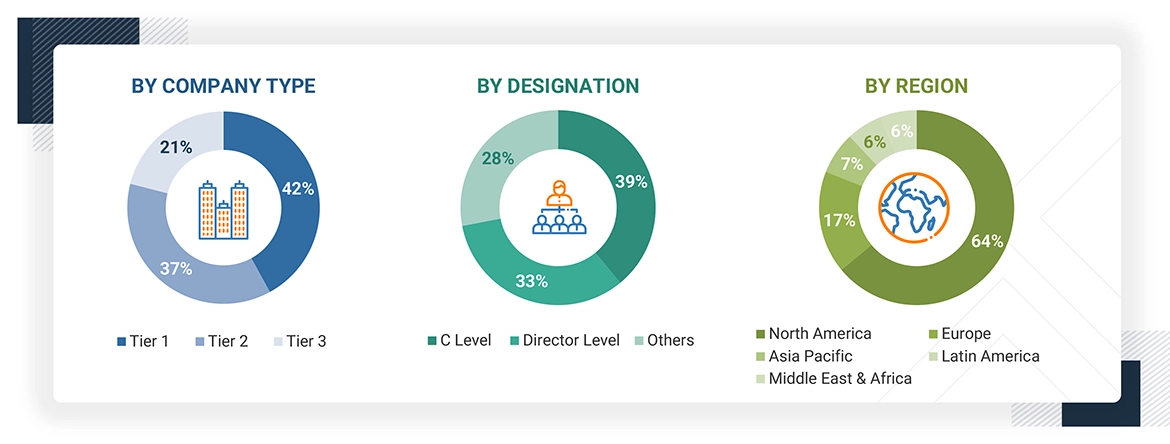
Note 1: C-level executives include CEOs, COOs, and CTOs.
Note 2: Others include sales, marketing, and product managers.
Note 3: Companies are classified into tiers based on their total revenue. As of 2024: Tier 1 = >USD 1 billion, Tier 2 = USD 500 million to USD 1 billion, and Tier 3 = < USD 500 million.
To know about the assumptions considered for the study, download the pdf brochure
Market Size Estimation
Both top-down and bottom-up approaches were used to estimate and validate the total size of the medical displays market. These methods were also used extensively to estimate the size of various subsegments in the market. The research methodology used to estimate the market size includes the following:
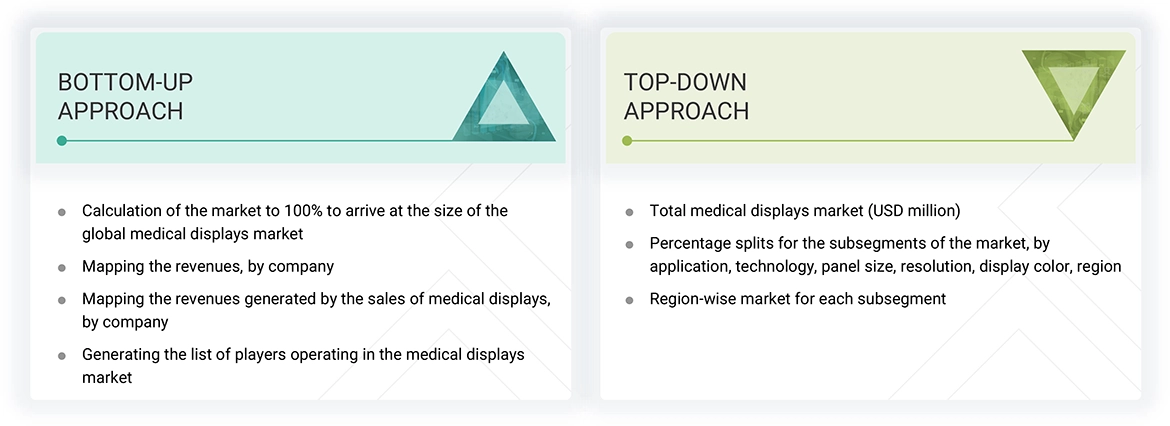
Data Triangulation
When the market size was determined, the entire market was split into five segments. Data triangulation and market breakdown processes were used where necessary to complete the entire market engineering process and arrive at precise statistics for all segments.
Approach to derive the market size and estimate market growth.
Market rankings for major players in the medical displays sector were established using secondary data from both paid and unpaid sources. Due to data limitations, the revenue share for some companies was assessed through a detailed analysis of their product portfolios and individual sales performance. This information was validated at each stage through in-depth interviews with industry professionals.
Market Definition
A display is an output device essential for presenting information, which can encompass textual content, images, or graphical data. Medical-grade displays are specialized monitors designed to precisely interpret diagnostic images, such as X-rays, MRIs, and CT scans. These displays adhere to strict standards for resolution, color accuracy, and contrast, enabling healthcare providers to view intricate details crucial for accurate diagnoses. By utilizing medical displays, healthcare professionals can make better-informed decisions regarding patient symptoms, disease diagnoses, and surgical procedures. The enhanced clarity and detail provided by these displays significantly improve the assessment and monitoring of medical conditions. Medical-grade displays are employed across a wide range of applications, including diagnostic imaging, surgical and interventional procedures, dentistry, and clinical reviews. Additionally, they play a vital role in training and educational settings, where precise visual representation is key to effective learning and understanding in the medical field. This ensures that both current and future healthcare providers are well-equipped to deliver high-quality patient care.
Stakeholders
- Raw material providers
- Medical display panel manufacturers
- Medical display-related service providers
- Medical display-related associations, organizations, forums, and alliances
- Government bodies, such as regulating authorities and policymakers
- Venture capitalists and start-ups
- Semiconductor component suppliers
- Medical display panel and device distributors & sales firms
- Medical display device end users
- Research institutes, organizations, and consulting companies
- Healthcare service providers
- Medical display software and service providers
Report Objectives
- To define, describe, and forecast the medical displays market based on application, technology, panel size, resolution, display color, and region
- To provide detailed information regarding the major factors influencing the market growth (drivers, restraints, opportunities, and challenges)
- To analyze the micromarkets with respect to individual growth trends, prospects, and contributions to the overall medical displays market
- To analyze market opportunities for stakeholders and provide details of the competitive landscape for key players
- To forecast the size of the medical displays market in six regions: North America (US and Canada), Europe (Germany, the UK, France, Spain, Italy, and the Rest of Europe), the Asia Pacific (Japan, China, India, Australia & New Zealand, South Korea, and the Rest of Asia Pacific), Latin America (Brazil, Mexico, Colombia, and the Rest of Latin America), the Middle East & Africa, and GCC Countries
- To analyze the impact of Gen AI on the growth of the medical displays market
- To strategically profile the key players in the global market and comprehensively analyze their core competencies
- To track and analyze competitive developments, such as product approvals, launches, expansions, and acquisitions, of the leading players in the market
Get the Full Medical Display Market Report
Full forecast, segment splits, and company analysis for all Medical Display Market.
- Canada Medical Display Market
- US Medical Display Market
- Germany Medical Display Market
- UK Medical Display Market
- France Medical Display Market
- Spain Medical Display Market
- Italy Medical Display Market
- China Medical Display Market
- Japan Medical Display Market
- India Medical Display Market
- South Korea Medical Display Market
- Australia Medical Display Market
- Brazil Medical Display Market
- Mexico Medical Display Market
- GCC Countries Medical Display Market
- Rest Of Europe Medical Display Market
- Rest Of Asia Pacific Medical Display Market
- Rest Of Latin America Medical Display Market
Need a Tailored Report?
Customize this report to your needs
Get 10% FREE Customization
Customize This Report
