
India Network API Market (2025-2030)

The India Network API Market was valued at $56.4 Million in 2025 and projected to reach to $215.1 Million by 2030, representing a compound annual growth rate of 30.7%. India's Network API market is poised for transformative growth, fueled by the country's digital-first economy and accelerating cloud infrastructure investments.


| Market Size in | USD 26.32 MN |
| Market Forecast in | |
| CAGR | |
| Forecast Period | |
| Units Considered | Value (USD MN) |
India Network API Market Trends and Insights
- This exceptional growth trajectory reflects India's accelerating digital transformation and increasing adoption of cloud-native architectures across telecommunications, fintech, and enterprise sectors.
- India's market growth rate of 30.7% CAGR significantly outpaces global averages, driven by rising API monetization strategies and the proliferation of 5G infrastructure. The Network API ecosystem in India is being catalyzed by growing demand from mobile operators, software-as-a-service providers, and digital payment platforms seeking seamless connectivity solutions.
- India's expanding developer community and government initiatives promoting digital innovation are creating favorable conditions for Network API adoption.
- Between 2025 and 2030, India is expected to consolidate its position as a key growth engine within the Asia Pacific region, with enterprises increasingly leveraging APIs to unlock new revenue streams and enhance operational efficiency. India's competitive landscape is characterized by both established telecommunications players and emerging API-first startups.
- The market's maturation in India will be shaped by standardization efforts, regulatory frameworks, and the integration of artificial intelligence into API management platforms..
Key Market Statistics
- CAGR (2025-2030) 30.7% CAGR
- Market Size, 2025 ~USD 56.4 Million
- Forecast, 2030 ~USD 215.1 Million
- Country India
India Network API Market Overview
Exceptional Growth Trajectory :
India's Network API market is expanding at 30.7% CAGR, significantly outpacing the global rate of 25.7%, driven by rapid digital transformation and cloud adoption across telecommunications, fintech, and enterprise sectors.
Market Valuation Surge :
The Indian market is valued at USD 56.4 million in 2025 and is projected to reach USD 215.1 million by 2030, representing a nearly 4x growth opportunity over the forecast period.
Telecom & Fintech Leadership :
India's telecommunications and financial services sectors are driving Network API adoption, leveraging APIs for enhanced connectivity, payment integration, and digital service delivery to millions of users.
Cloud-Native Architecture Shift :
Enterprises across India are increasingly adopting cloud-native architectures and microservices, creating substantial demand for Network APIs to enable seamless integration and scalability.
India Network API Market Dynamics
- The 30.7% CAGR reflects strong momentum from telecommunications operators, fintech startups, and enterprise organizations modernizing their technology stacks.
- Government initiatives promoting digital payments, 5G deployment, and startup ecosystems further accelerate adoption. By 2030, the market's expansion to USD 215.1 million will be driven by increased API monetization strategies, growing demand for real-time communication services, and integration of Network APIs into IoT and edge computing solutions.
- India's young tech-savvy population and cost-competitive development landscape position the country as a critical hub for Network API innovation and implementation..
Market Ecosystem
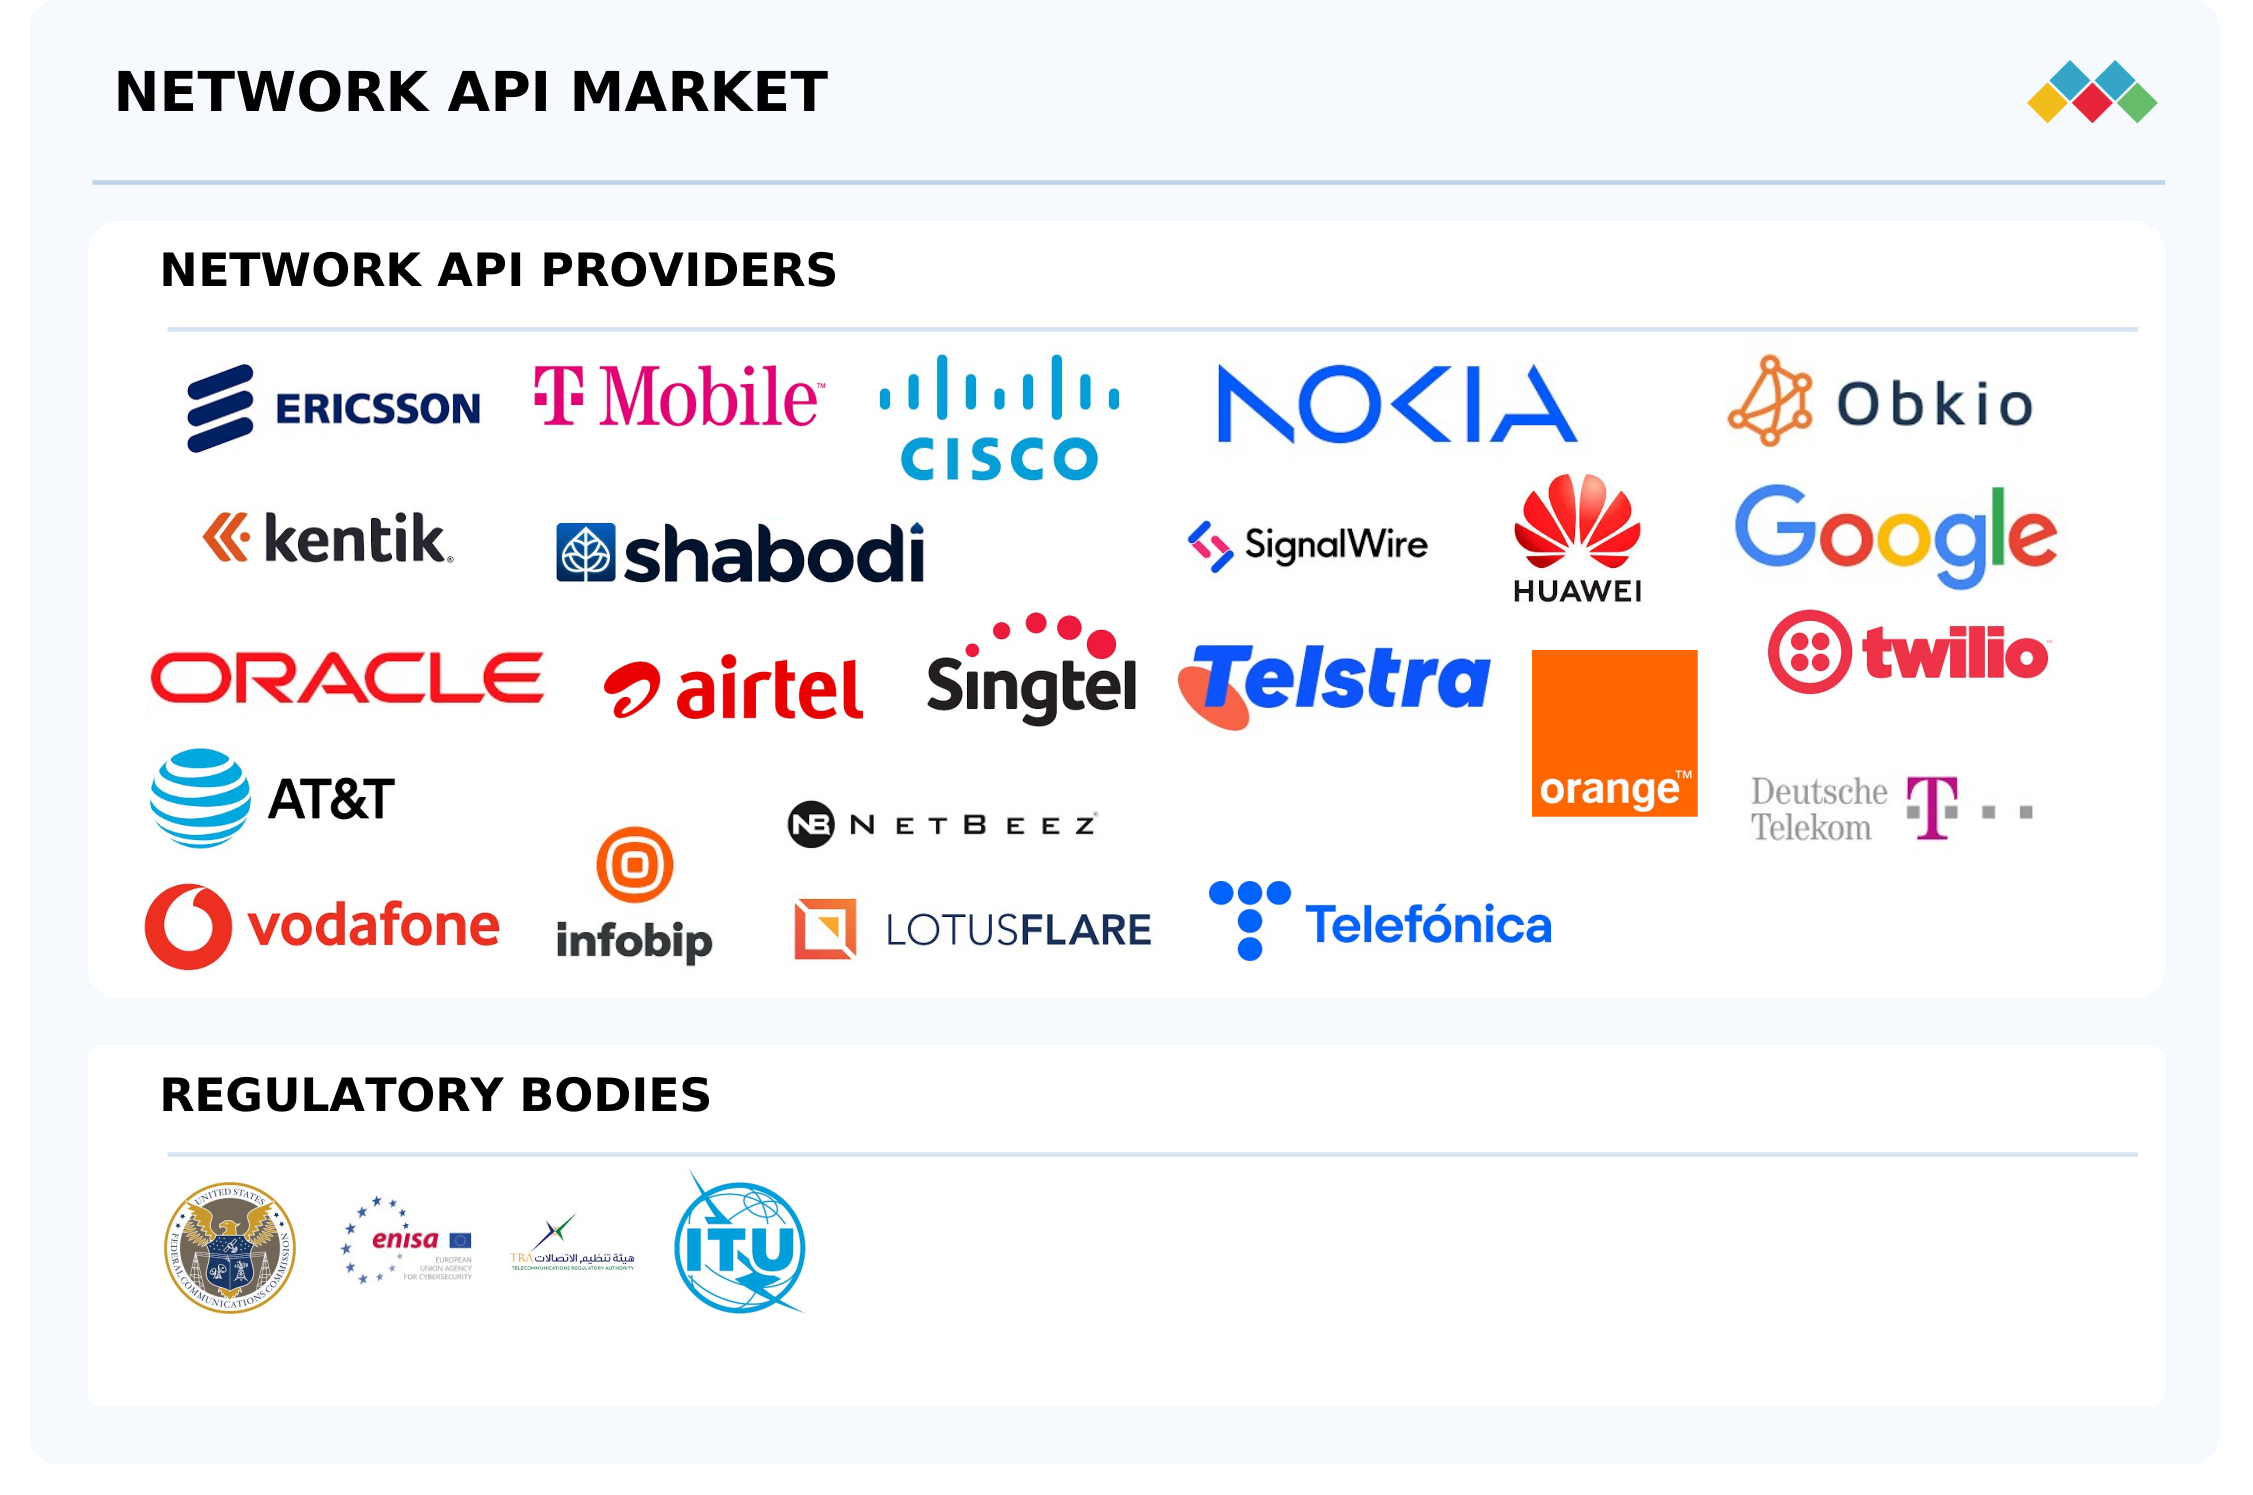
Network API Market: COMMERCIAL USE CASES ACROSS INDUSTRIES
| COMPANY | USE CASE DESCRIPTION | BENEFITS |
|---|---|---|
 |
Development of programmable network APIs for SD-WAN orchestration, enabling multi-vendor policy automation, dynamic path selection, and real-time telemetry. | Faster deployment cycles, centralized policy control, improved application performance, reduced operational complexity |
 |
Deployment of MagentaBusiness API platform for enterprise customers focusing on Quality-on-Demand services for teleoperated driving, device location tracking for logistics optimization, and roaming status verification for fraud prevention | Enhanced supply chain resilience, reduced operational costs, improved sustainability outcomes through precise location tracking, fraud mitigation, and guaranteed low-latency performance for safety-critical applications |
 |
Establishment of Network-as-a-Platform (NaaP) through centralized API catalog offering SIM swap detection for financial institutions, identity verification services, and network performance monitoring for industrial automation applications | Stronger competitive positioning, improved productivity through API reuse, reduced operational risks via automated fraud detection, enhanced supply chain resilience, and measurable ROI from automation initiatives |
 |
Integration of NetAware Platform with 5G network APIs for manufacturing clients, enabling real-time equipment monitoring, predictive maintenance automation, and enhanced security protocols across industrial IoT networks and private 5G infrastructure | Enhanced supply chain resilience, reduced operational costs through predictive maintenance, improved sustainability outcomes via automated optimization, and stronger security posture for industrial operations |
 |
Development of CAMARA-compliant API marketplace through Aduna joint venture offering standardized location services for fintech applications, quality-of-service APIs for healthcare applications, and edge computing capabilities for autonomous vehicle systems | Increased R&D efficiency through standardized APIs, transparent idea evaluation across partners, faster commercialization of innovative services, and enhanced customer engagement through personalized location-based applications |
Logos and trademarks shown above are the property of their respective owners. Their use here is for informational and illustrative purposes only.
Related Ecosystem
Data Centre And Networking
- Software-Defined Networking (SDN)
- Mid-Sized Data Centers
- Small Data Centers
- Remote Monitoring
- Smart Healthcare
- Cisco Systems, Inc.
- HUAWEI TECHNOLOGIES CO LTD
- Hewlett Packard Enterprise Company
- MITSUBISHI ELECTRIC INFORMATION SYSTEMS CORPORATION
- MITSUBISHI ELECTRIC INFORMATION NETWORK CORPORATION
Key Takeaways
- India's Network API market will grow from USD 56.4M (2025) to USD 215.1M (2030) at a 30.7% CAGR, outpacing global growth rates.
- India's 5G rollout and digital payment ecosystem are primary catalysts driving Network API adoption across telecommunications and fintech sectors.
- India's developer talent pool and government digital initiatives create a competitive advantage for API-first innovation and market expansion.
- India's market consolidation will be driven by standardization, regulatory frameworks, and AI-powered API management solutions through 2030.
Network API Market Report Scope
| Report Metric | Details |
|---|---|
| Base Year | 2025 |
| Fastest Growing Segment | APPLICATION INTEGRATION (Service Type) |
| Forecast Period | 2025-2030 |
| Growth Rate | CAGR of 25.7% from 2025 to 2030 |
| Largest Segment | PUBLIC CLOUD (Deployment Model) |
| Market Size Base Year (Billions) | ~USD 1.95 (2025) |
| Revenue Forecast (Billions) | ~USD 6.13 (2030) |
| Segments Covered | Api Type, Application, Vertical, Offering, Type, Organization Size, Deployment Type, Service Type, Deployment Model |
India Network API Market Report Segmentation
9 segment dimensions are covered across the global market.
By Api Type
- Device Status
- Edge
- Identity
- Location
- Network Performance
- Other Api Types
By Application
- Anti-Fraud
- Autonomous Vehicles
- Enterprise It
- Entertainment & Content Distribution
- IoT
- Other Applications
- Priority Communication
By Vertical
- Bfsi
- Energy And Utilities
- Financial Services
- Government
- Government & Public Sector
- Government And Public Sector
- Healthcare & Life Sciences
- Healthcare And Life Sciences
- It & Ites
- It And Ites
- Manufacturing
- Media & Entertainment
- Other Verticals
- Others*
- Retail & E-Commerce
- Retail & Ecommerce
- Retail And Consumer Goods
- Telecom
- Telecommunications
- Travel & Transportation
By Offering
- Platforms
- Services
By Type
- Api Analytics & Monitoring
- Api Developer Portal
- Api Gateways
- Api Lifecycle Management
- Api Security
- Other Platforms
By Organization Size
- Large Enterprises
- Medium-Sized Enterprises
- Smes
- Startups & Small Businesses
By Deployment Type
- Cloud
- On-Premises
By Service Type
- Api Management
- Application Integration
- B2B Integration
- Cloud Integration
- Data Integration
- Other Services*
By Deployment Model
- Private Cloud
- Public Cloud
INDIA: NETWORK API MARKET, BY APPLICATION, 2025–2030
| Segment | 2025 | 2026 | 2027 | 2028 | 2029 | 2030 | CAGR (%) |
|---|---|---|---|---|---|---|---|
| ANTI-FRAUD | 11.1 | 18.2 | 25.1 | 31.9 | 38.7 | 45.1 | 32.4 |
| AUTONOMOUS VEHICLES | 3.3 | 5.4 | 7.5 | 9.7 | 11.8 | 13.9 | 33.5 |
| ENTERPRISE IT | 7.2 | 11.6 | 15.7 | 19.6 | 23.4 | 26.8 | 30.2 |
| ENTERTAINMENT & CONTENT DISTRIBUTION | 9.9 | 16 | 21.8 | 27.5 | 32.9 | 37.9 | 30.8 |
| IOT | 17.3 | 27.7 | 37.3 | 46.5 | 55.1 | 62.6 | 29.4 |
| OTHER APPLICATIONS | 2.9 | 4.7 | 6.3 | 7.9 | 9.5 | 10.9 | 30.4 |
| PRIORITY COMMUNICATION | 4.9 | 7.9 | 10.7 | 13.3 | 15.8 | 18.1 | 29.8 |
| TOTAL | 56.4 | 91.4 | 124.4 | 156.4 | 187.3 | 215.1 | 30.7 |
Target Audience
- Telecom Operators & Service Providers : Need detailed market insights to develop Network API monetization strategies, understand competitive positioning, and identify opportunities for service expansion across India's growing digital ecosystem.
- Fintech & Payment Companies : Require market data to assess API integration opportunities, evaluate growth potential in India's digital payments sector, and plan product development aligned with market demand.
- Enterprise Technology Leaders : Seek comprehensive market analysis to guide cloud-native architecture adoption, API infrastructure investments, and digital transformation initiatives across Indian operations.
- API Platform & Software Vendors : Need India-specific market intelligence to develop localized solutions, identify customer segments, and create go-to-market strategies for Network API platforms in the Indian market.
- Investment & Consulting Firms : Require validated market data and growth forecasts to support due diligence, investment thesis development, and strategic advisory services for clients targeting India's technology sector.
Reasons to Buy this Report
- Market Size & Growth Validation : Obtain precise valuation data for India's Network API market (USD 56.4M in 2025) with verified 30.7% CAGR projections through 2030, enabling accurate business planning and investment decisions.
- Competitive Positioning Intelligence : Understand India's market dynamics relative to global trends (25.7% global CAGR) to identify competitive advantages, market gaps, and opportunities for differentiation in the Indian ecosystem.
- Sector-Specific Insights : Access detailed analysis of Network API adoption across India's telecommunications, fintech, and enterprise sectors, with actionable intelligence on key growth drivers and implementation trends.
- Strategic Investment Guidance : Leverage comprehensive market forecasts and growth trajectory data to guide investment decisions, partnership strategies, and go-to-market approaches tailored to India's unique market conditions.
- Risk Mitigation & Planning : Reduce market entry risks by understanding India-specific regulatory landscape, adoption patterns, and competitive dynamics that influence Network API deployment and revenue generation.
Frequently asked questions
What is the projected size of India's Network API market by 2030?
India's Network API market is projected to reach USD 215.1 million by 2030, growing from USD 56.4 million in 2025 at a compound annual growth rate of 30.7%.
What are the primary drivers of Network API growth in India?
India's Network API growth is driven by 5G infrastructure expansion, digital payment platform proliferation, cloud-native adoption, API monetization strategies, and government digital transformation initiatives.
How does India's Network API market growth compare to global trends?
India's 30.7% CAGR significantly exceeds the global Network API market CAGR of 25.7%, positioning India as a high-growth market within the Asia Pacific region.
Which industries are driving Network API adoption in India?
Telecommunications operators, fintech companies, software-as-a-service providers, and digital payment platforms are the primary sectors driving Network API adoption in India.
What challenges does India's Network API market face through 2030?
India's Network API market faces challenges including regulatory standardization, data localization requirements, cybersecurity concerns, and the need for interoperability standards across telecommunications providers.
RESEARCH METHODOLOGY
This research study involved four major activities in estimating the network API market size. Exhaustive secondary research was carried out to collect important information about the market and peer markets. The next step involved validating these findings and assumptions and sizing them with the help of primary research with industry experts across the value chain. The top-down and bottom-up approaches were used to estimate the market size. After the market breakdown, data triangulation was utilized to estimate the sizes of segments and sub-segments.
Secondary Research
The revenue generated by companies providing network API solutions to different end users was evaluated using secondary data from both paid and unpaid sources. This process involved analyzing the product portfolios of major companies in the industry and assessing their performance and quality to rate them accordingly. In the secondary research process, various sources were referred to to identify and collect information for the study. These included annual reports, press releases, investor presentations of companies, white papers, certified publications, and articles from recognized associations and government publishing sources.
Secondary research was mainly used to obtain critical information about industry insights, the market’s monetary chain, the overall pool of key players, market classification and segmentation based on the industry trends to the bottom-most level, regional markets, and key developments from market- and technology-oriented perspectives.
Primary Research
In the primary research process, various sources from the supply and demand sides were interviewed to obtain qualitative and quantitative information for the report, such as Chief Experience Officers (CXOs), Vice Presidents (VPs), directors from business development, marketing, and product development/innovation teams, and related key executives from network API solutions vendors, system integrators, professional and managed service providers, industry associations, independent consultants, and key opinion leaders.
Primary interviews were conducted to gather insights, such as market statistics, data on revenue collected from platforms and services, market breakups, market size estimations, market forecasts, and data triangulation. Stakeholders from the demand side, such as Chief Information Officers (CIOs), Chief Finance Officers (CFOs), Chief Strategy Officers (CSOs), and the installation team of end users who use network API solutions, were interviewed to understand buyers’ perspectives on suppliers, products, service providers, and their use of network API solutions which is expected to affect the overall network API market growth.
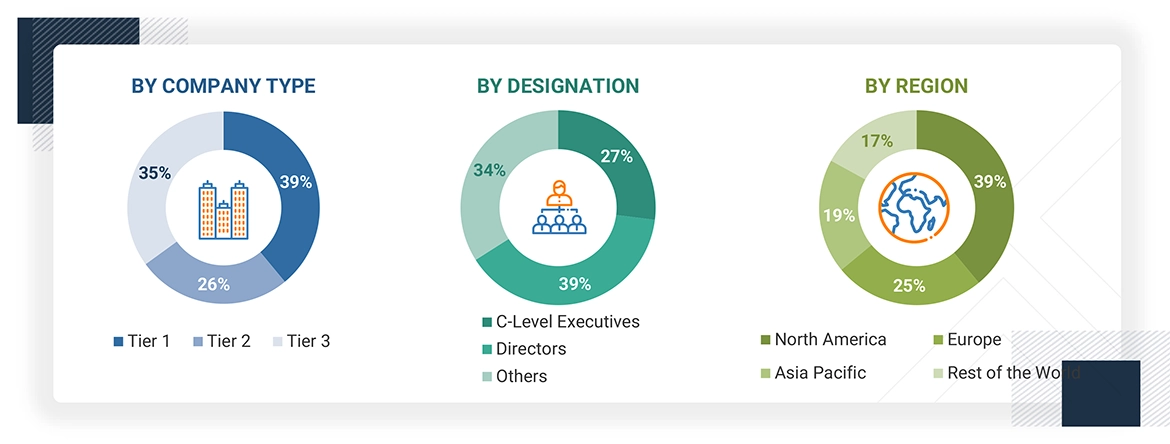
Note: Tier 1 companies have revenues over USD 1 billion, Tier 2 companies have revenues between
USD 500 million and 1 billion, and Tier 3 companies have revenues less than USD 500 million. Other
designations include sales managers, marketing managers, and product managers.
Source: Industry Experts
To know about the assumptions considered for the study, download the pdf brochure
Market Size Estimation
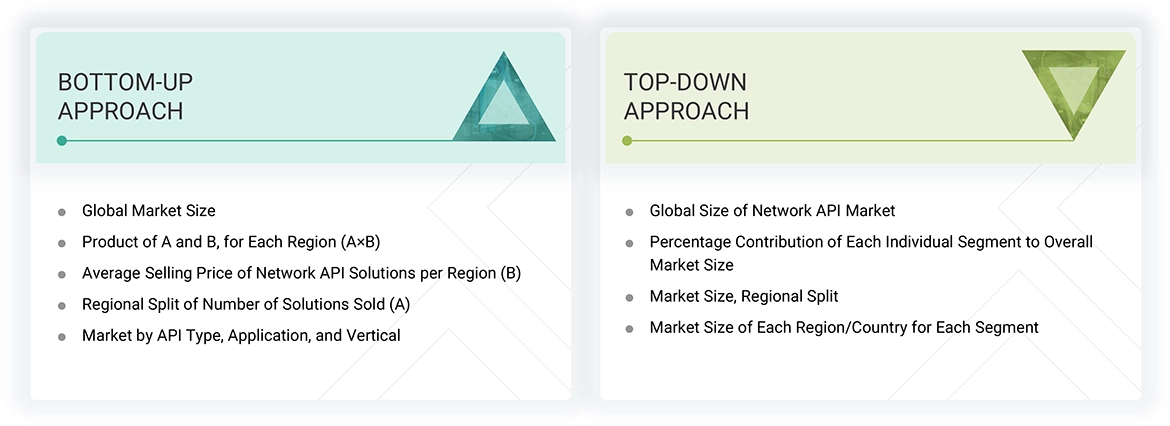
Both top-down and bottom-up approaches were used to estimate and validate the total size of the network API market. These methods were also used extensively to estimate the size of various subsegments in the market.
Network API Market : Top-Down and Bottom-Up Approach
Data Triangulation
The network API market was split into several segments and sub-segments after determining the overall market size from the above estimation process. To complete the overall market engineering process and arrive at the exact statistics for all segments and sub-segments, data triangulation and market breakdown procedures were used, wherever applicable. The data was triangulated by studying various factors and trends from the demand and supply sides. The network API market size was validated using top-down and bottom-up approaches.
Market Definition
Network APIs are programming interfaces that allow developers and third-party applications to access and program the functions, data, and capabilities of network infrastructure. These APIs abstract the complexity of the underlying network, transforming it from a closed system into an open, programmable platform. This enables developers to build new applications and services that are deeply integrated with the network. The market includes a variety of API types that provide access to these capabilities, such as device status, edge, identity, location, network performance, and others (policy control, security, analytics, etc.).
Stakeholders
- Cloud Service Providers
- API Developers and Providers
- Edge & CDN Providers
- Security Vendors
- API Management Vendors
- Software Developers and Application Providers
- Managed Service Providers
- Regulatory Bodies
Report Objectives
- To determine and forecast the network API market by API type, application, vertical, and region from 2025 to 2030, and analyze various macroeconomic and microeconomic factors that affect the market growth
- To forecast the size of the market segments with respect to five main regions: North America, Europe, Asia Pacific (APAC), Latin America, and the Middle East & Africa (MEA)
- To provide detailed information about the major factors (drivers, restraints, opportunities, and challenges) influencing the growth of the market
- To analyze each submarket with respect to individual growth trends, prospects, and contributions to the overall market
- To analyze the opportunities in the market for stakeholders by identifying the high-growth segments of the market
- To profile the key market players, provide a comparative analysis on the basis of business overviews, regional presence, product offerings, business strategies, and key financials, and illustrate the competitive landscape of the market
- To track and analyze competitive developments, such as mergers and acquisitions, product developments, partnerships and collaborations, and research and development (R&D) activities, in the market
Available Customizations
With the given market data, MarketsandMarkets offers customizations based on the company’s specific needs. The following customization options are available for the report:
Geographic Analysis as per Feasibility
- Further break-up of the Asia Pacific market into countries contributing 75% to the regional market size
- Further break-up of the North American market into countries contributing 75% to the regional market size
- Further break-up of the Latin American market into countries contributing 75% to the regional market size
- Further break-up of the Middle East & African market into countries contributing 75% to the regional market size
- Further break-up of the European market into countries contributing 75% to the regional market size
Company Information
- Detailed analysis and profiling of additional market players (up to five)
Get the Full Network API Market Report
Full forecast, segment splits, and company analysis for all Network API Market.
- UK Network API Market
- Germany Network API Market
- France Network API Market
- Spain Network API Market
- Russia Network API Market
- China Network API Market
- Japan Network API Market
- Brazil Network API Market
- US Network API Market
- Canada Network API Market
- Italy Network API Market
- Nordic Countries Network API Market
- Rest Of Europe Network API Market
- Anz Network API Market
- Rest Of Asia Pacific Network API Market
- South Korea Network API Market
- Southeast Asia Network API Market
- Mexico Network API Market
- Rest Of Latin America Network API Market
- Bahrain Network API Market
- Ksa Network API Market
- Kuwait Network API Market
- Rest Of Middle East Network API Market
- UAE Network API Market
Need a Tailored Report?
Customize this report to your needs
Get 10% FREE Customization
Customize This Report
