
Rest Of Asia Pacific Onshore Wind Market (2026-2031)

The Rest Of Asia Pacific Onshore Wind Market was valued at $1158 Million in 2026 and projected to reach to $2760 Million by 2031, representing a compound annual growth rate of CAGR 10.1%. Rest Of Asia Pacific's onshore wind market is positioned as a critical growth engine for regional renewable energy transition.


| Market Size in | USD 26.32 MN |
| Market Forecast in | |
| CAGR | |
| Forecast Period | |
| Units Considered | Value (USD MN) |
Rest Of Asia Pacific Onshore Wind Market Trends and Insights
- Rest Of Asia Pacific represents a critical growth corridor for renewable energy deployment, driven by rising energy demand, supportive government policies, and declining turbine costs.
- Rest Of Asia Pacific's diverse geography and varying wind resources create both opportunities and challenges for market participants seeking to capitalize on this expanding sector. Rest Of Asia Pacific's onshore wind market growth reflects the region's commitment to decarbonization and energy security objectives.
- Rest Of Asia Pacific is witnessing increased investment in wind infrastructure, technological advancement, and grid modernization initiatives.
- Rest Of Asia Pacific's 10.1% CAGR through 2031 underscores the region's potential as a key contributor to Asia Pacific's renewable energy transition and global climate goals..
Key Market Statistics
- CAGR (2026-2031) CAGR 10.1%
- Market Size, 2026 ~USD 1158 Million
- Forecast, 2031 ~USD 2760 Million
- Country Rest Of Asia Pacific
Rest Of Asia Pacific Onshore Wind Market Overview
Market Valuation Growth :
Rest Of Asia Pacific onshore wind market valued at USD 1,158 million in 2026, expanding to USD 2,760 million by 2031, representing a 138% increase over the forecast period.
Consistent CAGR Performance :
Rest Of Asia Pacific demonstrates a 10.1% CAGR from 2026-2031, closely aligned with the global growth rate of 10.3%, indicating strong regional competitiveness in renewable energy adoption.
Policy & Infrastructure Drivers :
Supportive government policies, renewable energy targets, and grid modernization initiatives across Rest Of Asia Pacific countries are accelerating onshore wind deployment and investment.
Cost Competitiveness :
Declining turbine costs and improving supply chain efficiency in Rest Of Asia Pacific are making onshore wind increasingly cost-competitive against conventional energy sources.
Rest Of Asia Pacific Onshore Wind Market Dynamics
- The region's diverse geography, combined with escalating electricity demand from rapid industrialization and urbanization, creates substantial opportunities for wind farm development.
- Government commitments to carbon neutrality and renewable energy mandates are catalyzing significant capital investments in wind infrastructure across multiple countries within the region. The forecast period through 2031 will witness accelerated deployment driven by technological advancements, competitive turbine pricing, and enhanced grid connectivity.
- Rest Of Asia Pacific's varying wind resources and geographic characteristics present both challenges and opportunities for localized project development.
- Strategic partnerships between international developers and local stakeholders will be essential for capturing the projected market expansion and achieving sustainable energy goals..
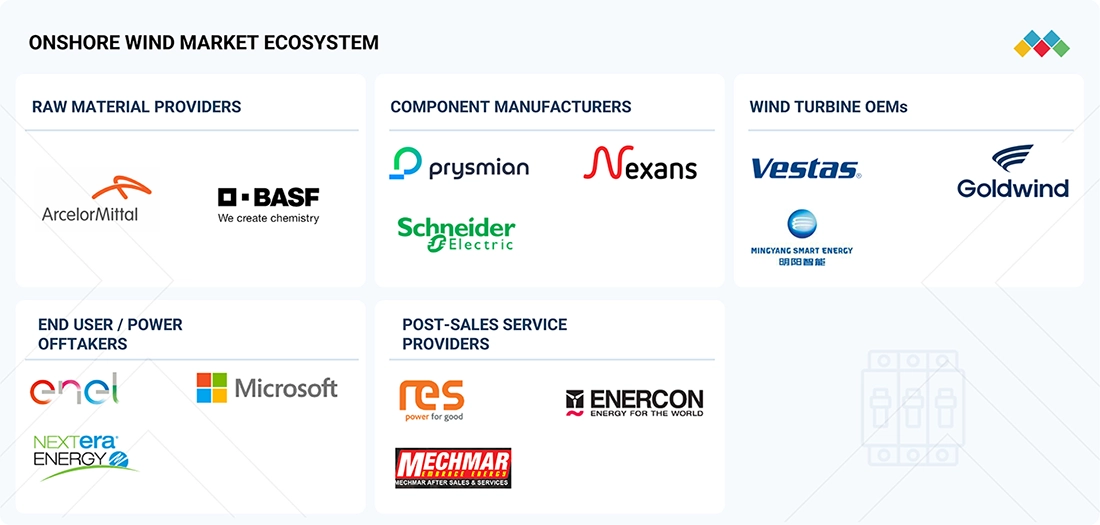
Market Ecosystem
ONSHORE WIND MARKET: COMMERCIAL USE CASES ACROSS INDUSTRIES
| COMPANY | USE CASE DESCRIPTION | BENEFITS |
|---|---|---|
 |
Whitelee Wind Farm, one of the UK’s largest onshore wind facilities, required modernization to improve energy output and operational efficiency while supporting the country’s renewable energy targets. Aging assets and evolving grid requirements made repowering and digital optimization increasingly important. | Modernization enhanced annual energy production, reduced maintenance-related downtime, extended asset life, and improved overall project economics. It also supported lower lifecycle costs and increased reliability, enabling the wind farm to continue supplying renewable electricity efficiently. |
 |
The 372 MW Björnberget project in Sweden was developed to strengthen renewable electricity generation in the Nordic region while taking advantage of favorable wind resources and modern high-capacity turbine technology | The project achieved higher energy capture, improved operational efficiency, and enhanced reliability, contributing substantial clean electricity to the regional grid while reducing the levelized cost of energy over the project lifetime. |
Logos and trademarks shown above are the property of their respective owners. Their use here is for informational and illustrative purposes only.
Related Ecosystem
Decarbonization
- Battery Electric Vehicle (BEV)
- Energy Management Systems
- Fuel Cell
- Fuel Cell Electric Vehicle (FCEV)
- Geographical Information System (GIS)
- TotalEnergies SE
- Siemens ag
- Mitsui & Co., Ltd.
- General Electric Company
- Thyssenkrupp ag
Key Takeaways
- Rest Of Asia Pacific onshore wind market valued at USD 1,158M in 2026, expanding to USD 2,760M by 2031 at 10.1% CAGR
- Rest Of Asia Pacific benefits from supportive renewable energy policies and declining turbine technology costs driving market adoption
- Rest Of Asia Pacific's diverse wind resources and growing energy demand create substantial investment opportunities for developers
- Rest Of Asia Pacific faces grid integration challenges and infrastructure development requirements to support accelerated wind capacity deployment
Onshore Wind Market Report Scope
| Report Metric | Details |
|---|---|
| Base Year | 2026 |
| Fastest Growing Segment | ABOVE 5 MW (Turbine Rating) |
| Forecast Period | 2026-2031 |
| Growth Rate | CAGR of 10.3% from 2026 to 2031 |
| Largest Segment | TURBINES (Component) |
| Market Size Base Year (Billions) | ~USD 132.9 (2026) |
| Revenue Forecast (Billions) | ~USD 216.97 (2031) |
| Segments Covered | Component, Turbine Rating |
Rest Of Asia Pacific Onshore Wind Market Report Segmentation
2 segment dimensions are covered across the global market.
By Component
- Electrical Infrastructure
- Turbines
By Turbine Rating
- 2-3 Mw
- 4-5 Mw
- Above 5 Mw
- Below 2 Mw
Target Audience
- Wind Energy Developers : Need Rest Of Asia Pacific market data to identify high-potential regions for onshore wind farm development, assess competitive dynamics, and plan project pipelines.
- Investment & Private Equity Firms : Require detailed market forecasts and growth drivers for Rest Of Asia Pacific to evaluate investment opportunities, assess portfolio risks, and allocate capital strategically.
- Utility Companies & Energy Providers : Need regional market intelligence to plan renewable energy procurement, understand supply dynamics, and align wind energy strategies with Rest Of Asia Pacific demand trends.
- Government & Policy Makers : Utilize market analysis to develop renewable energy policies, set realistic deployment targets, and design incentive structures aligned with Rest Of Asia Pacific's wind energy potential.
- Equipment Manufacturers & Suppliers : Require market sizing and growth projections for Rest Of Asia Pacific to forecast turbine demand, plan manufacturing capacity, and identify regional supply chain opportunities.
Reasons to Buy this Report
- Regional Market Sizing & Forecasts : Obtain precise market valuations and growth projections specific to Rest Of Asia Pacific, enabling accurate budget allocation and investment planning for wind energy projects in the region.
- Competitive Landscape Intelligence : Understand Rest Of Asia Pacific's market dynamics, key players, and competitive positioning to identify partnership opportunities and strategic entry points for wind energy businesses.
- Policy & Regulatory Insights : Access detailed analysis of government incentives, renewable energy targets, and regulatory frameworks driving onshore wind adoption across Rest Of Asia Pacific countries.
- Investment Decision Support : Leverage comprehensive market data and growth drivers to make informed investment decisions and prioritize wind energy projects with highest potential returns in Rest Of Asia Pacific.
- Risk Mitigation & Opportunity Mapping : Identify geographic hotspots, emerging markets, and potential challenges within Rest Of Asia Pacific to optimize project development strategies and minimize deployment risks.
Frequently asked questions
What is the market size of onshore wind in Rest Of Asia Pacific?
Rest Of Asia Pacific's onshore wind market is estimated at USD 1,158 million in 2026 and is forecast to reach USD 2,760 million by 2031.
What is the CAGR for Rest Of Asia Pacific onshore wind market?
Rest Of Asia Pacific's onshore wind market is projected to grow at a compound annual growth rate (CAGR) of 10.1% from 2026 to 2031.
What factors are driving growth in Rest Of Asia Pacific onshore wind?
Rest Of Asia Pacific's market growth is driven by increasing energy demand, supportive government renewable energy policies, declining turbine costs, and climate commitments.
What challenges does Rest Of Asia Pacific onshore wind market face?
Rest Of Asia Pacific faces challenges including grid integration complexities, infrastructure development requirements, land availability constraints, and varying regulatory frameworks across countries.
Which countries contribute most to Rest Of Asia Pacific onshore wind market?
Rest Of Asia Pacific's market includes diverse contributors with varying wind resources and development stages, each playing a role in the region's renewable energy expansion.
RESEARCH METHODOLOGY
The study involved major activities in estimating the current size of the onshore wind market. Exhaustive secondary research was done to collect information on the peer and parent markets. The next step was to validate these findings, assumptions, and sizing with industry experts across the value chain through primary research. Both top-down and bottom-up approaches were employed to estimate the complete market size. Thereafter, market breakdown and data triangulation were used to estimate the market size of the segments and subsegments.
Secondary Research
This research study on the onshore wind market involved the use of extensive secondary sources, directories, and databases, such as D&B Hoovers, Bloomberg, Businessweek, Factiva, International Energy Agency, and BP Statistical Review of World Energy, to identify and collect valuable information for a technical, market-oriented, and commercial study of the global onshore wind market. The other secondary sources included companies' annual reports, press releases, and investor presentations; white papers; certified publications; articles by recognized authors; manufacturer associations; trade directories; and databases.
Primary Research
The onshore wind market comprises stakeholders across the value chain, including onshore wind turbine manufacturers, component suppliers, onshore cable manufacturers, onshore substation providers, EPC contractors, project developers, utilities, transmission system operators, engineering consultants, digital technology providers, and operations & maintenance service providers. On the demand side, the market is driven by the increasing deployment of onshore wind projects across key regions, including Europe, Asia Pacific, and North America, supported by growing investments from utilities, independent power producers (IPPs), governments, and industrial energy consumers seeking large-scale renewable energy solutions. On the supply side, turbine manufacturers, foundation suppliers, electrical infrastructure providers, and onshore service companies are benefiting from increasing project awards, long-term supply agreements, and investments in onshore renewable energy infrastructure. Various primary sources from both the supply and demand sides of the market were interviewed to obtain qualitative and quantitative information. The following is the breakdown of primary respondents:
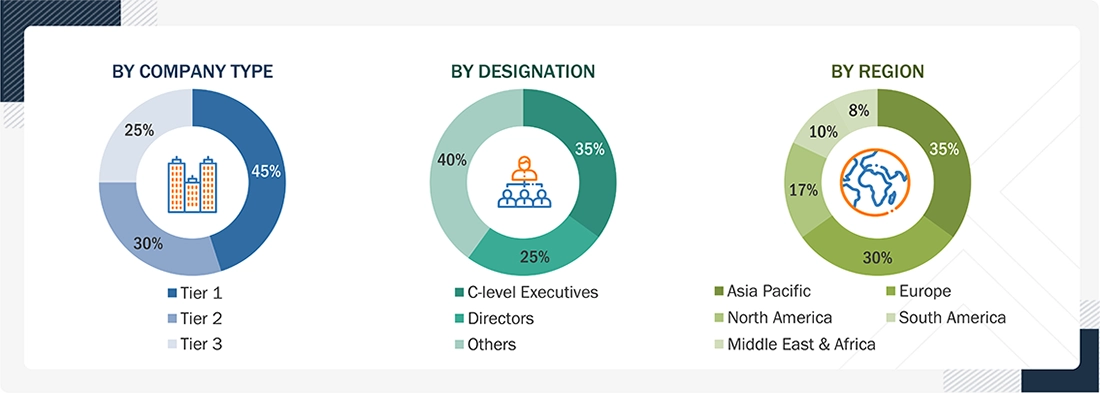
Note: Others include sales managers, engineers, and regional managers.
The tiers of the companies are defined by their total revenue as of 2024: Tier 1: > USD 1 billion; Tier 2: USD 500 million–1 billion; and Tier 3: < USD 500 million.
To know about the assumptions considered for the study, download the pdf brochure
Market Size Estimation
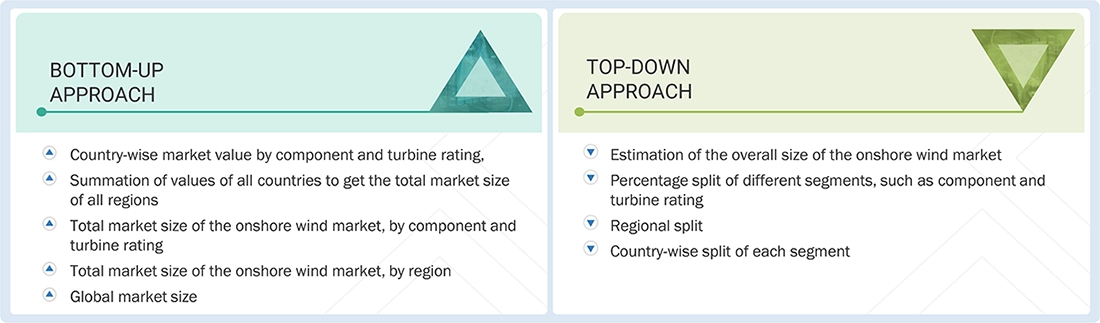
Both top-down and bottom-up approaches were employed to estimate and validate the size of the onshore wind market and its dependent submarkets. The key players in the market were identified through secondary research, and their market share in the respective regions was determined through a combination of primary and secondary research. The research methodology involves analyzing the annual and financial reports of leading market players and conducting interviews with industry experts, including chief executive officers, vice presidents, directors, sales managers, and marketing executives, to gather key quantitative and qualitative insights into the onshore wind market.
Data Triangulation
After determining the overall market size through the estimation process explained above, the total market has been divided into several segments and subsegments. To complete the overall market engineering process and obtain exact statistics for all segments and subsegments, data triangulation and market breakdown have been employed where applicable. The data has been triangulated by studying various factors and trends from both the demand and supply sides. Additionally, the market has been validated using both top-down and bottom-up approaches.
Market Definition
The onshore wind market encompasses the development, manufacturing, and installation of land-based wind energy systems that generate electricity from wind. It includes key components such as wind turbines, nacelles, rotors and blades, towers, and supporting electrical infrastructure, including wires and cables, substations, and related balance-of-plant equipment. The market covers turbine capacity segments ranging from up to 2 MW to above 5 MW and serves utility-scale, commercial, industrial, and government-backed renewable energy projects. Market growth is driven by decarbonization initiatives, favorable regulatory policies, technological advancements in turbine design, declining electricity generation costs, and increasing investments in sustainable and energy-secure power infrastructure.
Key Stakeholders
- Project Developers & Owners
- Turbine Manufacturers
- EPC Contractors & Marine Engineering Firms
- Mooring, Anchoring, & Subsea System Providers
- Electrical Infrastructure & Grid Connection Providers
- Governments & Regulatory Authorities
- Investors & Financial Institutions
- Research Institutions & Certification Bodies
- Energy Associations
- Environmental Associations
- Energy Efficiency Consultants
Report Objectives
- To describe and forecast the onshore wind market, by turbine rating and component, in terms of value
- To describe and forecast the onshore wind market for various segments with respect to five main regions: North America, Europe, Asia Pacific, South America, and Middle East & Africa, along with their country-level analysis, in terms of value
- To provide detailed information regarding the major drivers, restraints, opportunities, and challenges influencing the growth of the onshore wind market
- To analyze market opportunities for stakeholders and provide a detailed competitive landscape for market leaders
- To strategically analyze micromarkets about individual growth trends, prospects, and contributions to the total market
- To strategically profile the key players and comprehensively analyze their market shares and core competencies
- To provide a detailed overview of the unmet needs and white spaces, interconnected markets and cross-sector opportunities, strategic moves by tier-1/2/3 players, onshore wind market value chain analysis, ecosystem analysis, key conferences and events, key stakeholders and buying criteria, patent analysis, trends/disruptions impacting customer business, trade analysis, tariff analysis, investment and funding scenario, technology analysis, technology/product roadmap, case study analysis, regulations, future applications, macroeconomic outlook, pricing analysis, Porter’s five forces analysis, sustainability initiatives, adoption barriers and internal challenges, market profitability, impact of regulatory policies on sustainability initiatives, certifications, labeling and eco-standards, decision making process, impact of gen AI, and the 2024 US tariff impact
- To analyze competitive developments, such as agreements, product launches, expansions, contracts, investments, partnerships, collaborations, announcements, and acquisitions in the market
Available customizations:
MarketsandMarkets offers customizations tailored to the specific needs of companies using the given market data.
The following customization options are available for the report:
Product Analysis
- Product matrix, which gives a detailed comparison of the product portfolio of each company
Regional Analysis
- Further breakdown of the onshore wind systems, by country
Company Information
- Detailed analysis and profiling of additional market players (up to five)
Get the Full Onshore Wind Market Report
Full forecast, segment splits, and company analysis for all Onshore Wind Market.
- China Onshore Wind Market
- India Onshore Wind Market
- Australia Onshore Wind Market
- Vietnam Onshore Wind Market
- Canada Onshore Wind Market
- US Onshore Wind Market
- Germany Onshore Wind Market
- UK Onshore Wind Market
- Spain Onshore Wind Market
- France Onshore Wind Market
- Italy Onshore Wind Market
- Sweden Onshore Wind Market
- Saudi Arabia Onshore Wind Market
- South Africa Onshore Wind Market
- Brazil Onshore Wind Market
- Rest Of Europe Onshore Wind Market
- Rest Of South America Onshore Wind Market
Need a Tailored Report?
Customize this report to your needs
Get 10% FREE Customization
Customize This Report
