Onshore Wind Market

Onshore Wind Market by Component (Turbines, Electrical Infrastructure), By Turbine Rating (below 2 MW, 2-3 MW, 3-5 MW, and above 5 MW) and Region - Global Forecast to 2035




OVERVIEW
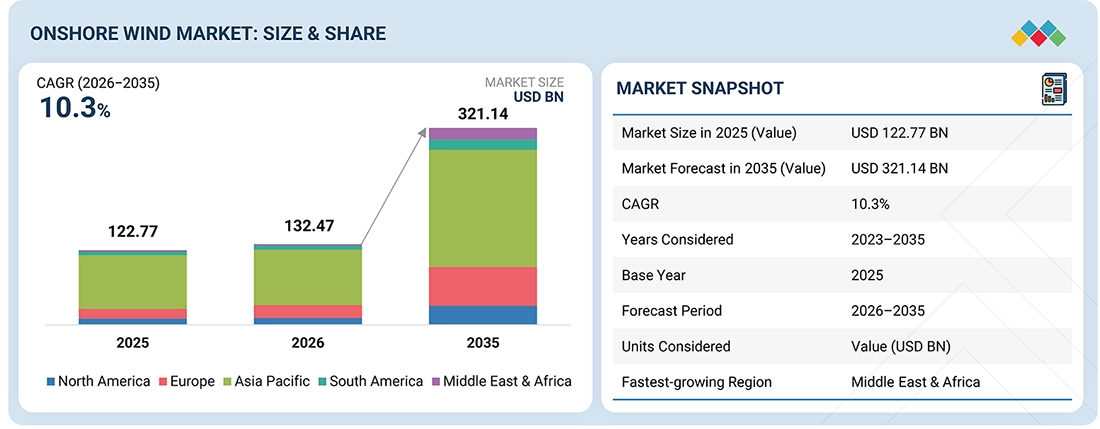
Source: Secondary Research, Interviews with Experts, MarketsandMarkets Analysis
The onshore wind market is projected to grow at a CAGR of 10.3% during the forecast period, increasing from an estimated USD 132.47 billion in 2026 to USD 321.14 billion by 2035. The global onshore wind market is primarily driven by increased electricity demand and supportive government policies that enable reductions in greenhouse gas emissions. Technological advancements in larger, more efficient turbines, declining levelized cost of electricity (LCOE), expanding grid infrastructure, and increasing corporate renewable energy procurement are further driving installations. Additionally, energy security will continue to drive investment in onshore wind energy, as more capital is allocated to domestic renewable energy generation capacity for long-term use.
Key Market Trends & Insights
- Asia Pacific dominated the market, accounting for a 71.0% share in 2025.
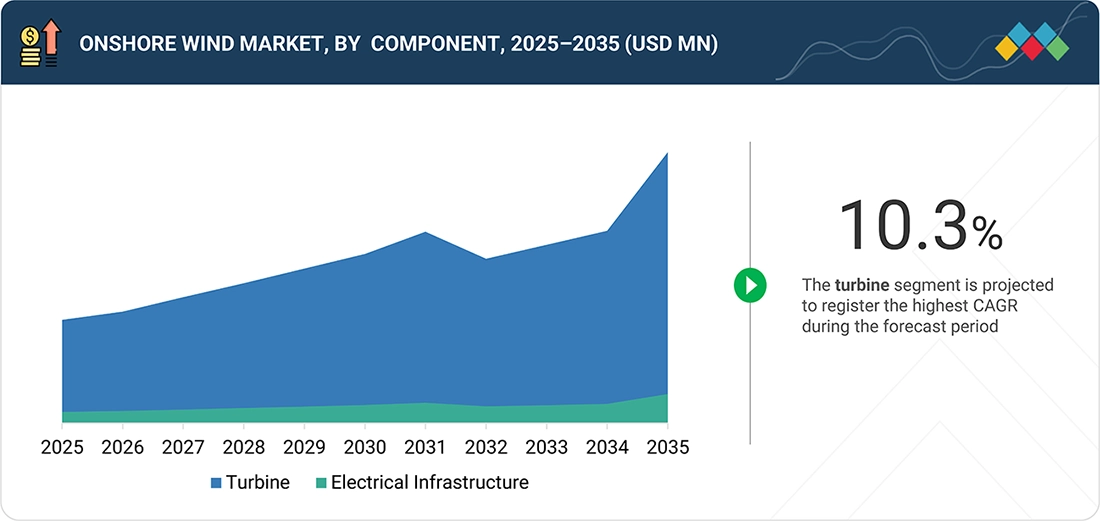
- By component, the turbines segment is expected to register the highest CAGR of 10.4% during the forecast period.
- By turbine rating, the above 5 MW segment is projected to grow at the fastest CAGR of 13.4% from 2026 to 2035.
- Rising electricity demand, favorable government policies, declining levelized cost of electricity (LCOE), and advancements in high-capacity wind turbines are driving market growth.
- Increasing investments in grid infrastructure, corporate renewable energy procurement, and energy security initiatives are creating significant opportunities for the onshore wind market.
Market Size & Forecast
- 2025 Market Size: USD 122.77 Billion
- 2026 Market Size: USD 132.47 Billion
- 2035 Projected Market Size: USD 321.14 Billion
- CAGR (2026–2035): 10.3%
- Asia Pacific: Largest regional market in 2025
KEY TAKEAWAYS
-
BY REGIONThe Asia Pacific accounts for the largest market share of 71.0% in 2025.
-
BY COMPONENTBy component, the turbines segment is projected to grow at a CAGR of 10.4% from 2026 to 2035.
-
BY TURBINE RATINGBy end user, the above 5 MW segment is projected to grow at the highest CAGR of 13.4% from 2026 to 2035.
-
COMPETITIVE LANDSCAPE - KEY PLAYERSCompanies such as Vestas (Denmark), Mingyang Smert Energy Group Co., Ltd. (China), and Goldwind (China), were identified as some of the star players in the offshore wind market.
-
COMPETITIVE LANDSCAPE - STARTUPS/SMEsFlower Turbines (US), EWT (Netherlands) and Letwind (Italy) have distinguished themselves among the Startups and SMEs in the offshore wind market.
An onshore wind system is a land-based renewable energy installation that converts the kinetic energy of wind into electricity using wind turbines. A typical onshore wind project comprises rotor blades, a nacelle housing the drivetrain and generator, a tower, electrical infrastructure, and grid-connection equipment, all designed to efficiently capture wind energy and deliver clean power to the electricity network. Owing to its mature technology, competitive cost profile, and scalability, onshore wind has become one of the most widely deployed renewable energy sources globally. Onshore wind farms are used in utility-scale, commercial, and community energy applications to support decarbonization, strengthen energy security, and reduce reliance on fossil-fuel-based power generation. Continuous advancements in turbine design, including larger rotor diameters, taller hub heights, digital monitoring systems, and predictive maintenance technologies, are improving energy yields and operational efficiency while lowering lifecycle costs
TRENDS & DISRUPTIONS IMPACTING CUSTOMERS' CUSTOMERS
Increasing investment in renewable energy infrastructure, ambitious decarbonization targets, and growing demand for clean electricity are expected to drive growth in the offshore wind market. Furthermore, supportive government policies, onshore wind auctions, long-term power purchase agreements (PPAs), and favorable regulatory frameworks across major economies are attracting substantial investments into onshore wind projects.
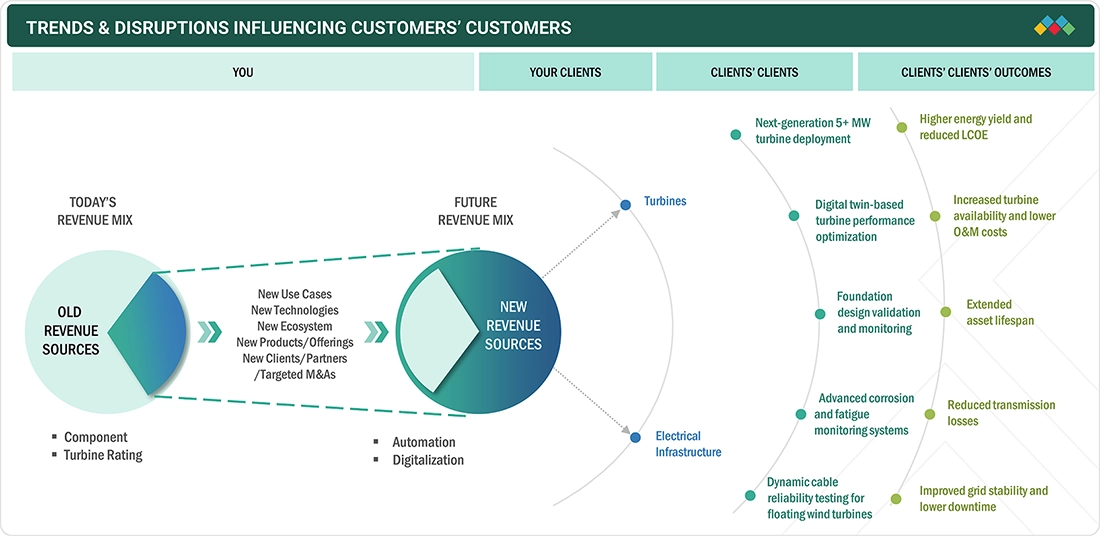
Source: Secondary Research, Interviews with Experts, MarketsandMarkets Analysis
MARKET DYNAMICS

Level
-
Rising Global Renewable Energy Targets Fuel Onshore Wind Deployment

-
Government Incentives and Decarbonization Policies Support Onshore Wind Expansion


Level
-
Grid Integration Constraints Limit Large-Scale Onshore Wind Projects

-
High Capital Expenditure and Project Development Costs


Level
-
Repowering Aging Wind Farms Creates New Revenue Opportunities

-
Digitalization and Advanced Turbine Technologies Enhance Project Performance


Level
-
Transmission Infrastructure Gaps Restrict Onshore Wind Capacity Expansion

Source: Secondary Research, Interviews with Experts, MarketsandMarkets Analysis
Driver: Rising Global Renewable Energy Targets Fuel Onshore Wind Deployment
The accelerating expansion of global renewable energy targets is a key driver for the onshore wind market, as governments, utilities, and private investors seek scalable and cost-effective technologies to decarbonize electricity generation. Alongside solar photovoltaics (PV), onshore wind forms the backbone of renewable capacity additions due to its technological maturity and competitive levelized cost of electricity. According to the International Renewable Energy Agency (IRENA), the world added a record 585 GW of renewable power capacity in 2024, with solar PV contributing approximately 452 GW and wind energy around 113 GW, underscoring the dominant role of these two technologies in the global energy transition. As renewable energy targets become more ambitious and electricity demand continues to rise, developers are increasingly investing in integrated wind–solar portfolios to improve grid reliability and optimize land and transmission assets. The complementary generation profiles of onshore wind and solar PV, combined with advances in energy storage and digital grid management, are expected to accelerate project deployment and create sustained growth opportunities across the global onshore wind value chain.
Restraint: Grid Integration Constraints Limit Large-Scale Onshore Wind Projects
Grid integration challenges remain a significant restraint on the global onshore wind market, limiting the pace at which new capacity can be deployed despite strong policy support and declining generation costs. Many of the world’s best wind resources are located in remote regions where transmission infrastructure is insufficient to transport electricity efficiently to major demand centers. As a result, developers frequently encounter delays in securing grid connections, curtailment risks, and rising project costs. In Germany, congestion between northern wind-producing regions and southern industrial hubs has necessitated costly redispatch measures and highlighted the need for expanded transmission corridors. In the United States, renewable energy projects face lengthy interconnection queues, with grid upgrade requirements delaying commercial operations in several states. India continues to invest in the Green Energy Corridor program, yet transmission bottlenecks in wind-rich states such as Tamil Nadu and Gujarat can hinder the timely integration of projects. Similarly, western and northern China have historically experienced curtailment due to mismatches between renewable generation and transmission capacity, although ongoing ultra-high-voltage network investments are helping address these issues. Without accelerated grid modernization, storage deployment, and cross-regional transmission expansion, integration constraints are expected to remain a key obstacle to sustained growth in the onshore wind market.
Opportunity: Repowering Aging Wind Farms Creates New Revenue Opportunities
Repowering aging onshore wind farms presents a significant growth opportunity for the global onshore wind market by enabling operators to replace older, lower-capacity turbines with modern, high-efficiency models while utilizing existing project sites and grid connections. Many wind farms commissioned in the late 1990s and early 2000s are approaching the end of their design life, making them ideal candidates for upgrades that can substantially increase electricity generation without requiring extensive new land acquisition. Repowering also reduces maintenance costs, improves reliability, and enhances project economics through higher capacity factors and advanced digital control systems. For instance, Germany, one of the world’s earliest adopters of wind energy, has numerous aging installations eligible for repowering under supportive regulatory frameworks. For instance, in June 2026, Vestas secured a 29 MW repowering order in Japan from M Winds Hachiryu Co., Ltd., a group company of Meidensha Corporation, for the Hachiryu Wind Power Station Repowering Project. The contract includes the supply and installation of seven V136-4.2 MW wind turbines along with a 10-year service agreement. Turbine delivery is scheduled for the first quarter of 2028, with project commissioning expected later in 2028, underscoring the continued investment in repowering aging wind assets to improve efficiency and extend operational life. Similarly, Denmark, Spain, and parts of the United States are seeing increased investment to replace legacy turbines with larger units capable of producing significantly more energy. This trend creates new revenue streams for turbine manufacturers, component suppliers, engineering firms, and operations and maintenance service providers while supporting national renewable energy and decarbonization goals.
Challenge: Transmission Infrastructure Gaps Restrict Onshore Wind Capacity Expansion
Insufficient transmission infrastructure remains a major challenge for the global onshore wind market, limiting the efficient integration of new renewable energy capacity into national power grids. Many of the most productive wind resources are located in remote regions, requiring extensive investments in high-voltage transmission lines, substations, and grid reinforcement before electricity can be delivered to demand centers. Delays in transmission planning and permitting often result in project postponements, curtailment of generated power, and reduced investment returns for developers. In rapidly expanding markets, existing grid networks frequently struggle to accommodate the growing share of variable renewable energy, creating congestion and interconnection bottlenecks. Moreover, the pace of transmission expansion often lags behind wind farm development, particularly in emerging economies with limited infrastructure funding. Lengthy regulatory approvals, land acquisition issues, and rising construction costs further compound the challenge. Addressing these infrastructure gaps through coordinated grid modernization, digital management systems, and cross-regional transmission investments will be critical to unlocking the full growth potential of the global onshore wind market.
ONSHORE WIND MARKET: COMMERCIAL USE CASES ACROSS INDUSTRIES
| COMPANY | USE CASE DESCRIPTION | BENEFITS |
|---|---|---|
 |
Whitelee Wind Farm, one of the UK’s largest onshore wind facilities, required modernization to improve energy output and operational efficiency while supporting the country’s renewable energy targets. Aging assets and evolving grid requirements made repowering and digital optimization increasingly important. | Modernization enhanced annual energy production, reduced maintenance-related downtime, extended asset life, and improved overall project economics. It also supported lower lifecycle costs and increased reliability, enabling the wind farm to continue supplying renewable electricity efficiently. |
 |
The 372 MW Björnberget project in Sweden was developed to strengthen renewable electricity generation in the Nordic region while taking advantage of favorable wind resources and modern high-capacity turbine technology | The project achieved higher energy capture, improved operational efficiency, and enhanced reliability, contributing substantial clean electricity to the regional grid while reducing the levelized cost of energy over the project lifetime. |
Logos and trademarks shown above are the property of their respective owners. Their use here is for informational and illustrative purposes only.
MARKET ECOSYSTEM
The offshore wind market ecosystem comprises several key stakeholders, including raw material suppliers, component manufacturers, turbine OEMs, end users/power offtakers, and post-sales service providers.
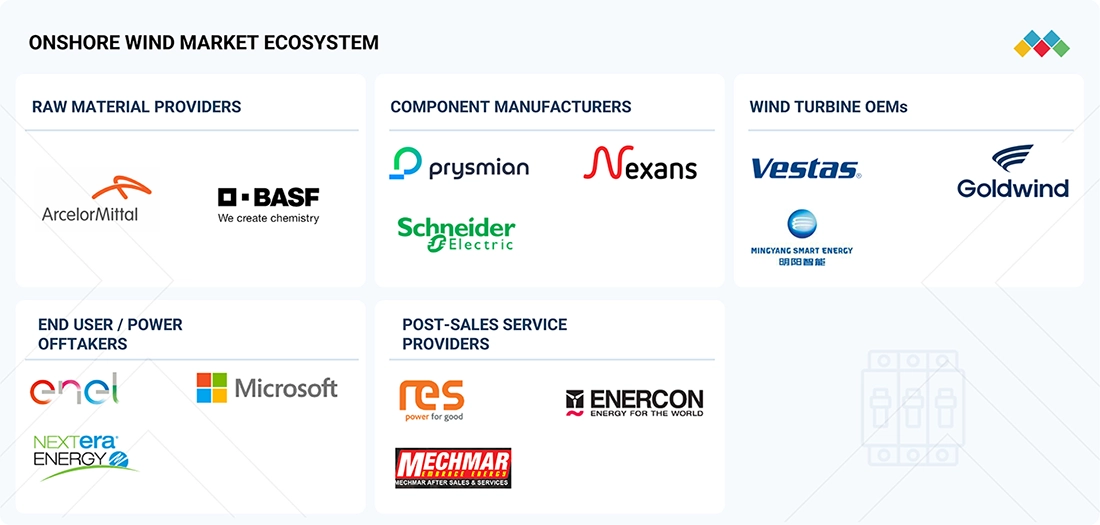
Logos and trademarks shown above are the property of their respective owners. Their use here is for informational and illustrative purposes only.
MARKET SEGMENTS
Source: Secondary Research, Interviews with Experts, MarketsandMarkets Analysis
Offshore wind Market, by Component
By component, the market can be broadly categorized into turbines and electrical infrastructure, both of which play essential roles in ensuring efficient energy production and grid integration. The turbine segment comprises key structural and functional elements such as nacelles, which house the drivetrain and generator; rotor blades, responsible for capturing wind energy; and towers, which provide the necessary height and stability for optimal wind exposure. Complementing these systems, the electrical infrastructure segment includes wires and cables for power transmission, substations for voltage transformation and grid connectivity, and other supporting electrical components that facilitate safe and reliable electricity distribution. Continuous innovation in larger turbine designs, advanced materials, digital monitoring systems, and grid modernization is enhancing operational efficiency and reducing the levelized cost of energy. As countries accelerate decarbonization efforts and expand renewable energy capacity, demand for both turbine components and electrical infrastructure is expected to strengthen, supporting sustained growth in the global onshore wind market
Offshore Wind Market, by Turbine Rating
Based on turbine rating, the onshore wind market is broadly segmented into Up to 2 MW, 2–3 MW, 3–5 MW, and Above 5 MW categories. This segmentation reflects differences in energy generation capability, project economics, site characteristics, grid requirements, and technological advancement across onshore wind installations. The choice of turbine rating significantly influences land utilization, turbine spacing, installation costs, maintenance strategies, and overall project efficiency. Continuous innovations in rotor aerodynamics, blade materials, drivetrain design, digital controls, and predictive maintenance systems are enabling the deployment of more efficient and reliable onshore wind turbines. The Up to 2 MW segment primarily serves distributed generation projects, community wind farms, repowering initiatives, and regions with land or grid constraints. The 2–3 MW segment has been widely adopted in commercial onshore developments due to its proven reliability, balanced capital costs, and suitability for diverse wind conditions. The 3–5 MW segment represents the current mainstream of utility-scale onshore wind deployment, offering improved energy capture, higher operational efficiency, and favorable project economics while reducing the number of turbines required per project. The Above 5 MW segment comprises next-generation onshore turbines incorporating advanced blade designs, taller towers, intelligent control systems, and enhanced power electronics. These turbines are increasingly being deployed in high-resource locations to maximize energy production, optimize land use, and support the growing global transition toward renewable electricity generation.
REGION
Asia Pacific to be largest region in onshore wind market during forecast period
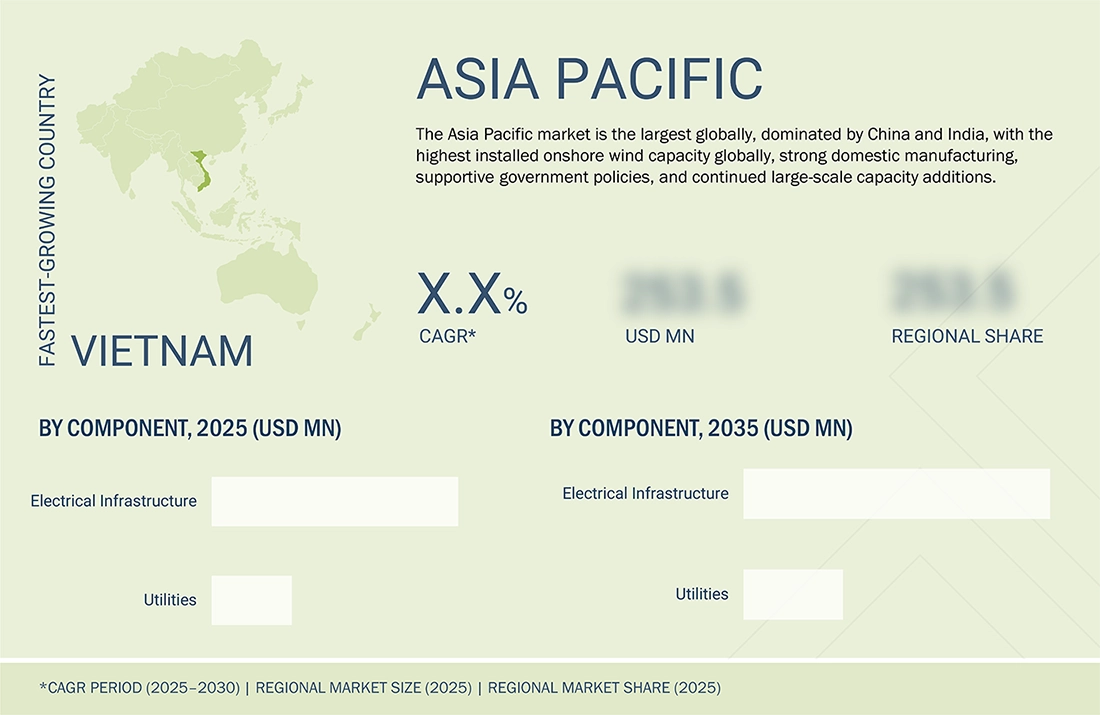
The Asia Pacific is the largest regional market due to substantial onshore wind capacity additions, strong government support, and extensive investments in renewable energy infrastructure across countries such as China, India, Australia, Vietnam, and emerging Asian markets. The region benefits from a robust manufacturing ecosystem for onshore wind turbines, foundations, and other critical components, enabling cost-effective project development and deployment.
ONSHORE WIND MARKET: COMPANY EVALUATION MATRIX
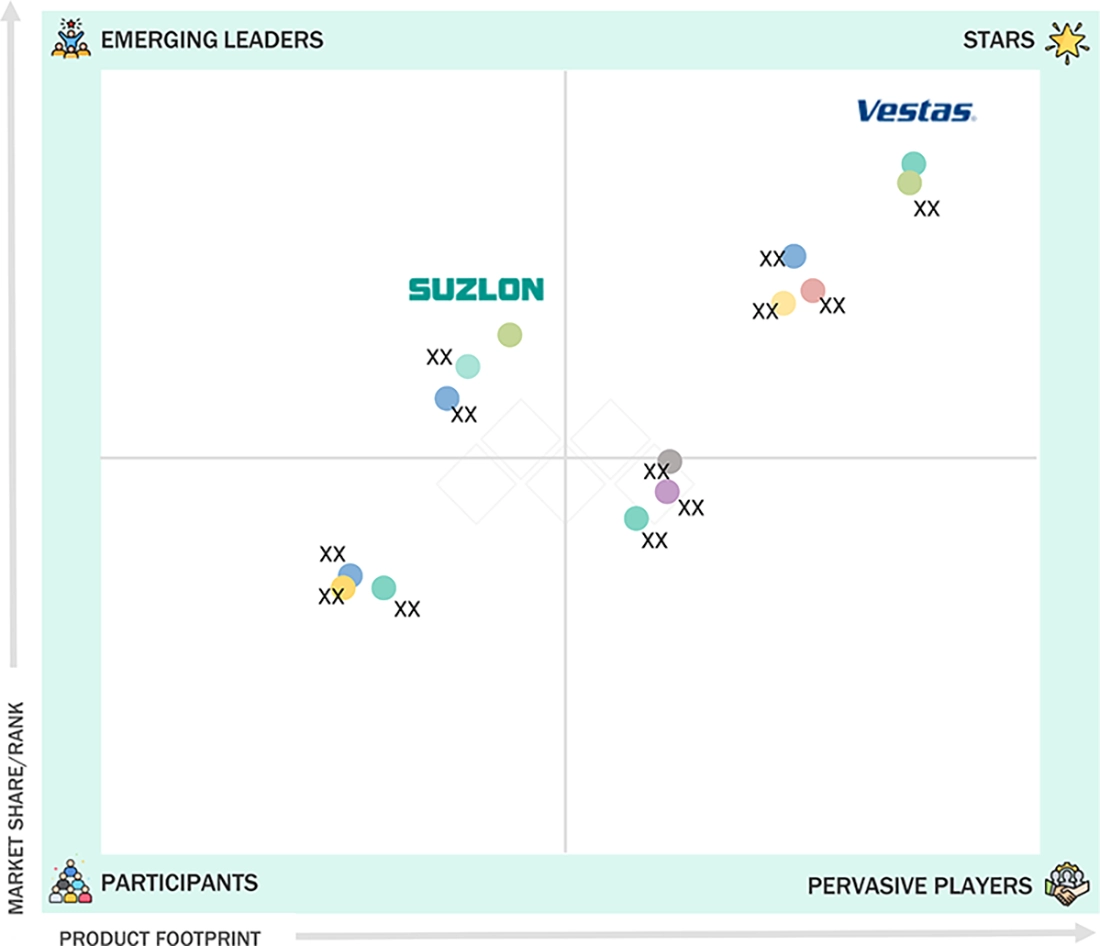
Vestas is widely recognized as a key leader in the onshore wind market, leveraging its extensive capabilities in grid connection technologies, onshore transmission systems, and power conversion solutions. Suzlon is recognized as a leading player in the onshore wind market, holding a strong position through its comprehensive portfolio of electrical infrastructure, grid integration, and digital energy management solutions.
Source: Secondary Research, Interviews with Experts, MarketsandMarkets Analysis
KEY MARKET PLAYERS
- Vestas (Denmark)
- Goldwind Science & Technology Co., Ltd. (China)
- Ming Yang Smart Energy Group Co., Ltd. (China)
- Siemens Energy (Germany)
- GE Vernova (US)
- SANY Renewable Energy Co., Ltd. (China)
- Suzlon Energy Ltd. (India)
- Doosan Enerbility (South Korea)
- Envision Energy (China)
- Windey Energy Technology Group Co., Ltd. (China)
- Nordex SE (Germany)
- Shanghai Electric Wind Power Group (China)
- CRRC Shandong Wind Power (China)
- Hitachi Energy Ltd. (Switzerland)
- Dongfang Electric Wind Power Co. Ltd.
- ABB (Switzerland)
- Prysmian Group (Italy)
- Schneider Electric (France)
- Inox Wind (India)
- Senvion India (India)
- ENERCON Global GmbH (Germany)
- Vayona Energy Pvt. Ltd. (India)
- Sinovel Wind Group Co., Ltd.
- Leitwind
- EWT
MARKET SCOPE
| REPORT METRIC | DETAILS |
|---|---|
| Market Size in 2025 (Value) (Base Year) | USD 122.77 Billion |
| Market Size in 2026 (Value) (Estimated Year) | USD 132.47 Billion |
| Market Forecast in 2035 (Value) (Forecast Year) | USD 321.14 Billion |
| CAGR | CAGR of 10.3% from 2026–2035 |
| Years Considered | 2023–2035 |
| Base Year | 2025 |
| Forecast Period | 2026–2035 |
| Units Considered | USD Million |
| Report Coverage | Revenue forecast, company ranking, competitive landscape, growth factors, and trends |
| Segments Covered |
|
| Regions Covered | North America, Asia Pacific, Europe, South America, Middle East & Africa |
WHAT IS IN IT FOR YOU: ONSHORE WIND MARKET REPORT CONTENT GUIDE
DELIVERED CUSTOMIZATIONS
We have successfully delivered the following deep-dive customizations:
| CLIENT REQUEST | CUSTOMIZATION DELIVERED | VALUE ADDS |
|---|---|---|
| Client requirement for Floating offshore wind report | Market sizing for Floating offshore wind countries | Country-wise market attractiveness analysis, competitive landscape overview, and installation of floating onshore wind systems in high-growth economies |
RECENT DEVELOPMENTS
- March 2026 : Vestas secured a 90 MW onshore wind turbine supply contract in the UK covering 20 V136-4.5 MW turbines and a 15-year Active Output Management (AOM) service agreement, with deliveries planned from 2027.
- April 2025 : BASF and Ming Yang Smart Energy signed a memorandum of understanding to jointly develop advanced materials and technical solutions supporting renewable energy applications, including wind turbine technologies, strengthening innovation and supply-chain cooperation.
- April 2024 : Goldwind acquired General Electric's wind turbine manufacturing facility in Camaçari, Brazil, establishing its first overseas manufacturing base and enhancing localized production capabilities for the Latin American onshore wind market.
- December 2023 : Vestas secured a 1,089 MW order for the SunZia Wind project in New Mexico, its largest-ever single onshore wind project globally. The contract includes 242 V163-4.5 MW turbines, supply, commissioning, and a long-term service agreement.
Table of Contents
 Exclusive indicates content/data unique to MarketsandMarkets and not available with any competitors.
Methodology
The study involved major activities in estimating the current size of the onshore wind market. Exhaustive secondary research was done to collect information on the peer and parent markets. The next step was to validate these findings, assumptions, and sizing with industry experts across the value chain through primary research. Both top-down and bottom-up approaches were employed to estimate the complete market size. Thereafter, market breakdown and data triangulation were used to estimate the market size of the segments and subsegments.
Secondary Research
This research study on the onshore wind market involved the use of extensive secondary sources, directories, and databases, such as D&B Hoovers, Bloomberg, Businessweek, Factiva, International Energy Agency, and BP Statistical Review of World Energy, to identify and collect valuable information for a technical, market-oriented, and commercial study of the global onshore wind market. The other secondary sources included companies' annual reports, press releases, and investor presentations; white papers; certified publications; articles by recognized authors; manufacturer associations; trade directories; and databases.
Primary Research
The onshore wind market comprises stakeholders across the value chain, including onshore wind turbine manufacturers, component suppliers, onshore cable manufacturers, onshore substation providers, EPC contractors, project developers, utilities, transmission system operators, engineering consultants, digital technology providers, and operations & maintenance service providers. On the demand side, the market is driven by the increasing deployment of onshore wind projects across key regions, including Europe, Asia Pacific, and North America, supported by growing investments from utilities, independent power producers (IPPs), governments, and industrial energy consumers seeking large-scale renewable energy solutions. On the supply side, turbine manufacturers, foundation suppliers, electrical infrastructure providers, and onshore service companies are benefiting from increasing project awards, long-term supply agreements, and investments in onshore renewable energy infrastructure. Various primary sources from both the supply and demand sides of the market were interviewed to obtain qualitative and quantitative information. The following is the breakdown of primary respondents:
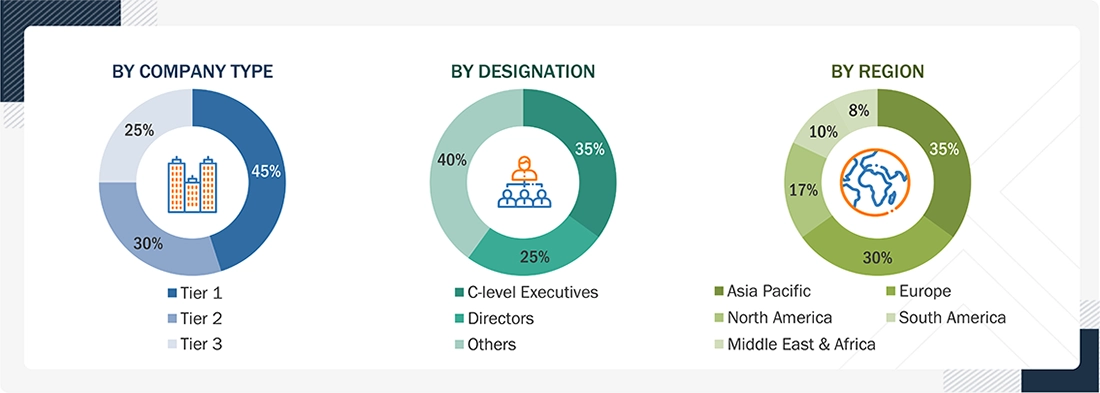
Note: Others include sales managers, engineers, and regional managers.
The tiers of the companies are defined by their total revenue as of 2024: Tier 1: > USD 1 billion; Tier 2: USD 500 million–1 billion; and Tier 3: < USD 500 million.
To know about the assumptions considered for the study, download the pdf brochure
Market Size Estimation
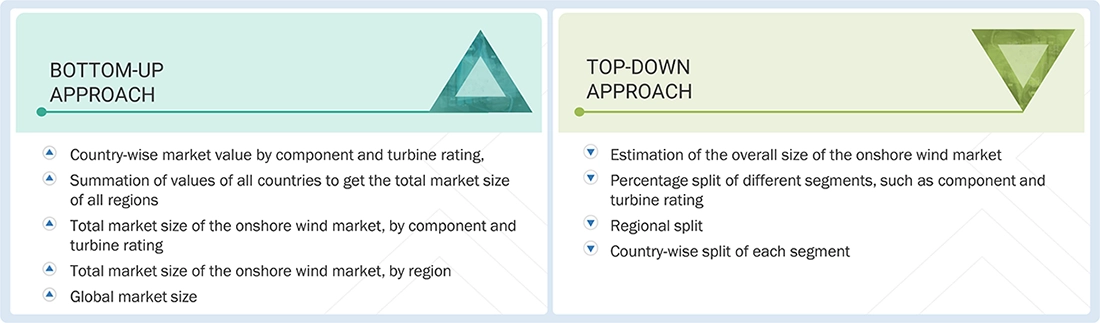
Both top-down and bottom-up approaches were employed to estimate and validate the size of the onshore wind market and its dependent submarkets. The key players in the market were identified through secondary research, and their market share in the respective regions was determined through a combination of primary and secondary research. The research methodology involves analyzing the annual and financial reports of leading market players and conducting interviews with industry experts, including chief executive officers, vice presidents, directors, sales managers, and marketing executives, to gather key quantitative and qualitative insights into the onshore wind market.
Data Triangulation
After determining the overall market size through the estimation process explained above, the total market has been divided into several segments and subsegments. To complete the overall market engineering process and obtain exact statistics for all segments and subsegments, data triangulation and market breakdown have been employed where applicable. The data has been triangulated by studying various factors and trends from both the demand and supply sides. Additionally, the market has been validated using both top-down and bottom-up approaches.
Market Definition
The onshore wind market encompasses the development, manufacturing, and installation of land-based wind energy systems that generate electricity from wind. It includes key components such as wind turbines, nacelles, rotors and blades, towers, and supporting electrical infrastructure, including wires and cables, substations, and related balance-of-plant equipment. The market covers turbine capacity segments ranging from up to 2 MW to above 5 MW and serves utility-scale, commercial, industrial, and government-backed renewable energy projects. Market growth is driven by decarbonization initiatives, favorable regulatory policies, technological advancements in turbine design, declining electricity generation costs, and increasing investments in sustainable and energy-secure power infrastructure.
Key Stakeholders
- Project Developers & Owners
- Turbine Manufacturers
- EPC Contractors & Marine Engineering Firms
- Mooring, Anchoring, & Subsea System Providers
- Electrical Infrastructure & Grid Connection Providers
- Governments & Regulatory Authorities
- Investors & Financial Institutions
- Research Institutions & Certification Bodies
- Energy Associations
- Environmental Associations
- Energy Efficiency Consultants
Report Objectives
- To describe and forecast the onshore wind market, by turbine rating and component, in terms of value
- To describe and forecast the onshore wind market for various segments with respect to five main regions: North America, Europe, Asia Pacific, South America, and Middle East & Africa, along with their country-level analysis, in terms of value
- To provide detailed information regarding the major drivers, restraints, opportunities, and challenges influencing the growth of the onshore wind market
- To analyze market opportunities for stakeholders and provide a detailed competitive landscape for market leaders
- To strategically analyze micromarkets about individual growth trends, prospects, and contributions to the total market
- To strategically profile the key players and comprehensively analyze their market shares and core competencies
- To provide a detailed overview of the unmet needs and white spaces, interconnected markets and cross-sector opportunities, strategic moves by tier-1/2/3 players, onshore wind market value chain analysis, ecosystem analysis, key conferences and events, key stakeholders and buying criteria, patent analysis, trends/disruptions impacting customer business, trade analysis, tariff analysis, investment and funding scenario, technology analysis, technology/product roadmap, case study analysis, regulations, future applications, macroeconomic outlook, pricing analysis, Porter’s five forces analysis, sustainability initiatives, adoption barriers and internal challenges, market profitability, impact of regulatory policies on sustainability initiatives, certifications, labeling and eco-standards, decision making process, impact of gen AI, and the 2024 US tariff impact
- To analyze competitive developments, such as agreements, product launches, expansions, contracts, investments, partnerships, collaborations, announcements, and acquisitions in the market
Available customizations:
MarketsandMarkets offers customizations tailored to the specific needs of companies using the given market data.
The following customization options are available for the report:
Product Analysis
- Product matrix, which gives a detailed comparison of the product portfolio of each company
Regional Analysis
- Further breakdown of the onshore wind systems, by country
Company Information
- Detailed analysis and profiling of additional market players (up to five)
Key Questions Addressed by the Report
What is the current market size of the Onshore Wind Market, and how is it expected to grow?
The market is projected to grow from USD 132.47 billion in 2026 to USD 321.14 billion by 2035, at a CAGR of 10.3%.
What are the key factors driving the Onshore Wind Market?
Growth is driven by rising electricity demand, supportive renewable energy policies, larger and more efficient turbines, and increasing investments in grid infrastructure.
Which segment holds the largest share of the Onshore Wind Market?
The 3–5 MW turbine rating segment holds the largest market share due to its balance of efficiency, cost, and suitability for utility-scale projects. (PR Newswire)
Which region dominates the Onshore Wind Market?
Asia Pacific dominates the market, accounting for 71.0% of the global market in 2025, driven by strong renewable energy investments and manufacturing capabilities.
Who are the key players in the Onshore Wind Market?
Leading companies include Vestas, Mingyang Smart Energy Group Co., Ltd., Goldwind, Siemens Energy, and GE Vernova.


Personalize This Research
- Triangulate with your Own Data
- Get Data as per your Format and Definition
- Gain a Deeper Dive on a Specific Application, Geography, Customer or Competitor
- Any level of Personalization
Let Us Help You
- What are the Known and Unknown Adjacencies Impacting the Onshore Wind Market
- What will your New Revenue Sources be?
- Who will be your Top Customer; what will make them switch?
- Defend your Market Share or Win Competitors
- Get a Scorecard for Target Partners

Custom Market Research Services
We Will Customise The Research For You, In Case The Report Listed Above Does Not Meet With Your Requirements
Get 10% Free CustomisationTESTIMONIALS

Kimberly Murphy
GLOBAL MARKETING DIRECTOR
Bently Nevada,
Leading Condition Monitoring & Asset Protectionwww.bakerhughesds.com/bently-nevada

MarketsandMarkets™ showed consistent rigor for success and relentlessly worked with Bently Nevada stakeholders to positively impact go-to-market strategy. Their proactiveness and flexibility has been instrumental in achieving the objectives to grow our sales pipeline in key industrial markets.

DARRICK HUEBER
Business Development Leader
Nexus Controls LLC,
Leading Manufacturer of Automation System & Electrical Panelswww.bakerhughesds.com/nexus-controls

We partnered with MarketsandMarkets to expand our business further by tapping into new industrial segments. It was critical for us to gather crucial business insights about specific markets to achieve this goal. MarketsandMarkets engagement model and client services helped us provide those insights, it was really impressive and valuable for my business. The team was extremely flexible and helpful.

Mike Schoff
Global Industrial Commercial Strategy Leader
Nexus Controls LLC
Leading Manufacturer of Automation System & Electrical Panelswww.bakerhughesds.com/nexus-controls
We consulted MarketsandMarkets for potential Partner Identification. Overall, it was a good experience. The insights provided through interviews conducted by the team helped us put together the questionnaire required for discussion with the selected partners. Their ability to provide insights through interviews with customers in a timely manner was quite impressive.
- China Onshore Wind Market
- India Onshore Wind Market
- Australia Onshore Wind Market
- Vietnam Onshore Wind Market
- Canada Onshore Wind Market
- US Onshore Wind Market
- Germany Onshore Wind Market
- UK Onshore Wind Market
- Spain Onshore Wind Market
- France Onshore Wind Market
- Italy Onshore Wind Market
- Sweden Onshore Wind Market
- Saudi Arabia Onshore Wind Market
- South Africa Onshore Wind Market
- Brazil Onshore Wind Market
- Rest Of Europe Onshore Wind Market
- Rest Of Asia Pacific Onshore Wind Market
- Rest Of South America Onshore Wind Market






Growth opportunities and latent adjacency in Onshore Wind Market