
Asia Pacific Process Analytical Technology Market (2026-2031)

The Asia Pacific Process Analytical Technology Market was valued at $1549.9 Million in 2026 and projected to reach to $3290.9 Million by 2031, representing a compound annual growth rate of CAGR 16.3%. The Asia Pacific Process Analytical Technology Market is poised for exceptional growth, expanding from USD 1,549.9 million in 2026 to USD 3,290.9 million by 2031.


| Market Size in | USD 26.32 MN |
| Market Forecast in | |
| CAGR | |
| Forecast Period | |
| Units Considered | Value (USD MN) |
Asia Pacific Process Analytical Technology Market Trends and Insights
- Asia Pacific's market growth significantly outpaces global trends, driven by rapid pharmaceutical manufacturing expansion, stringent regulatory compliance requirements, and increasing adoption of real-time quality monitoring across the region.
- The region's healthcare sector modernization and investment in advanced manufacturing infrastructure are accelerating demand for process analytical solutions. Asia Pacific's 16.3% CAGR reflects strong momentum in biopharmaceutical production, contract manufacturing organizations (CMOs), and quality assurance initiatives across major markets including China, India, Japan, and South Korea.
- The forecast period through 2031 demonstrates Asia Pacific's strategic importance as a global manufacturing hub, with companies prioritizing digital transformation and Industry 4.0 integration.
- Regulatory harmonization efforts and rising healthcare spending further support sustained market growth throughout the region..
Key Market Statistics
- CAGR (2026-2031) CAGR 16.3%
- Market Size, 2026 ~USD 1549.9 Million
- Forecast, 2031 ~USD 3290.9 Million
- Geography Asia Pacific
Asia Pacific Process Analytical Technology Market Overview
Fastest Growing Region Globally :
Asia Pacific's Process Analytical Technology Market is expanding at 16.3% CAGR, significantly outpacing the global growth rate of 14.7%, driven by accelerating pharmaceutical manufacturing and biotech investments across the region.
Regulatory Compliance Acceleration :
Stringent regulatory requirements from health authorities in China, India, and Japan are compelling manufacturers to adopt real-time quality monitoring and PAT solutions to ensure product safety and compliance standards.
Pharmaceutical Manufacturing Boom :
Rapid expansion of pharmaceutical manufacturing capacity in Asia Pacific, particularly in China and India, is creating substantial demand for advanced analytical technologies to optimize production efficiency and reduce time-to-market.
Real-Time Quality Monitoring Adoption :
Increasing adoption of real-time quality monitoring systems across Asia Pacific facilities is transforming manufacturing processes, enabling predictive maintenance, reducing batch failures, and improving overall operational excellence.
Asia Pacific Process Analytical Technology Market Dynamics
- This robust trajectory reflects the region's emergence as a global pharmaceutical manufacturing hub, with countries like China and India investing heavily in modernizing production facilities and implementing advanced quality control systems.
- Regulatory pressures from local health authorities are compelling manufacturers to adopt PAT solutions for real-time monitoring and compliance assurance. Key growth drivers include increasing pharmaceutical R&D investments, rising demand for biologics and specialty drugs, and the region's competitive manufacturing advantages.
- The adoption of Industry 4.0 technologies and digital transformation initiatives across Asia Pacific pharmaceutical facilities will further accelerate PAT market penetration.
- Strategic partnerships between technology providers and regional manufacturers, combined with government support for pharmaceutical sector development, will sustain this high-growth momentum through 2031..
Market Ecosystem

PROCESS ANALYTICAL TECHNOLOGY MARKET: COMMERCIAL USE CASES ACROSS INDUSTRIES
| COMPANY | USE CASE DESCRIPTION | BENEFITS |
|---|---|---|
 |
Provides mass spectrometry, chromatography, spectroscopy, and PAT software solutions for real-time process monitoring, quality control, and process optimization in pharmaceutical and biopharmaceutical manufacturing | Enables real-time process monitoring, improves product quality and consistency, reduces batch failures, supports Quality by Design (QbD), and facilitates regulatory compliance |
 |
Offers chromatography, spectroscopy, molecular analysis, and laboratory informatics solutions for process monitoring, method development, continuous manufacturing, and PAT implementation | Improves analytical accuracy, enhances manufacturing efficiency, accelerates method development, enables data-driven process control, and supports regulatory compliance |
 |
Provides analytical instruments, bioprocess monitoring systems, and PAT solutions for monitoring critical process parameters and quality attributes throughout biologics manufacturing | Improves upstream and downstream process control, increases manufacturing productivity, reduces process variability, enhances product quality, and supports continuous bioprocessing |
 |
Delivers chromatography, mass spectrometry, and PAT software solutions for real-time process analytics, quality assurance, and pharmaceutical manufacturing workflows | Enables rapid process optimization, improves analytical precision, supports real-time release testing (RTRT), minimizes production deviations, and ensures regulatory compliance |
 |
Offers treatment planning and image-guided radiotherapy software. | Enhances workflow efficiency and treatment accuracy. |
Logos and trademarks shown above are the property of their respective owners. Their use here is for informational and illustrative purposes only.
Related Ecosystem
Analytical And Scientific Instrumentation
- Environmental Testing
- Gas Chromatography
- Polymerase Chain Reaction (PCR)
- Automated Liquid Handling Systems
- Flow Cytometry
- Thermo Fisher Scientific Inc.
- Danaher Corporation
- Agilent Technologies, Inc.
- Merck KGaA
- Shimadzu Corporation
Key Takeaways
- Asia Pacific Process Analytical Technology Market will more than double from USD 1,549.9M (2026) to USD 3,290.9M (2031), representing a 16.3% CAGR.
- Asia Pacific's growth rate outpaces the global average, positioning the region as the fastest-growing market for process analytical solutions in healthcare.
- Pharmaceutical manufacturing expansion and regulatory compliance drivers are fueling Asia Pacific adoption of real-time quality monitoring technologies.
- Asia Pacific's emergence as a global manufacturing hub accelerates digital transformation and Industry 4.0 integration through 2031.
Process Analytical Technology Market Report Scope
| Report Metric | Details |
|---|---|
| Base Year | 2026 |
| Fastest Growing Segment | IN-LINE MEASUREMENT (Measurement) |
| Forecast Period | 2026-2031 |
| Growth Rate | CAGR of 14.7% from 2026 to 2031 |
| Largest Segment | PRODUCT (Product & Service) |
| Market Size Base Year (Billions) | ~USD 5.79 (2026) |
| Revenue Forecast (Billions) | ~USD 11.49 (2031) |
| Segments Covered | Technology, Type, Product & Service, Product Type, Measurement, Application |
Asia Pacific Process Analytical Technology Market Report Segmentation
6 segment dimensions are covered across the global market.
By Technology
- Capillary Electrophoresis
- Chromatography
- Other Technologies
- Particle Size Analysis
- Spectroscopy
By Type
- Atomic Spectroscopy
- Drug Discovery & Development
- Gas Chromatography
- Ir Spectroscopy
- Liquid Chromatography
- Manufacturing Qc/Qa
- Mass Spectrometry
- Molecular Spectroscopy
- Other Chromatography Technologies
- Other Molecular Spectroscopy
- Raman Spectroscopy
By Product & Service
- Product
- Service
By Product Type
- Analyzers
- Samplers
- Sensors & Probes
By Measurement
- At-Line Measurement
- In-Line Measurement
- Off-Line Measurement
- On-Line Measurement
By Application
- Large Molecules
- Manufacturing Applications
- Other Applications
- Small Molecules
Target Audience
- Pharmaceutical Manufacturers : Asia Pacific-based and multinational pharmaceutical companies need this data to optimize manufacturing operations, ensure regulatory compliance, and make informed capital investments in PAT infrastructure and quality systems.
- PAT Solution Providers : Technology vendors and analytical equipment manufacturers require detailed Asia Pacific market intelligence to identify high-growth segments, prioritize regional expansion, and develop localized product offerings for diverse regulatory environments.
- Biotech & Contract Manufacturers : Emerging biotech firms and contract manufacturing organizations (CMOs) in Asia Pacific need market insights to benchmark capabilities, understand competitive positioning, and justify investments in advanced analytical technologies.
- Investment & Strategy Consultants : Private equity firms, management consultants, and corporate strategists require Asia Pacific market data to evaluate investment opportunities, assess market attractiveness, and develop go-to-market strategies for pharmaceutical sector clients.
- Regulatory & Quality Professionals : Quality assurance, regulatory affairs, and compliance teams need region-specific insights to understand evolving PAT requirements, benchmark best practices, and implement compliant analytical systems across Asia Pacific operations.
Countries within Asia Pacific - compare and drill down
| Country | 2025 size (native) |
|---|---|
| China | USD 1182.7 Million |
| India | USD 674.6 Million |
| Japan | USD 1063 Million |
| Australia | USD 160 Million |
| South Korea | USD 134.1 Million |
| Rest Of Asia Pacific | USD 76.5 Million |
Country market size visualization
Reasons to Buy this Report
- Regional Market Sizing & Forecasts : Obtain precise market valuations for Asia Pacific and individual country-level data (China, India, Japan, Australia, South Korea) with detailed 2026-2031 projections to support strategic planning and investment decisions.
- Competitive Landscape Analysis : Understand key players, market share distribution, and competitive strategies specific to Asia Pacific, enabling you to identify partnership opportunities and benchmark against regional competitors.
- Regulatory & Compliance Insights : Gain deep understanding of regulatory requirements across Asia Pacific markets, including China's NMPA, India's CDSCO, and Japan's PMDA, to ensure compliant product development and market entry strategies.
- Growth Driver Identification : Identify and quantify specific growth catalysts in Asia Pacific including pharmaceutical manufacturing expansion, biologics adoption, and digital transformation initiatives to prioritize market opportunities.
- Country-Specific Market Dynamics : Access differentiated insights into individual Asia Pacific markets, recognizing unique manufacturing ecosystems, regulatory environments, and technology adoption rates across China, India, Japan, and other key nations.
Frequently asked questions
What is the projected market size for Process Analytical Technology in Asia Pacific by 2031?
Asia Pacific's Process Analytical Technology Market is projected to reach USD 3,290.9 million by 2031, more than doubling from the 2026 valuation of USD 1,549.9 million.
What is the CAGR for Asia Pacific Process Analytical Technology Market?
Asia Pacific's Process Analytical Technology Market is expected to grow at a compound annual growth rate (CAGR) of 16.3% from 2026 to 2031.
Which countries are driving growth in Asia Pacific's Process Analytical Technology Market?
Major markets including China, India, Japan, and South Korea are driving Asia Pacific's Process Analytical Technology growth through pharmaceutical manufacturing expansion and regulatory compliance initiatives.
Why is Asia Pacific's growth rate higher than the global average?
Asia Pacific's 16.3% CAGR exceeds the global 14.7% average due to rapid biopharmaceutical production expansion, CMO growth, and strategic positioning as a global manufacturing hub with increasing regulatory harmonization.
What factors are accelerating Process Analytical Technology adoption in Asia Pacific?
Key drivers include pharmaceutical manufacturing modernization, stringent regulatory compliance requirements, real-time quality monitoring adoption, digital transformation initiatives, and Industry 4.0 integration across the region.
RESEARCH METHODOLOGY
This study involved the extensive use of both primary and secondary sources. The research process examined various factors affecting the industry to identify segmentation types, industry trends, key players, the competitive landscape, key market dynamics, and key player strategies.
Secondary Research
The secondary research process involves the widespread use of secondary sources, directories, databases (such as Bloomberg Businessweek, Factiva, and D&B Hoovers), white papers, annual reports, Companies House documents, investor presentations, and SEC filings. Secondary research was used to identify and collect information useful for the extensive, technical, market-oriented, and commercial study of the process analytical technology market. It was also used to obtain important information about key players and market classification & segmentation according to industry trends, down to the bottom-most level, as well as key developments related to market and technology perspectives. A database of the key industry leaders was also prepared using secondary research.
Primary Research
In the primary research process, various sources from both the supply and demand sides were interviewed to obtain qualitative and quantitative information for this report. The primary sources from the supply side include industry experts such as CEOs, vice presidents, marketing and sales directors, technology & innovation directors, and related key executives from various key companies and organizations in the process analytical technology market. The primary sources from the demand side include pharmaceutical and biopharmaceutical manufacturer companies, research organizations, academic institutes, and process analytical service-providing companies, among others. Primary research was conducted to validate the market segmentation, identify key players in the market, and gather insights on key industry trends & key market dynamics.
The following is a breakdown of the primary respondents:
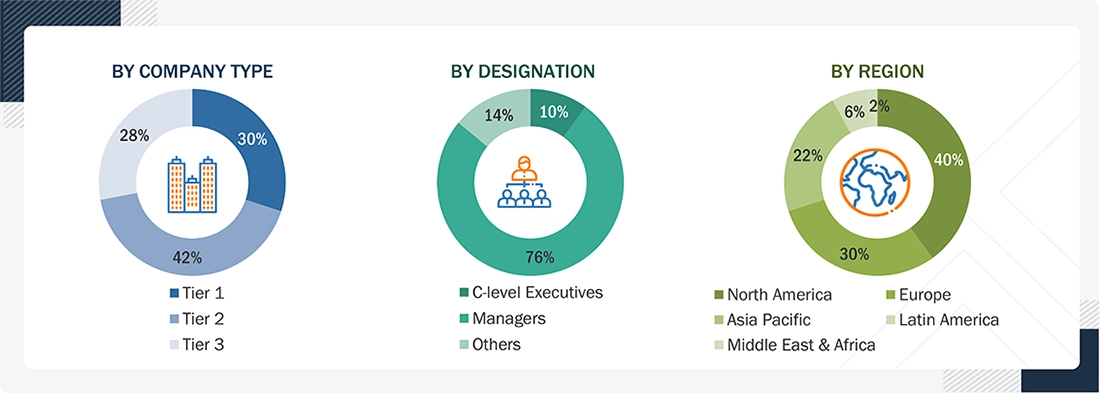
*C-level primaries include CEOs, CFOs, COOs, and VPs.
**Others include sales managers, marketing managers, business development managers, product managers, distributors, and suppliers.
Note: Companies are classified into tiers based on their total revenue. As of 2021: Tier 1 = >USD 10 billion, Tier 2 = USD 10 billion to USD 1 billion, and Tier 3 = <USD 1 billion
To know about the assumptions considered for the study, download the pdf brochure
Market Size Estimation
In this report, the global process analytical technology market's size was determined using the revenue share analysis of leading players. For this purpose, key players in the market were identified, and their revenues from the PAT business were determined through various insights gathered during the primary and secondary research phases. Secondary research included the study of the annual and financial reports of the top market players. In contrast, primary research included extensive interviews with key opinion leaders, such as CEOs, directors, and marketing executives.
To calculate the global market value, segmental revenues were calculated based on the revenue mapping of major solution/service providers. This process involved the following steps:
- A list of major players operating in the process analytical technology market at the regional/country level
- Product mapping of various manufacturers for each type of process analytical technology product at the regional/country level
- Mapping of annual revenue generated by listed major players from PAT product segments (or the nearest reported business unit/product category)
- Revenue mapping of major players to cover at least 60% of the global market share as of 2021
- Extrapolation of the revenue mapping of the listed major players to derive the global market value of the respective segments/subsegments
- Summation of the market value of all segments/subsegments to arrive at the global process analytical technology market
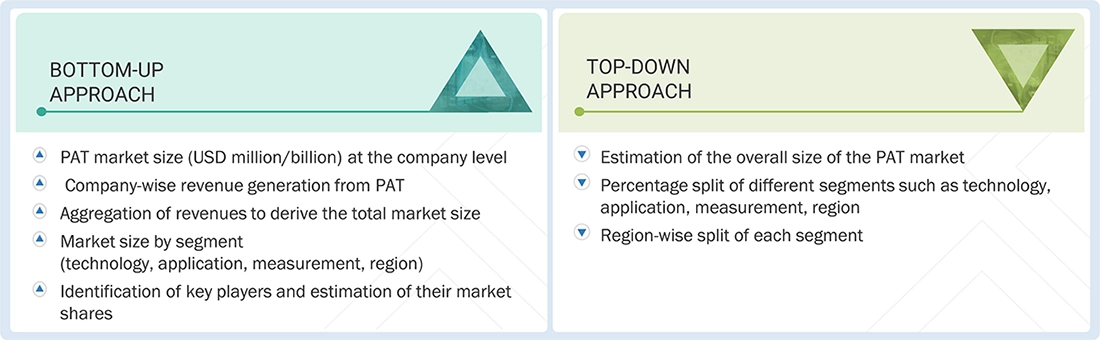
Process Analytical Technology Market : Top-Down and Bottom-Up Approach
Data Triangulation
After arriving at the overall market size from the market size estimation process explained above, the global process analytical technology market was split into segments and subsegments. Data triangulation and market breakdown procedures were employed to complete the overall market engineering process and arrive at the exact statistics for all segments and subsegments. The data was triangulated by studying various factors and trends from both the demand and supply sides. Additionally, the process analytical technology market was validated using both top-down and bottom-up approaches.
Key Stakeholders
- Pharmaceutical Manufacturers
- Biopharmaceutical Companies
- Contract Development and Manufacturing Organizations
- Contract Research Organizations
- Analytical Instrument Manufacturers
- PAT Software Providers
- Industrial Automation Providers
- Biotechnology Companies
- Academic & Research Institute
- Regulatory Authorities (FDA, EMA, etc.)
Report Objectives
- To define, describe, and forecast the process analytical technology (PAT) market based on technology, application, measurement, product & service, and region
- To provide detailed information regarding the major factors influencing the growth potential of the global process analytical technology market (drivers, restraints, opportunities, challenges, and trends)
- To analyze the micromarkets with respect to individual growth trends, prospects, and contributions to the global process analytical technology market
- To analyze key growth opportunities in the global process analytical technology market for key stakeholders and provide details of the competitive landscape for market leaders
- To forecast the size of market segments and/or subsegments with respect to five major regions, namely, North America (US and Canada), Europe (Germany, France, the UK, Italy, Spain, and the RoE), Asia Pacific (Japan, China, India, and the RoAPAC), Latin America (Brazil, Mexico, and RoLATAM), and the Middle East & Africa
- To profile the key players in the global process analytical technology market and comprehensively analyze their market shares and core competencies
- To track and analyze the competitive developments undertaken in the global process analytical technology market, such as product launches; agreements; expansions; and mergers & acquisitions
Available customizations:
With the given market data, MarketsandMarkets offers customizations as per the company’s specific needs. The following customization options are available for the present global process analytical technology market report:
Product Analysis
- Product matrix, which gives a detailed comparison of the product portfolios of the top five companies
Company Information
- Detailed analysis and profiling of additional market players (up to 5)
Geographic Analysis
-
Further breakdown of the Rest of Europe process analytical technology market into Belgium, Austria, the Czech Republic, Denmark, Greece, Poland, and Russia, among others
-
Further breakdown of the Rest of Asia Pacific process analytical technology market into New Zealand, Vietnam, the Philippines, Singapore, Malaysia, Thailand, and Indonesia, among others
-
Further breakdown of the Latin American process analytical technology market into Argentina, Chile, Peru, and Colombia, among others
Get the Full Process Analytical Technology Market Report
Full forecast, segment splits, and company analysis for all Process Analytical Technology Market.
- US Process Analytical Technology Market
- Canada Process Analytical Technology Market
- UK Process Analytical Technology Market
- Germany Process Analytical Technology Market
- France Process Analytical Technology Market
- Italy Process Analytical Technology Market
- Spain Process Analytical Technology Market
- Japan Process Analytical Technology Market
- China Process Analytical Technology Market
- India Process Analytical Technology Market
- Australia Process Analytical Technology Market
- South Korea Process Analytical Technology Market
- Brazil Process Analytical Technology Market
- Mexico Process Analytical Technology Market
- Rest Of Europe Process Analytical Technology Market
- Rest Of Asia Pacific Process Analytical Technology Market
- Rest Of Latin America Process Analytical Technology Market
- GCC Countries Process Analytical Technology Market
Need a Tailored Report?
Customize this report to your needs
Get 10% FREE Customization
Customize This Report
