
Indonesia Produced Water Treatment Market (2024-2029)

The Indonesia Produced Water Treatment Market was valued at $60.3 Million in 2024 and projected to reach to $75.5 Million by 2029, representing a compound annual growth rate of 4.6%. Indonesia's produced water treatment market is positioned for steady growth driven by the nation's continued reliance on oil and gas production as a primary revenue source.


| Market Size in | USD 26.32 MN |
| Market Forecast in | |
| CAGR | |
| Forecast Period | |
| Units Considered | Value (USD MN) |
Indonesia Produced Water Treatment Market Trends and Insights
- This growth reflects Indonesia's significant oil and gas production activities, which generate substantial volumes of produced water requiring treatment and disposal.
- Indonesia's energy sector relies heavily on effective water management solutions to meet environmental regulations and operational efficiency standards. The produced water treatment market in Indonesia is driven by increasing regulatory pressure, aging offshore and onshore infrastructure, and the need for sustainable water management practices.
- Indonesia's position as a major hydrocarbon producer necessitates advanced treatment technologies to handle complex produced water streams.
- Between 2024 and 2029, Indonesia's market expansion will be supported by investments in treatment infrastructure, technological innovation, and stricter environmental compliance requirements across the nation's oil and gas operations..
Key Market Statistics
- CAGR (2024-2029) 4.6% CAGR
- Market Size, 2024 ~USD 60.3 Million
- Forecast, 2029 ~USD 75.5 Million
- Country Indonesia
Indonesia Produced Water Treatment Market Overview
Market Valuation :
Indonesia's produced water treatment market is valued at $60.3 million in 2024, with projections reaching $75.5 million by 2029, representing a steady 4.6% CAGR.
Oil & Gas Production Driver :
Indonesia's substantial offshore and onshore oil and gas operations generate significant volumes of produced water, creating consistent demand for advanced treatment and disposal solutions.
Regulatory Compliance Pressure :
Stricter environmental regulations and sustainability mandates from Indonesian authorities are driving investments in efficient produced water treatment technologies across the energy sector.
Growth Trajectory :
With a 4.6% CAGR slightly below the global average of 4.7%, Indonesia's market reflects stable growth aligned with regional energy production trends and infrastructure development.
Indonesia Produced Water Treatment Market Dynamics
- The country's extensive offshore and onshore operations necessitate robust treatment infrastructure to manage environmental compliance and operational efficiency.
- Increasing pressure from both domestic regulations and international environmental standards is accelerating adoption of advanced treatment technologies. The forecast period through 2029 will likely see increased investment in treatment capacity, particularly in remote production areas.
- Growing awareness of water reuse and recycling opportunities, combined with stricter discharge standards, will drive demand for innovative solutions.
- Strategic partnerships between international technology providers and local operators are expected to enhance market penetration and technological advancement across Indonesia's energy sector..
Market Ecosystem
Related Ecosystem
Energy Circularity
- Epoxy Resin
- Progressive Cavity Pumps
- Amphoteric
- Bisphenol-A
- Cartridge Filters
- TotalEnergies SE
- ENEOS Holdings, Inc.
- Hess Corporation
- Baker Hughes Company
- Weatherford International plc
Key Takeaways
- Indonesia's produced water treatment market is valued at $60.3 million in 2024 and will reach $75.5 million by 2029, growing at 4.6% CAGR.
- Indonesia's oil and gas sector generates significant produced water volumes, driving demand for advanced treatment and disposal solutions.
- Regulatory compliance and environmental sustainability initiatives are key growth drivers for Indonesia's produced water treatment market.
- Indonesia's aging infrastructure and technological upgrades will support market expansion through 2029.
Produced Water Treatment Market Report Scope
| Report Metric | Details |
|---|---|
| Base Year | 2024 |
| Fastest Growing Segment | TERTIARY (Treatment) |
| Forecast Period | 2024-2029 |
| Growth Rate | CAGR of 4.7% from 2024 to 2029 |
| Largest Segment | CONVENTIONAL (Source) |
| Market Size Base Year (Billions) | ~USD 10.65 (2024) |
| Revenue Forecast (Billions) | ~USD 13.4 (2029) |
| Segments Covered | Treatment, Source, Application |
Indonesia Produced Water Treatment Market Report Segmentation
3 segment dimensions are covered across the global market.
By Treatment
- Other Treatments
- Primary
- Secondary
- Tertiary
By Source
- Conventional
- Unconventional
By Application
- Offshore
- Onshore
INDONESIA: PRODUCED WATER TREATMENT MARKET, BY APPLICATION, 2024–2029
| Segment | 2024 | 2025 | 2026 | 2027 | 2028 | 2029 | CAGR (%) |
|---|---|---|---|---|---|---|---|
| OFFSHORE | 18 | 19.1 | 20.2 | 21.4 | 22.5 | 23.8 | 5.7 |
| ONSHORE | 42.2 | 44.1 | 45.9 | 47.8 | 49.7 | 51.7 | 4.1 |
| TOTAL | 60.3 | 63.2 | 66.2 | 69.2 | 72.2 | 75.5 | 4.6 |
Target Audience
- Oil & Gas Operators : Indonesian and international energy companies operating in Indonesia need market data to optimize produced water treatment investments, ensure regulatory compliance, and improve operational efficiency.
- Water Treatment Technology Providers : Equipment manufacturers and solution providers require Indonesia-specific market intelligence to identify growth opportunities, understand local demand drivers, and develop targeted market entry strategies.
- Environmental Consultants : Consulting firms advising Indonesian energy companies need detailed market insights to recommend appropriate treatment technologies, assess regulatory compliance gaps, and guide sustainability initiatives.
- Investment & Financial Analysts : Investors evaluating opportunities in Indonesia's energy sector require accurate market forecasts and growth projections to assess investment viability and portfolio allocation decisions.
- Government & Regulatory Bodies : Indonesian environmental and energy regulatory agencies need market data to inform policy development, set compliance standards, and monitor industry adoption of advanced treatment technologies.
Reasons to Buy this Report
- Indonesia-Specific Market Sizing : Access precise valuation data for Indonesia's produced water treatment market with detailed 2024-2029 forecasts, enabling accurate budget allocation and investment planning for regional operations.
- Competitive Landscape Intelligence : Understand Indonesia's unique market dynamics, local competitor positioning, and technology adoption patterns specific to the country's oil and gas infrastructure and regulatory environment.
- Regulatory & Compliance Insights : Gain clarity on Indonesia's environmental regulations, discharge standards, and compliance requirements driving treatment technology adoption and creating market opportunities for solution providers.
- Growth Opportunity Identification : Identify high-potential segments within Indonesia's market, including offshore operations, remote production areas, and emerging water reuse initiatives aligned with sustainability trends.
- Strategic Decision Support : Make informed decisions on market entry, partnership development, and technology investment in Indonesia with country-specific insights on production volumes, operator needs, and growth catalysts.
Frequently asked questions
What is the current size of Indonesia's produced water treatment market?
Indonesia's produced water treatment market is valued at $60.3 million in 2024.
What is the projected market size for Indonesia's produced water treatment sector by 2029?
Indonesia's produced water treatment market is forecast to reach $75.5 million by 2029.
What is the growth rate of Indonesia's produced water treatment market?
Indonesia's produced water treatment market is expected to grow at a compound annual growth rate of 4.6% from 2024 to 2029.
What factors are driving growth in Indonesia's produced water treatment market?
Key drivers include Indonesia's significant oil and gas production, increasing regulatory requirements, aging infrastructure, and the need for sustainable water management practices.
Why is produced water treatment important for Indonesia's energy sector?
Produced water treatment is critical for Indonesia to manage environmental compliance, protect water resources, and ensure operational efficiency in oil and gas production.
RESEARCH METHODOLOGY
The study involved major activities in estimating the current size of the produced water treatment market. Exhaustive secondary research was done to collect information on the peer and parent markets. The next step was to validate these findings, assumptions, and sizing with industry experts across the value chain through primary research. Both top-down and bottom-up approaches were employed to estimate the complete market size. Thereafter, market breakdown and data triangulation were used to estimate the market size of the segments and subsegments.
Secondary Research
This research study on the produced water treatment market involved the use of extensive secondary sources, directories, and databases, such as Hoovers, Bloomberg, Businessweek, Factiva, International Energy Agency, and United States Energy Association, to identify and collect information useful for a technical, market-oriented, and commercial study of the global market. The other secondary sources included annual reports of the companies involved in the market, press releases & investor presentations of companies, white papers, certified publications, articles by recognized authors, manufacturer associations, trade directories, and databases.
Primary Research
The produced water treatment market comprises several stakeholders such as produced water treatment manufacturers, produced water treatment service companies, suppliers and distributors of produced water treatment in the supply chain. The demand side of this market is characterized by the increasing oil & gas exploration activities. The supply side is characterized by rising demand for contracts from the oil & gas sector and mergers & acquisitions among big players. Various primary sources from both the supply and demand sides of the market were interviewed to obtain qualitative and quantitative information.
Following is the breakdown of primary respondents:
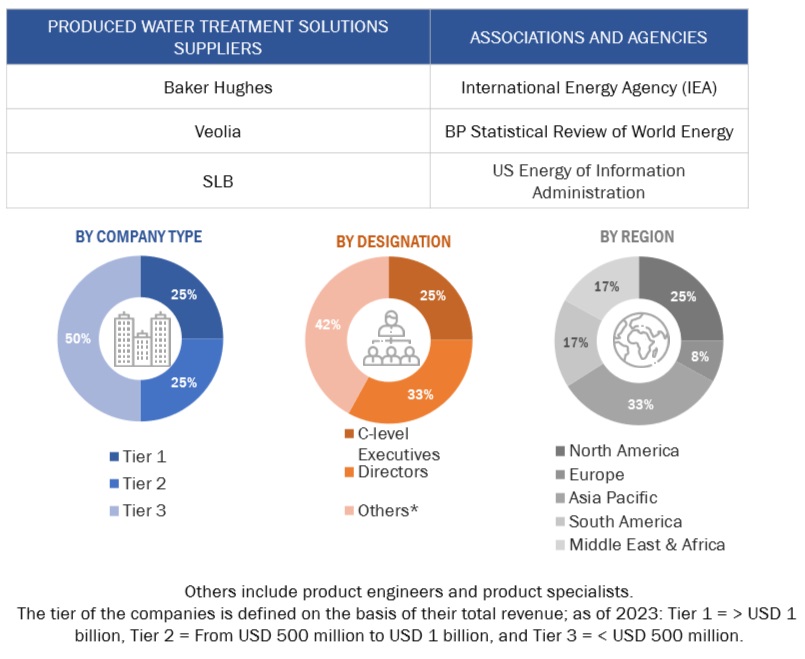
To know about the assumptions considered for the study, download the pdf brochure
Market Size Estimation
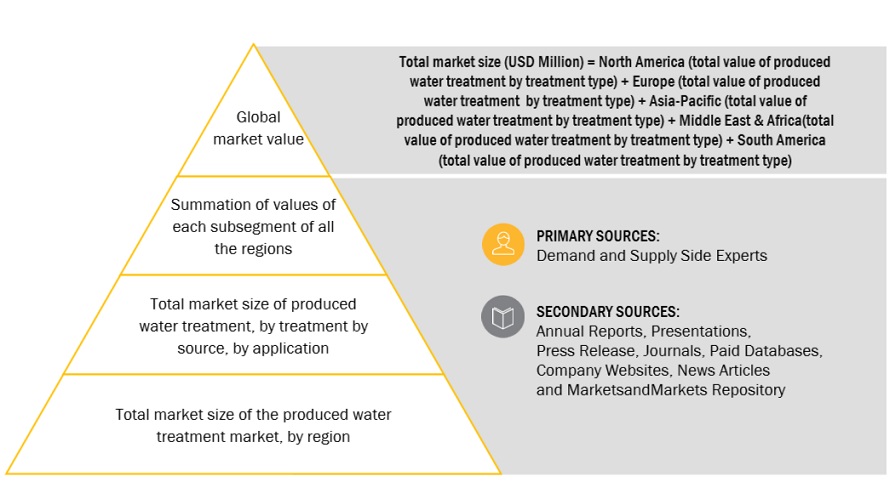
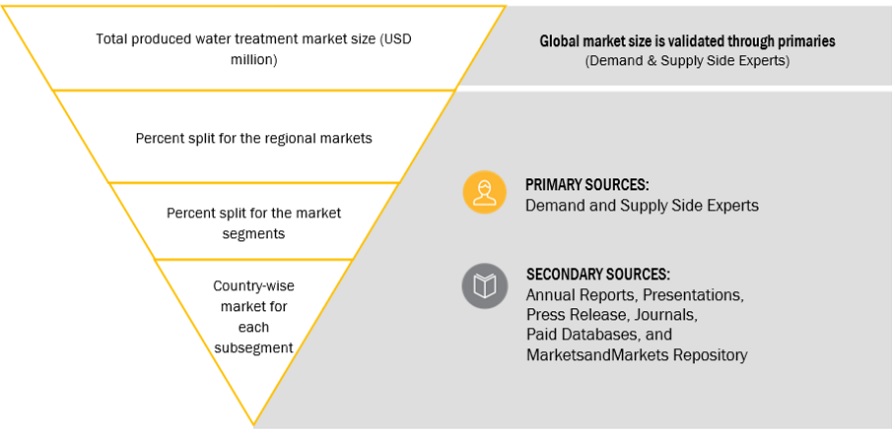
Both top-down and bottom-up approaches were used to estimate and validate the total size of the produced water treatment market. These methods were also used extensively to estimate the size of various subsegments in the market. The research methodology used to estimate the market size includes the following:
- The key players in the industry and market have been identified through extensive secondary research, and their market share in the respective regions has been determined through both secondary and primary research.
- The industry’s value chain and market size, in terms of value, have been determined through primary and secondary research processes.
- All percentage shares, splits, and breakdowns have been determined using secondary sources and verified through primaries.
Global Produced Water Treatment Market Size: Top-down Approach
Global produced water treatment Market Size: Bottom-Up Approach
Data Triangulation
After arriving at the overall market size from the estimation process explained above, the total market has been split into several segments and subsegments. The complete market engineering process is done to arrive at the exact statistics for all the segments and subsegments, also data triangulation and market breakdown processes have been employed, wherever applicable. The data has been triangulated by examining various factors and trends from both the demand- and supply sides. Along with this, the market has been validated through both the top-down and bottom-up approaches.
Market Definition
Produced water, which is a byproduct of oil and gas exploration process, requires active treatment to meet environmental regulations and helps in reuse or safe disposal. This produced water has a mixture of injected water, Natural formation water, and any other chemicals used in the exploration and drilling process.
Key Stakeholders
- Produced water treatment manufacturers and providers
- Manufacturing industries
- R&D laboratories
- Consulting companies from the energy & power sector
- Distributors of produced water treatment
- Government and research organizations
- State and national regulatory authorities
Objectives of the Study
- To define, describe, segment, and forecast the produced water treatment market by application, by source, and by treatment in terms of value and volume.
- To describe and forecast the market for six key regions: North America, Europe, Asia Pacific, South America, the Middle East, and Africa, along with their country-level market sizes, in terms of value.
- To provide detailed information regarding key drivers, restraints, opportunities, and challenges influencing market growth
- To strategically analyze the micro markets with respect to individual growth trends, prospects, and contributions to the overall market size
- To provide supply chain analysis, trends/disruptions impacting customer business, ecosystem/market map, pricing analysis, Porter’s five forces analysis, case study analysis, and regulatory standards pertaining to produced water treatment
- To analyze opportunities for stakeholders in the produced water treatment and draw a competitive landscape of the market.
- To strategically analyze the ecosystem, tariffs and regulations, patents, and trading scenarios pertaining to produced water treatment
- To compare key market players based on product specifications and applications.
- To strategically profile key players and comprehensively analyze their market rankings and core competencies
- To analyze competitive developments, such as contracts and agreements, investments and expansions, mergers and acquisitions, partnerships, joint ventures, and collaborations, in produced water treatment
Available Customizations:
With the given market data, MarketsandMarkets offers customizations as per the client’s specific needs. The following customization options are available for this report:
Geographic Analysis
- Further breakdown of region or country-specific analysis
Company Information
- Detailed analysis and profiling of additional market players (up to 5)
Get the Full Produced Water Treatment Market Report
Full forecast, segment splits, and company analysis for all Produced Water Treatment Market.
- UK Produced Water Treatment Market
- China Produced Water Treatment Market
- India Produced Water Treatment Market
- Saudi Arabia Produced Water Treatment Market
- UAE Produced Water Treatment Market
- Iraq Produced Water Treatment Market
- Iran Produced Water Treatment Market
- Rest Of Europe Produced Water Treatment Market
- Kazakhstan Produced Water Treatment Market
- Rest Of Asia Pacific Produced Water Treatment Market
- GCC Countries Produced Water Treatment Market
- Rest Of GCC Countries Produced Water Treatment Market
- Rest Of South America Produced Water Treatment Market
- US Produced Water Treatment Market
- Canada Produced Water Treatment Market
- Mexico Produced Water Treatment Market
- Brazil Produced Water Treatment Market
- Colombia Produced Water Treatment Market
- Venezuela Produced Water Treatment Market
- Norway Produced Water Treatment Market
- Russia Produced Water Treatment Market
Need a Tailored Report?
Customize this report to your needs
Get 10% FREE Customization
Customize This Report
