
INDONESIA Sweeteners Market (2023-2028)

The INDONESIA Sweeteners Market was valued at $3559.7 Million in 2023 and projected to reach to $4272.8 Million by 2028, representing a compound annual growth rate of 3.7%. Indonesia's sweeteners market is positioned for sustained growth through 2028, supported by demographic shifts and evolving consumption habits.


| Market Size in | USD 26.32 MN |
| Market Forecast in | |
| CAGR | |
| Forecast Period | |
| Units Considered | Value (USD MN) |
INDONESIA Sweeteners Market Trends and Insights
- This expansion reflects Indonesia's rising demand for processed foods, beverages, and confectionery products driven by increasing urbanization and changing consumer preferences.
- Indonesia's growing middle-class population and rising disposable incomes are fueling consumption of sweetened products across retail and foodservice channels. The Indonesian sweeteners market is characterized by a diverse product portfolio including sugar, high-fructose corn syrup, stevia, and artificial sweeteners.
- Indonesia's food and beverage manufacturers are increasingly adopting alternative sweetening solutions to meet evolving health-conscious consumer demands and regulatory requirements.
- Between 2023 and 2028, Indonesia's market is expected to grow at a compound annual growth rate of 3.7%, outpacing global averages and reflecting the country's dynamic food industry expansion. Indonesia's strategic position as a major palm sugar producer and growing investment in sweetener manufacturing infrastructure position the country as a key market within the Asia Pacific region.
- The forecast period through 2028 will see Indonesia balancing traditional sweetener consumption with emerging demand for natural and low-calorie alternatives..
Key Market Statistics
- CAGR (2023-2028) 3.7% CAGR
- Market Size, 2023 ~USD 3559.7 Million
- Forecast, 2028 ~USD 4272.8 Million
- Country INDONESIA
INDONESIA Sweeteners Market Overview
Market Valuation :
Indonesia's sweeteners market reached USD 3,559.7 million in 2023, demonstrating robust demand across food, beverage, and confectionery sectors driven by rapid urbanization and middle-class expansion.
Growth Trajectory :
The market is projected to grow at a CAGR of 3.7% through 2028, reaching USD 4,272.8 million, outpacing the global average of 3.1% and reflecting Indonesia's accelerating consumption patterns.
Consumer Drivers :
Rising disposable incomes, increasing urbanization, and shifting consumer preferences toward processed and convenience foods are fueling demand for sweeteners across Indonesia's growing middle-class population.
Market Composition :
Indonesia's sweeteners market encompasses sugar, high-fructose corn syrup, artificial sweeteners, and sugar alcohols, with applications spanning beverages, confectionery, dairy, and bakery products.
INDONESIA Sweeteners Market Dynamics
- The country's expanding middle class and increasing urbanization are driving higher demand for processed foods and ready-to-drink beverages, key consumption channels for sweeteners.
- Additionally, Indonesia's growing food manufacturing sector and rising foreign investment in the F&B industry are creating new opportunities for sweetener suppliers. Looking ahead, the market will likely see increased competition between conventional and alternative sweeteners as health-conscious consumers gain prominence.
- Regulatory developments around sugar content and labeling requirements will shape product formulations, while innovation in natural and low-calorie sweetening solutions will drive differentiation.
- Strategic partnerships with local manufacturers and distribution networks will be critical for capturing market share in this dynamic Southeast Asian market..
Market Ecosystem
Related Ecosystem
Fandb Ingredients
- Dairy Products
- Bakery Products
- Microorganism
- Polydextrose
- Carbohydrates
- AZELIS HOLDINGS SA
- Archer-Daniels-Midland Company
- Kerry Group plc
- Amway
- DSM FIRMMENICH
Key Takeaways
- Indonesia's sweeteners market is valued at USD 3,559.7 million in 2023 and is forecast to reach USD 4,272.8 million by 2028, representing a 3.7% CAGR.
- Indonesia's growing urbanization and rising middle-class consumption patterns are primary drivers of sweetener demand across processed foods and beverages.
- Indonesia's manufacturers are increasingly shifting toward natural and alternative sweeteners to address health-conscious consumer preferences and regulatory pressures.
- Indonesia's position as a major palm sugar producer provides competitive advantages in the regional sweeteners market through 2028.
Sweeteners Market Report Scope
| Report Metric | Details |
|---|---|
| Base Year | 2023 |
| Fastest Growing Segment | NOVEL SWEETENERS (Product) |
| Forecast Period | 2023-2028 |
| Growth Rate | CAGR of 3.1% from 2023 to 2028 |
| Largest Segment | SUCROSE (Product) |
| Market Size Base Year (Billions) | ~USD 107.39 (2023) |
| Revenue Forecast (Billions) | ~USD 125.1 (2028) |
| Segments Covered | Application, Subapplication, Product, Subtype, Type, Nature, Form, Sales Channel, Indirect, Beverage Application, Food Application |
INDONESIA Sweeteners Market Report Segmentation
11 segment dimensions are covered across the global market.
By Application
- Beverages
- Food
- Other Applications
- Personal Care
- Pharmaceuticals
By Subapplication
- Alcoholic Beverages
- Bakery Products
- Carbonated Drinks
- Confectionery Products
- Dairy Products
- Flavored Alcoholic Beverages
- Fruit Drinks & Juices
- Other Beverages
- Other Food Products
- Plant-Based Beverages
- Plant-Based Foods
- Powdered Drinks
- Sweet Spreads
By Product
- Artificial Sweeteners
- High-Fructose Corn Syrup
- Natural Sweeteners
- Novel Sweeteners
- Polyols
- Sucrose
By Subtype
- Ace-K
- Agave Syrup
- Allulose
- Aspartame
- Coconut Sugar
- Cyclamate
- D-Tagatose
- Erythritol
- Honey
- Lucuma Fruit Sugar
- Maltitol
- Mannitol
- Maple Syrup
- Molasses
- Monk Fruit Sugar
- Other Artificial Sweeteners
- Other Natural Sweeteners
- Other Polyols
- Palm Sugar
- Saccharin
- Sorbitol
- Stevia
- Sucralose
- Xylitol
By Type
- Allulose
- D-Tagatose
- Erythritol
- High-Fructose Syrup
- High-Intensity Sweeteners
- Isomalt
- Low-Intensity Sweeteners
- Maltitol
- Sorbitol
- Xylitol
By Nature
- Artificial
- Natural
By Form
- Crystals
- Liquid
- Powder
By Sales Channel
- Direct (B2B)
- Indirect (B2C)
By Indirect
- Convenience Stores
- Hypermarkets/Supermarkets
- Online Retailers
- Other Channels
- Other Indirect Channels
- Specialty Retail Stores
By Beverage Application
- Alcoholic Beverages
- Carbonated Drinks
- Flavored Alcoholic Beverages
- Fruit Drinks & Juices
- Other Beverages
- Plant-Based Beverages
- Powdered Drinks
By Food Application
- Bakery Products
- Confectionery Products
- Dairy Products
- Other Food Products
- Plant-Based Foods
- Sweet Spreads
INDONESIA: SWEETENERS MARKET, BY APPLICATION, 2023–2028
| Segment | 2023 | 2024 | 2025 | 2026 | 2027 | 2028 | CAGR (%) |
|---|---|---|---|---|---|---|---|
| BEVERAGES | 1045.6 | 1075.3 | 1107.9 | 1143.7 | 1182.8 | 1225.5 | 3.2 |
| FOOD | 830.9 | 862.4 | 896.9 | 934.6 | 975.7 | 1020.6 | 4.2 |
| OTHER APPLICATIONS | 75.7 | 77.6 | 79.7 | 82 | 84.5 | 87.3 | 2.9 |
| PERSONAL CARE | 213.9 | 222.7 | 232.3 | 242.7 | 254.1 | 266.6 | 4.5 |
| PHARMACEUTICALS | 283.3 | 294.6 | 307 | 320.5 | 335.2 | 351.3 | 4.4 |
| TOTAL | 2449.3 | 2532.6 | 2623.8 | 2723.5 | 2832.4 | 2951.4 | 3.8 |
Target Audience
- Food & Beverage Manufacturers : Indonesian F&B producers need localized market data to optimize sweetener sourcing, formulation strategies, and product development aligned with domestic consumer preferences and regulatory requirements.
- Sweetener Suppliers & Distributors : Suppliers targeting Indonesia require detailed market insights to identify growth segments, assess competitive positioning, plan distribution networks, and forecast demand across beverage, confectionery, and dairy applications.
- Investment & Private Equity Firms : Investors evaluating opportunities in Indonesia's F&B sector need comprehensive market data to assess sweetener market attractiveness, growth potential, and investment risks specific to this high-growth Southeast Asian economy.
- Market Entry & Expansion Strategists : Companies planning to enter or expand in Indonesia's sweeteners market require country-specific insights on market size, growth drivers, consumer behavior, and competitive landscape to inform strategic planning.
- Government & Trade Organizations : Indonesian trade bodies, regulatory agencies, and policy makers need market intelligence to inform industry development initiatives, trade policies, and strategic planning for the sweeteners and broader F&B sector.
Reasons to Buy this Report
- Localized Market Intelligence : Gain deep insights specific to Indonesia's sweeteners landscape, including country-specific consumption patterns, regulatory environment, and competitive dynamics that differ from broader regional or global analyses.
- Growth Opportunity Identification : Identify high-potential segments within Indonesia's 3.7% CAGR growth trajectory, including emerging consumer preferences for natural sweeteners, health-conscious alternatives, and premium product categories.
- Strategic Market Entry Planning : Develop informed market entry or expansion strategies with accurate sizing data, growth forecasts through 2028, and understanding of Indonesia's unique demographic and economic drivers for sweetener demand.
- Competitive Positioning : Benchmark your offerings against Indonesia-specific market trends, identify white spaces in the competitive landscape, and understand how local consumer preferences and purchasing power shape market dynamics.
- Investment Decision Support : Make data-driven investment and resource allocation decisions backed by verified market valuations, CAGR projections, and Indonesia-specific growth catalysts for the sweeteners sector through 2028.
Frequently asked questions
What is the current size of Indonesia's sweeteners market?
Indonesia's sweeteners market was valued at USD 3,559.7 million in 2023 and is projected to grow to USD 4,272.8 million by 2028.
What is the expected growth rate for Indonesia's sweeteners market?
Indonesia's sweeteners market is expected to grow at a compound annual growth rate (CAGR) of 3.7% from 2023 to 2028.
What types of sweeteners are consumed in Indonesia?
Indonesia's sweeteners market includes conventional sugar, high-fructose corn syrup, stevia, artificial sweeteners, and palm sugar products.
What are the main drivers of growth in Indonesia's sweeteners market?
Indonesia's market growth is driven by urbanization, rising disposable incomes, increasing processed food consumption, and growing demand for alternative sweeteners.
How does Indonesia's sweeteners market compare to global trends?
Indonesia's 3.7% CAGR outpaces the global sweeteners market CAGR of 3.1%, reflecting stronger regional demand dynamics and consumption growth.
RESEARCH METHODOLOGY
The study involved four major activities in estimating the current size of the sweeteners market. Exhaustive secondary research was done to collect information on the market, peer, and parent markets. The next step was to validate these findings, assumptions, and sizing with industry experts across the value chain through primary research. Both top-down and bottom-up approaches were employed to estimate the complete market size. After that, market breakdown and data triangulation were used to estimate the market size of segments and subsegments.
Secondary Research
This research study involved the extensive use of secondary sources—directories and databases such as Bloomberg Businessweek and Factiva—to identify and collect information useful for a technical, market-oriented, and commercial study of the sweeteners market.
In the secondary research process, various sources, such as the International Sugar Organization (ISO), Food and Agriculture Organization (FAO), Food and Drug Administration (FDA), United States Department of Agriculture (USDA), European Food Safety Agency (EFSA), Food Safety and Standards Authority of India (FSSAI), and academic references pertaining to sweeteners were referred to identify and collect information for this study. The secondary sources also include food journals, press releases, investor presentations of companies, white papers, certified publications, articles by recognized authors and regulatory bodies, trade directories, and paid databases.
Secondary research was mainly conducted to obtain critical information about the industry’s supply chain, the total pool of key players, and market classification and segmentation according to the industry trends to the bottom-most level and geographical markets. It was also used to obtain information about the key developments from a market-oriented perspective.
Primary Research
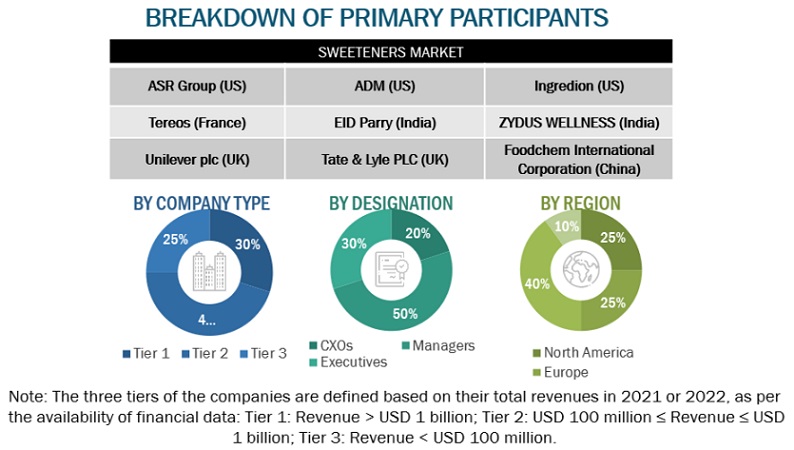
Extensive primary research was conducted after obtaining information regarding the sweeteners market scenario through secondary research. Several primary interviews were conducted with market experts from both the demand and supply sides across major countries of North America, Europe, Asia Pacific, South America, and the Rest of the World. Primary data was collected through questionnaires, emails, and telephonic interviews. The primary sources from the supply side included various industry experts, such as Chief X Officers (CXOs), Vice Presidents (VPs), Directors, from business development, marketing, research, and development teams, and related key executives from distributors, and key opinion leaders. Primary interviews were conducted to gather insights such as market statistics, data on revenue collected from the products and services, market breakdowns, market size estimations, market forecasting, and data triangulation. Primary research also helped in understanding the various trends related to types of sweeteners, products, forms, sales channels, applications, and regions. Stakeholders from the demand side, such as food and beverage companies and health and personal care companies who are using sweeteners were interviewed to understand the buyer’s perspective on the suppliers, products, and their current usage of sweeteners and the outlook of their business which will affect the overall market.
To know about the assumptions considered for the study, download the pdf brochure
Market Size Estimation
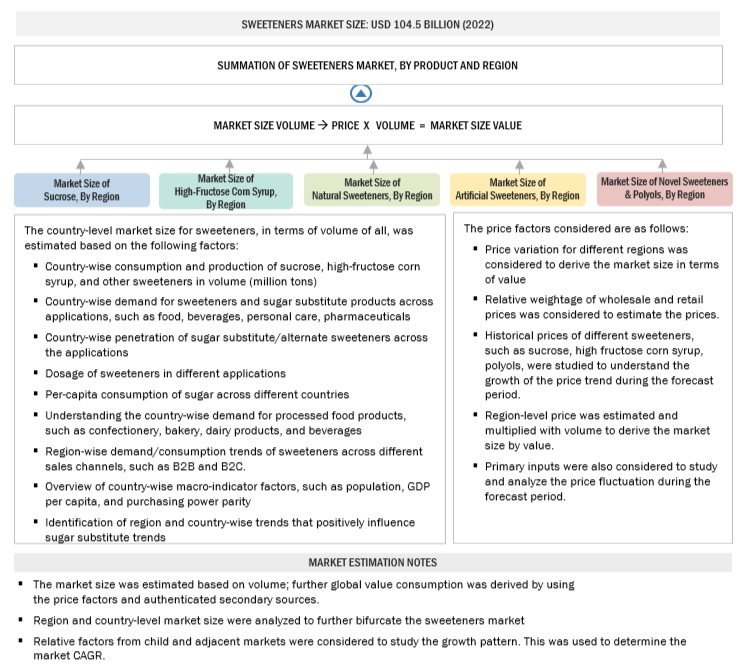
Both the top-down and bottom-up approaches were used to estimate and validate the total size of the sweeteners market. These approaches were also used extensively to determine the size of various subsegments in the market for the base year in terms of value. The research methodology used to estimate the market size includes the following details:
- The key players in the industry and the overall markets were identified through extensive secondary research.
- The revenues of the major players were determined through primary and secondary research, which were used as the basis for market sizing and estimation.
- All percentage shares, splits, and breakdowns were determined using secondary sources and verified through primary sources.
- All macroeconomic and microeconomic factors affecting the growth of the sweeteners market were considered while estimating the market size.
- All possible parameters that affect the market covered in this research study were accounted for, viewed in extensive detail, verified through primary research, and analyzed to obtain final quantitative and qualitative data.
Bottom-up Approach (Demand Side):
Through the bottom-up approach, the data extracted from secondary research was utilized to validate the market segment sizes obtained. The approach was employed to arrive at the overall size of the sweeteners market in particular regions, and its share in the market was validated through primary interviews conducted with sweetener manufacturers, suppliers, dealers, and distributors. With the data triangulation procedure and data validation through primary, the overall size of the parent market and each segmental market were determined.
To know about the assumptions considered for the study, Request for Free Sample Report
Top-down Approach:
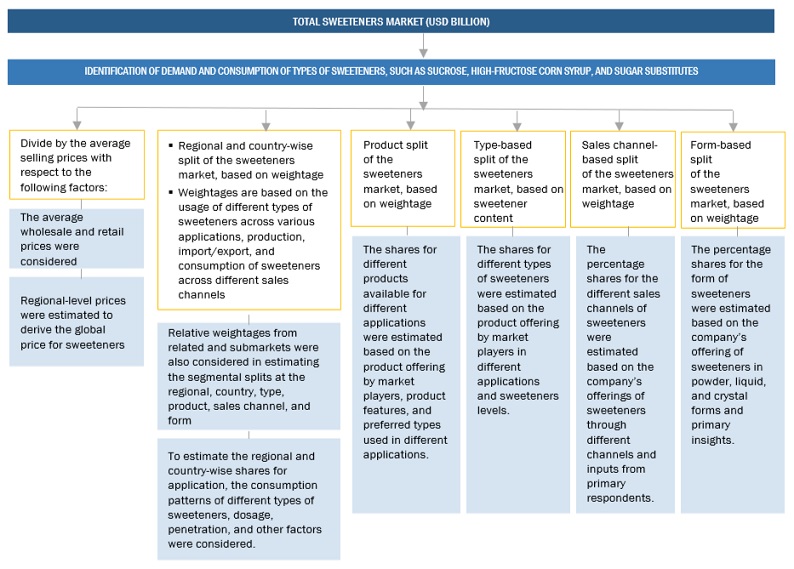
Market Size Estimation (Supply Side):
supply-side analysis was conducted to triangulate the market for sweeteners. The market for sweeteners was analyzed for each product.
- Going at a granular level, the share of sweetener products was analyzed among key players operating in the sweeteners market.
- The other factors considered include the demand for natural sweeteners, adoptions, increase in innovations, new product launches, consumer awareness, pricing trends, the adoption rate, patents registered, and organic & inorganic growth attempts.
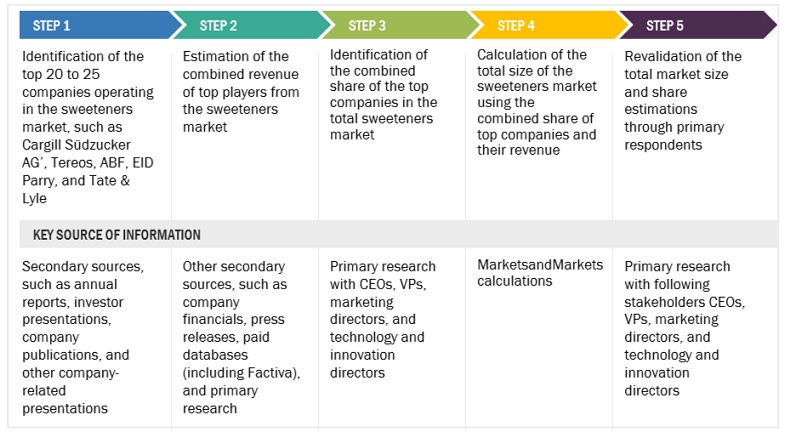
The top-down procedure has been employed to determine the overall size of the sweeteners market from the revenues of key players (companies) and their product share.
- The market share was then estimated for each company to verify the revenue share used earlier in the bottom-up procedure. With the data triangulation procedure and data validation through primaries, the exact values of the overall parent and each individual market have been determined and confirmed in this study.
Data Triangulation
After arriving at the overall market size from the above estimation process, the total market was split into several segments and subsegments. Where applicable, data triangulation and market breakdown procedures were employed to estimate the overall sweetener market and arrive at the exact statistics for all segments and subsegments. The data was triangulated by studying various factors and trends from the demand and supply sides. The market size was also validated using the top-down and bottom-up approaches.
Market Definition
As per the European Food Safety Authority (EFSA), Sweeteners are food additives that are used to impart a sweet taste to foodstuffs. It is an artificial substance that tastes sweet. It is a low-calorie synthetic product used instead of sugar.
Sweeteners are substances employed to add a sweet taste to food, beverages, or other items. They serve as alternatives to natural sugars, providing sweetness without the caloric content associated with conventional sugars. Sweeteners can be categorized into two primary groups: natural sweeteners, sourced from plants or natural origins, and artificial sweeteners, which are chemically manufactured.
Key Stakeholders
- Raw material suppliers
- Regulatory bodies that include the following:
- Food safety agencies, such as the Food and Drug Administration (FDA), European Food Safety Authority (EFSA), US Department of Agriculture (USDA), Food Standards Australia New Zealand (FSANZ), Health Canada – Food Directorate, China National Center for Food Safety Risk Assessment (CFSA), and World Health Organization (WHO)
- Government agencies and NGOs
- End users include the following:
- Food & beverage manufacturers/suppliers
- Health & personal care product manufacturers/suppliers
- Retailers
- Commercial Research & Development (R&D) institutions and financial institutions
- Importers and exporters of sugar substitutes
- Traders, distributors, and suppliers
- Research organizations
- Trade associations and industry bodies
Report Objectives
- To determine and project the size of the sweeteners market, concerning type, product, form, sales channel, application, and region, over five years, ranging from 2023 to 2028
- To identify the attractive opportunities in the market by determining the largest and fastest-growing segments across regions
- To provide detailed information about the key factors influencing the growth of the market (drivers, restraints, opportunities, and industry-specific challenges)
- To analyze the micro-markets concerning individual growth trends, prospects, and their contribution to the total market
- Identifying and profiling the key players in the sweeteners market
-
Providing a comparative analysis of market leaders based on the following:
- Product offerings
- Business strategies
- Strengths and weakness
- Key financials
- Understanding the competitive landscape and identifying the major growth strategies players adopt across the key regions
- Analyzing the value chain and products across key regions and their impact on prominent market players
- Providing insights on key product innovations and investments in the sweeteners market
Available Customizations:
With the given market data, MarketsandMarkets offers customizations according to company-specific scientific needs.
The following customization options are available for the report:
Product Analysis
- Product Matrix, which gives a detailed comparison of the product portfolio of each company.
Geographic Analysis
With the given market data, MarketsandMarkets offers customizations according to company-specific scientific needs.
- Further breakdown of the Rest of Europe into Sweden, Belgium, Switzerland, Ukraine, and other EU and non-EU countries.
- Further breakdown of the Rest of Asia Pacific sweeteners market into key countries
- Further breakdown of the Rest of European sweeteners market into key countries.
Company Information
- Detailed analyses and profiling of additional market players (up to five)
Get the Full Sweeteners Market Report
Full forecast, segment splits, and company analysis for all Sweeteners Market.
- CANADA Sweeteners Market
- GERMANY Sweeteners Market
- UK Sweeteners Market
- FRANCE Sweeteners Market
- ITALY Sweeteners Market
- SPAIN Sweeteners Market
- RUSSIA Sweeteners Market
- POLAND Sweeteners Market
- CHINA Sweeteners Market
- INDIA Sweeteners Market
- JAPAN Sweeteners Market
- SOUTH KOREA Sweeteners Market
- THAILAND Sweeteners Market
- MALAYSIA Sweeteners Market
- MEXICO Sweeteners Market
- BRAZIL Sweeteners Market
- ARGENTINA Sweeteners Market
- SOUTH AFRICA Sweeteners Market
- SAUDI ARABIA Sweeteners Market
- US Sweeteners Market
- Rest Of Europe Sweeteners Market
- Rest Of Asia Pacific Sweeteners Market
- Rest Of Latin America Sweeteners Market
- Rest Of Africa Sweeteners Market
- Rest Of The Middle East Sweeteners Market
Need a Tailored Report?
Customize this report to your needs
Get 10% FREE Customization
Customize This Report
