Human Identification Market by Product & Services (Consumables, Instruments, Software), Technology (PCR, Capillary Electrophoresis, NGS, Microarray), Application (Forensic, Paternity Testing), End User (Forensic Laboratories) & Geography
The global human identification market is projected to grow at a CAGR of 13.4%. The government initiatives, focus on market players on expanding their presence, reach and technological advancement will drive the growth of the human identification market. In the coming years, emerging markets are expected to offer growth opportunities for players in the human identification market.
The next-generation sequencing segment is expected to register the highest CAGR during the forecast period
On the basis of technology, the human identification market is classified into PCR, NGS, capillary electrophoresis, nucleic acid isolation and purification, automated liquid handling, microarrays, and rapid DNA analysis. The NGS technology segment is expected to register the highest growth rate during the forecast period. The growth of this market segment is mainly driven by technological advancements and product launches.
The assay kits and reagent segment to dominate human identification market in 2018
By consumable type, the human identification market is segmented into assay kits & reagents and other consumables. The assay kits and reagents segment accounted for largest market share of the human identification market in 2018. Regular and bulk purchases of assay kits coupled with the launch of new assay kits and reagents are expected to drive the growth of this market segment in the coming years.
By Application, forensic application segment to record the highest CAGR during the forecast period
By Application, the human identification market is segmented into forensic applications, paternity identification, and other applications (disaster victim identification, population genetics, identification of crimes related to human trafficking, and anthropology applications). Forensic applications segment is projected to register a higher CAGR during the forecast period. Highest CAGR of this segment can be attributed to the increasing crime rates across the globe.
By end user type, forensic laboratories segment to record the highest CAGR during the forecast period
Based on end user, the human identification market segmented into forensic laboratories and research centers and academic & government institutes. The forensic laboratories end user segment is projected to register a higher CAGR during the forecast period. The growing availability of government funding and increasing number of laboratories are the key factors driving the growth of this market.
North America to hold the largest share and Asia is projected to be the fastest-growing regional market during the forecast period”
Geographically, the human identification market is dominated by North America, followed by Europe, Asia, and the Rest of the World (RoW). North America is expected to command the largest share of the human identification market. The large share of this segment can be attributed to the growing support for the development of forensics and increasing partnerships between universities in this region. The Asian region is estimated to grow at the fastest rate which can be attributed to increasing number of conferences and workshops.
Market Dynamics
Driver: Government initiatives for forensic programs
Taking into account the potential, demand, and usage of human identification in various fields, government bodies across the globe have increased their support for the growth of the human identification market. In the US, the Department of Justice provides the Forensic DNA Capacity Enhancement Program to assist eligible states and units of local government to process, record, screen and analyze forensic DNA and/or DNA database samples, and also increase the capacity of public forensic DNA and DNA database laboratories to process DNA samples. In FY 2016, The National Institute of Justice received USD 125 million funds from the Department of Justice Appropriation Act.for three purposes such as forensic programs the Kirk Bloodsworth PostConviction DNA Testing program and the Sexual Assault Forensic Exam Program.
Opportunity: Emerging markets
Emerging markets such as China, India, Brazil, Argentina, Saudi Arabia, and Mexico are expected to offer significant growth opportunities for market players in the coming years. Governments of various Asian countries have also extended support for the development of human identification products and forensic research. In this regard, in March 2013, the Taiwanese government invested USD 3 million for accelerating its ongoing projects, which also includes projects for the procurement of equipment in its forensic laboratories. Furthermore, the Indian government is planning to develop a national DNA fingerprint database of criminals. The development of such database will require high-end instruments and consumables. This will provide human identification product manufacturers an array of opportunities for investing in the Indian market
Get online access to the report on the World's First Market Intelligence Cloud
- Easy to Download Historical Data & Forecast Numbers
- Company Analysis Dashboard for high growth potential opportunities
- Research Analyst Access for customization & queries
- Competitor Analysis with Interactive dashboard
- Latest News, Updates & Trend analysis
Request Sample Scope of the Report
Get online access to the report on the World's First Market Intelligence Cloud
- Easy to Download Historical Data & Forecast Numbers
- Company Analysis Dashboard for high growth potential opportunities
- Research Analyst Access for customization & queries
- Competitor Analysis with Interactive dashboard
- Latest News, Updates & Trend analysis
Report Metric |
Details |
Market size available for years |
2016–2022 |
Base year considered |
2016 |
Forecast period |
2017–2022 |
Forecast units |
Million (USD) |
Segments covered |
Product and Services, Technology, Application, End User |
Geographies covered |
North America, Europe, Asia, RoW |
Companies covered |
Thermo Fisher Scientific Inc., Qiagen N.V., Promega Corporation, Agilent Technologies, Inc., General Electric Company (GE Healthcare), Illumina Inc., LGC Limited, NMS Labs Inc., Laboratory Corporation of America Holdings, Eurofins Scientific, Hamilton Company, Integenx Inc. |
The research report categorizes the human identification market into the following segments and subsegments:
By Product & Service
-
Consumables
- Assay Kits & Reagents
- DNA Extraction Kits and Reagents
- DNA Quantification Kits and Reagents
- DNA Amplification Kits and Reagents
- Electrophoresis Kits and Reagents
- Rapid DNA Analysis Kits and Reagents
- Other Consumables
-
Services
- Instruments
- Software
By Technology
- Polymerase Chain Reaction (PCR)
- Next-generation Sequencing (NGS)
- Capillary Electrophoresis
- Nucleic Acid Isolation and Purification
- Automated Liquid Handling
- Microarrays
- Rapid DNA Analysis
By Application
- Forensic Application
- Paternity Testing
- Other Applications
By End User
- Forensic Laboratories
- Research Center, Academic & Government Institutes
By Region
-
North America
- US
- Canada
-
Europe
- Germany
- UK
- France
- Italy
- Rest of Europe (RoE)
-
Asia
- China
- India
- Japan
- Rest of Asia (RoA)
- Rest of the World (RoW)
Key Market Players
Thermo Fisher Scientific, Inc., Qiagen N.V., Promega Corporation, Illumina, Inc., and Eurofins Scientific
Recent Developments
Critical questions the report answers:
- Where will all these developments take the industry in the long term?
- What are the upcoming trends for the human identification market?
- Which segment provides the most opportunity for growth?
- Who are the leading vendors operating in this market?
- What are the opportunities for new market entrants?
To speak to our analyst for a discussion on the above findings, click Speak to Analyst
Table of Contents
1 Introduction (Page No. - 14)
1.1 Objectives of the Study
1.2 Market Definition
1.3 Market Scope
1.3.1 Market Covered
1.3.2 Years Considered for the Study
1.4 Currency
1.5 Limitations
1.6 Stakeholders
2 Research Methodology (Page No. - 18)
2.1 Secondary Data
2.1.1 Secondary Sources
2.2 Primary Data
2.2.1 Primary Sources
2.3 Market Size Estimation
2.3.1 Bottom-Up Approach
2.3.2 Top-Down Approach
2.4 Market Breakdown & Data Triangulation
2.5 Research Assumptions
3 Executive Summary (Page No. - 26)
4 Premium Insights (Page No. - 30)
4.1 Human Identification Market Overview
4.2 Human Identification Market, By Product & Service and Region
4.3 Human Identification Market, By Application,2017–2022
4.4 Geographical Snapshot of the Human Identification Market
5 Market Overview (Page No. - 34)
5.1 Introduction
5.2 Market Dynamics
5.2.1 Drivers
5.2.1.1 Government Initiatives for Forensic Programs
5.2.1.2 Technological Advancements
5.2.1.3 Focus of Market Players on Expanding Presence,Reach
5.2.2 Opportunity
5.2.2.1 Emerging Markets—Growth Hotspots for Companies
5.2.3 Challenge
5.2.3.1 Shortage of Skilled Professionals
6 Human Identification Market, By Product & Service (Page No. - 37)
6.1 Introduction
6.2 Consumables
6.2.1 Assay Kits and Reagents
6.2.1.1 Electrophoresis Kits & Reagents
6.2.1.2 DNA Amplification Kits & Reagents
6.2.1.3 DNA Quantification Kits & Reagents
6.2.1.4 DNA Extraction Kits & Reagents
6.2.1.5 Rapid DNA Analysis Kits & Reagents
6.3 Services
6.4 Instruments
6.5 Software
7 Human Identification Market, By Technology (Page No. - 47)
7.1 Introduction
7.2 Capillary Electrophoresis
7.3 Polymerase Chain Reaction
7.4 Nucleic Acid Purification & Extraction
7.5 Automated Liquid Handling
7.6 Microarrays
7.7 Next-Generation Sequencing
7.8 Rapid DNA Analysis
8 Human Identification Market, By Application (Page No. - 56)
8.1 Introduction
8.2 Forensic Applications
8.3 Paternity Identification
8.4 Other Applications
9 Human Identification Market, By End User (Page No. - 61)
9.1 Introduction
9.2 Forensic Laboratories
9.3 Research Centers and Academic & Government Institutes
10 Human Identification Market, By Region (Page No. - 65)
10.1 Introduction
10.2 North America
10.2.1 US
10.2.2 Canada
10.3 Europe
10.3.1 Germany
10.3.2 UK
10.3.3 France
10.3.4 Italy
10.3.5 Rest of Europe (RoE)
10.4 Asia
10.4.1 China
10.4.2 Japan
10.4.3 India
10.4.4 Rest of Asia (RoA)
10.5 Rest of the World (RoW)
11 Competitive Landscape (Page No. - 110)
11.1 Introduction
11.2 Market Share Analysis
12 Company Profiles (Page No. - 112)
(Overview,Products Offered,Product Offering Scorecard, Business Strategy Scorecard,Recent Developments)*
12.1 Thermo Fisher Scientific Inc.
12.1.1 Overview
12.1.2 Product/Services Offered
12.1.3 Product Offering Scorecard
12.1.4 Business Strategy Scorecard
12.1.5 Recent Developments (2014 – 2017)
12.2 Qiagen N.V.
12.2.1 Overview
12.2.2 Product/Services Offered
12.2.3 Product Offering Scorecard
12.2.4 Business Strategy Scorecard
12.2.5 Recent Developments (2014 –2017)
12.3 Promega Corporation
12.3.1 Overview
12.3.2 Product/Services Offered
12.3.3 Product Offering Scorecard
12.3.4 Business Strategy Scorecard
12.3.5 Recent Developments (2014 –2017)
12.4 Agilent Technologies,Inc.
12.4.1 Overview
12.4.2 Product/Services Offered
12.4.3 Product Offering Scorecard
12.4.4 Business Strategy Scorecard
12.4.5 Recent Developments (2014 –2017)
12.5 General Electric Company (Ge Healthcare)
12.5.1 Overview
12.5.2 Product/Services Offered
12.5.3 Product Offering Scorecard
12.5.4 Business Strategy Scorecard
12.5.5 Recent Developments (2014 –2017)
12.6 Illumina Inc.
12.7 LGC Limited
12.8 NMS Labs Inc.
12.9 Laboratory Corporation of America Holdings
12.1 Eurofins Scientific
12.11 Hamilton Company
12.12 Integenx Inc.
*Details on Marketsandmarkets View,Overview,Products Offered,Product Offering Scorecard, Business Strategy Scorecard,And Recent Developments Might Not Be Captured in Case of Unlisted Companies.
13 Appendix (Page No. - 152)
13.1 Industry Insights
13.2 Discussion Guide
13.3 Knowledge Store: Marketsandmarkets’ Subscription Portal
13.4 Introducing RT: Real-Time Market Intelligence
13.5 Available Customizations
13.6 Related Reports
13.7 Author Details
List of Tables (100 Tables)
Table 1 Human Identification Market, By Product & Service,2015–2022 (USD Million)
Table 2 Human Identification Market, By Consumables 2015–2022 (USD Million)
Table 3 Human Identification Consumables Market, By Region,2015–2022 (USD Million)
Table 4 Human Identification Market, By Assay Kits and Reagents,2015–2022 (USD Million)
Table 5 Human Identification Assay Kits and Reagents Market, By Region,2015–2022 (USD Million)
Table 6 Human Identification Electrophoresis Kits and Reagents Market, By Region,2015–2022 (USD Million)
Table 7 Human Identification DNA Amplification Kits and Reagents Market, By Region,2015–2022 (USD Million)
Table 8 Human Identification DNA Quantification Kits and Reagents Market, By Region,2015–2022 (USD Million)
Table 9 DNA Extraction Kits & Reagents Market, By Region,2015–2022 (USD Million)
Table 10 Human Identification Rapid DNA Analysis Kits and Reagents Market, By Region,2015–2022 (USD Million)
Table 11 Human Identification Services Market, By Region,2015–2022 (USD Million)
Table 12 Human Identification Instruments Market, By Region,2015–2022 (USD Million)
Table 13 Human Identification Software Market, By Region,2015–2022 (USD Million)
Table 14 Human Identification Market, By Technology,2015–2022 (USD Million)
Table 15 Human Identification Market for Capillary Electrophoresis, By Region,2015–2022 (USD Million)
Table 16 Human Identification Market for Pcr, By Region,2015–2022 (USD Million)
Table 17 Human Identification Market for Nucleic Acid Purification & Extraction, By Region,2015–2022 (USD Million)
Table 18 Human Identification Market for Automated Liquid Handling, By Region,2015–2022 (USD Million)
Table 19 Human Identification Market for Microarrays, By Region,2015–2022 (USD Million)
Table 20 Human Identification Market for Next-Generation Sequencing, By Region,2015–2022 (USD Million)
Table 21 Human Identification Market for Rapid DNA Analysis, By Region,2015–2022 (USD Million)
Table 22 Human Identification Market, By Application,2015–2022 (USD Million)
Table 23 Human Identification Market for Forensic Applications, By Region,2015–2022 (USD Million)
Table 24 Human Identification Market for Paternity Identification, By Region,2015–2022 (USD Million)
Table 25 Human Identification Market for Other Applications, By Region,2015–2022 (USD Million)
Table 26 Human Identification Market , By End User,2015–2022 (USD Million)
Table 27 Human Identification Market for Forensic Laboratories, By Region,2015–2022 (USD Million)
Table 28 Human Identification Market for Research Centers and Academic & Government Institutes, By Region,2015–2022 (USD Million)
Table 29 Human Identification Market, By Region,2015–2022 (USD Million)
Table 30 North America: Human Identification Market, By Country,2015–2022 (USD Million)
Table 31 North America: Human Identification Market, By Product & Service,2015–2022 (USD Million)
Table 32 North America: Human Identification, By Consumables,2015–2022 (USD Million)
Table 33 North America: Human Identification Market, By Assay Kit & Reagent,2015–2022 (USD Million)
Table 34 North America: Human Identification Market, By Technology,2015–2022 (USD Million)
Table 35 North America: Human Identification Market, By Application,2015–2022 (USD Million)
Table 36 North America: Human Identification Market, By End User,2015–2022 (USD Million)
Table 37 US: Human Identification Market, By Product & Service,2015–2022 (USD Million)
Table 38 US: Human Identification Market Size, By Technology,2015–2022 (USD Million)
Table 39 US: Human Identification Market By Application,2015–2022 (USD Million)
Table 40 US: Human Identification Market, By End User,2015–2022 (USD Million)
Table 41 Canada: Human Identification Market , By Product & Service,2015–2022 (USD Million)
Table 42 Canada: Human Identification Market Size, By Technology,2015–2022 (USD Million)
Table 43 Canada: Human Identification Market , By Application,2015–2022 (USD Million)
Table 44 Canada: Human Identification Market, By End User,2015–2022 (USD Million)
Table 45 Europe: Human Identification Market, By Country/Region,2015–2022 (USD Million)
Table 46 Europe: Human Identification Market , By Product & Service,2015–2022 (USD Million)
Table 47 Europe: Human Identification Market, By Consumables,2015–2022 (USD Million)
Table 48 Europe: Human Identification Market, By Assay Kits & Reagents,2015–2022 (USD Million)
Table 49 Europe: Human Identification Market, By Technology,2015–2022 (USD Million)
Table 50 Europe: Human Identification Market, By Application,2015–2022 (USD Million)
Table 51 Europe: Human Identification Market, By End User,2015–2022 (USD Million)
Table 52 Germany: Human Identification Market, By Product & Service,2015–2022 (USD Million)
Table 53 Germany : Human Identification Market Size, By Technology,2015–2022 (USD Million)
Table 54 Germany: Human Identification Market, By Application,2015–2022 (USD Million)
Table 55 Germany: Human Identification Market, By End User,2015–2022 (USD Million)
Table 56 UK: Human Identification Market , By Product & Service,2015–2022 (USD Million)
Table 57 UK: Human Identification Market Size, By Technology,2015–2022 (USD Million)
Table 58 UK: Human Identification Market, By Application,2015–2022 (USD Million)
Table 59 UK: Human Identification Market, By End User,2015–2022 (USD Million)
Table 60 France: Human Identification Market , By Product & Service,2015–2022 (USD Million)
Table 61 France: Human Identification Market Size, By Technology,2015–2022 (USD Million)
Table 62 France: Human Identification Market, By Application,2015–2022 (USD Million)
Table 63 France: Human Identification Market, By End User,2015–2022 (USD Million)
Table 64 Italy: Human Identification Market , By Product & Service,2015–2022 (USD Million)
Table 65 Italy: Human Identification Market Size, By Technology,2015–2022 (USD Million)
Table 66 Italy: Human Identification Market, By Application,2015–2022 (USD Million)
Table 67 Italy: Human Identification Market, By End User,2015–2022 (USD Million)
Table 68 RoE: Human Identification Market, By Product & Service,2015–2022 (USD Million)
Table 69 RoE: Human Identification Market, By Technology,2015–2022 (USD Million)
Table 70 RoE: Human Identification Market, By Application,2015–2022 (USD Million)
Table 71 RoE: Human Identification Market, By End User,2015–2022 (USD Million)
Table 72 Asia: Human Identification Market, By Country/Region,2015–2022 (USD Million)
Table 73 Asia: Human Identification Market, By Product & Service,2015–2022 (USD Million)
Table 74 Asia: Human Identification Market, By Consumables,2015–2022 (USD Million)
Table 75 Asia: Human Identification Market, By Assay Kits & Reagents,2015–2022 (USD Million)
Table 76 Asia: Human Identification Market, By Technology,2015–2022 (USD Million)
Table 77 Asia: Human Identification Market, By Application,2015–2022 (USD Million)
Table 78 Asia: Human Identification Market, By End User,2015–2022 (USD Million)
Table 79 China: Human Identification Market, By Product & Service,2015–2022 (USD Million)
Table 80 China: Human Identification Market, By Technology,2015–2022 (USD Million)
Table 81 China: Human Identification Market, By Application,2015–2022 (USD Million)
Table 82 China: Human Identification Market, By End User,2015–2022 (USD Million)
Table 83 Japan: Human Identification Market, By Product & Service,2015–2022 (USD Million)
Table 84 Japan: Human Identification Market, By Technology,2015–2022 (USD Million)
Table 85 Japan: Human Identification Market, By Application,2015–2022 (USD Million)
Table 86 Japan: Human Identification Market, By End User,2015–2022 (USD Million)
Table 87 India: Human Identification Market, By Product & Service,2015–2022 (USD Million)
Table 88 India: Human Identification Market, By Technology,2015–2022 (USD Million)
Table 89 India: Human Identification Market, By Application,2015–2022 (USD Million)
Table 90 India: Human Identification Market, By End User,2015–2022 (USD Million)
Table 91 RoA: Human Identification Market, By Product & Service,2015–2022 (USD Million)
Table 92 RoA: Human Identification Market Size, By Technology,2015–2022 (USD Million)
Table 93 RoA: Human Identification Market, By Application,2015–2022 (USD Million)
Table 94 RoA: Human Identification Market, By End User,2015–2022 (USD Million)
Table 95 RoW: Human Identification Market, By Product & Service,2015–2022 (USD Million)
Table 96 RoW: Human Identification Market, By Consumables,2015–2022 (USD Million)
Table 97 RoW: Human Identification Market, By Assay Kits & Reagents,2015–2022 (USD Million)
Table 98 RoW: Human Identification Market, By Technology,2015–2022 (USD Million)
Table 99 RoW: Human Identification Market, By Application,2015–2022 (USD Million)
Table 100 RoW: Human Identification Market, By End User,2015–2022 (USD Million)
List of Figures(32 Figures)
Figure 1 Research Methodology
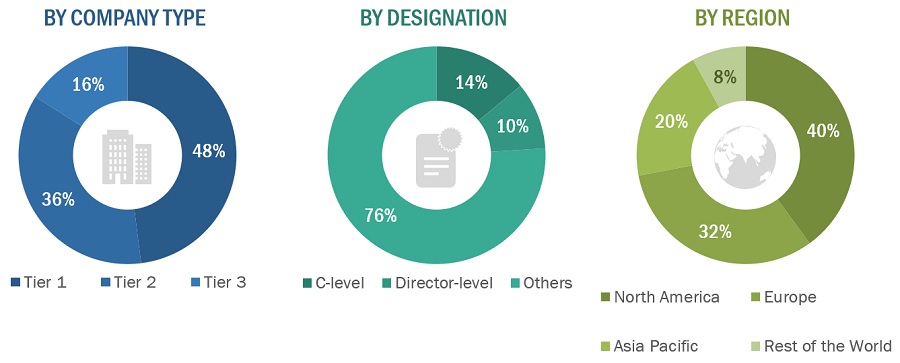
Figure 2 Breakdown of Primary Interviews: By Company Type,Designation,And Region
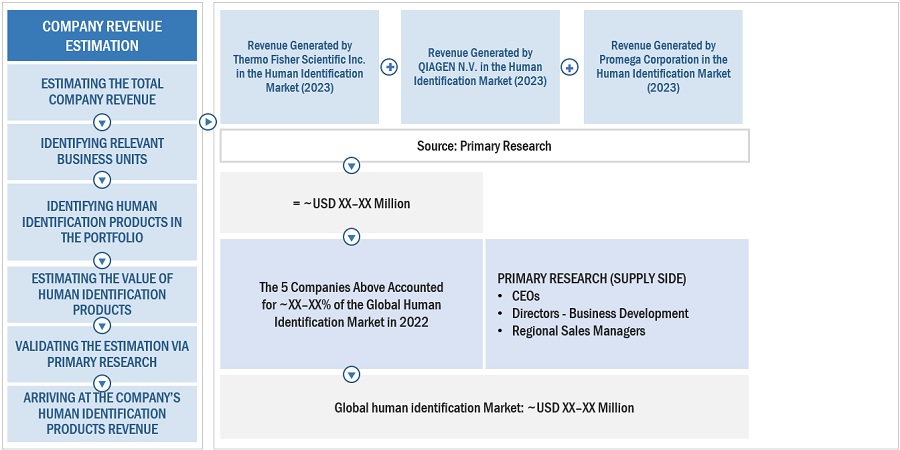
Figure 3 Bottom-Up Approach
Figure 4 Top-Down Approach
Figure 5 Data Triangulation
Figure 6 Human Identification Market, By Product & Service,2017 vs 2022 (USD Million)
Figure 7 Human Identification Market, By Technology,2017 vs 2022 (USD Million)
Figure 8 Human Identification Market, By Application,2017 vs 2022 (USD Million)
Figure 9 Human Identification Market, By End User,2017 vs 2022 (USD Million)
Figure 10 Human Identification Market, By Region,2017 vs 2022 (USD Million)
Figure 11 Increasing Government Initiatives for Forensic Programs,the Major Factor Driving Market Growth 30
Figure 12 Consumables Segment to Command the Largest Market Share in 2017
Figure 13 Forensic Application to Grow at the Highest CAGR During the Forecast Period
Figure 14 Asia to Register the Highest CAGR Between 2017 & 2022
Figure 15 Human Identification Market: Drivers, Opportunities, And Challenges
Figure 16 Global Human Identification Market, By Product and Service
Figure 17 Capillary Electrophoresis to Dominate the Human Identification Technology Market During the Forecast Period
Figure 18 Forensics is Estimated to Be the Fastest-Growing Application Segment During the Forecast Period
Figure 19 Global Human Identification Market, By End User
Figure 20 Asia to Register the Highest CAGR During the Forecast Period
Figure 21 North America: Human Identification Market Snapshot
Figure 22 Europe: Human Identification Market Snapshot
Figure 23 Asia: Human Identification Market Snapshot
Figure 24 RoW: Human Identification Market Snapshot
Figure 25 Human Identification Market: Market Share (2016)
Figure 26 Thermo Fisher Scientific Inc.: Company Snapshot
Figure 27 Qiagen N.V.: Company Snapshot
Figure 28 Agilent Technologies Inc.: Company Snapshot
Figure 29 General Electric Company: Company Snapshot
Figure 30 Illumina Inc.: Company Snapshot
Figure 31 Laboratory Corporation of America Holdings: Company Snapshot
Figure 32 Eurofins Scientific : Company Snapshot
Growth opportunities and latent adjacency in Human Identification Market