Humidity Sensor Market Size, Share, Growth & Trends by Type (Capacitive, Resistive, Thermal Conductivity, Optical, Carbon, Ceramic, Lithium Chloride), Measurement Technique (Relative, Absolute), Technology (MEMS, Thin-film, Printed, Wireless Nodes) - Global Forecast to 2032

icon1
USD USD 5.32 BN
MARKET SIZE, 2032
icon2
CAGR 6.5%
(2026-2032)
icon3
250
REPORT PAGES
icon4
160
MARKET TABLES

HUMIDITY SENSOR MARKET OVERVIEW

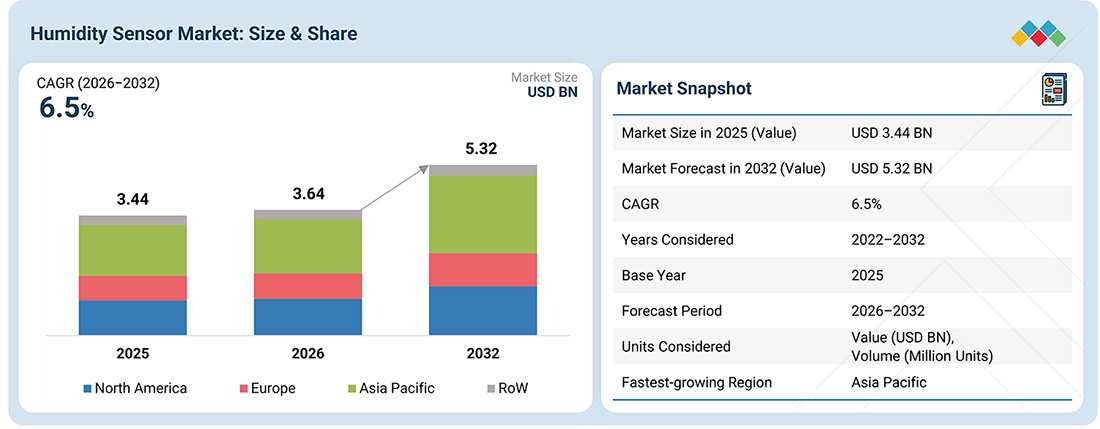
According to Marketsandmarkets, the global humidity sensor market size is projected to grow from USD 3.64 billion in 2026 to USD 5.32 billion by 2032, growing at a CAGR of 6.5% from 2026 to 2032. The demand for humidity sensors is primarily driven by the deployment of building automation and heating, ventilation, and air conditioning systems. These environments require precise moisture measurement for climate control and indoor air quality regulation. The integration of industrial process control systems is further driving sensor demand. Manufacturing applications like pharmaceutical processing and chemical production require accurate absolute humidity control to maintain optimal production conditions. Additionally, the transition toward Industry 4.0 creates a requirement for automated real-time moisture compensation across enterprise operations.

REPORT SCOPE

REPORT METRIC DETAILS
Market Size in 2025 (Value) USD 3.44 Billion
Market Size in 2026 (Value) USD 3.64 Billion
Market Forecast in 2032 (Value) USD 5.32 Billion
Growth Rate CAGR of 6.5% from 2026–2032
Years Considered 2022–2032
Base Year 2025
Forecast Period 2026–2032
Units Considered Value (USD Billion), Volume (Million Units)
Report Coverage Revenue forecast, company ranking, competitive landscape, growth factors, and trends
Top Companies
  • Amphenol Advanced Sensors (US)
  • Honeywell International Inc. (US)
  • Texas Instruments Incorporated (US)
  • Setra Systems (US)
  • Sensirion AG (Switzerland)
Growth Drivers
  • Increasing integration of humidity sensors into automated heating, ventilation, and air conditioning (HVAC) systems enables real-time humidity regulation, improves indoor comfort, and enhances energy efficiency across commercial and residential buildings.
  • The expansion of smart buildings and intelligent infrastructure is driving the adoption of humidity sensors for automated climate control, indoor environmental monitoring, and efficient building management.
  • Increasing emphasis on reducing energy consumption encourages the use of humidity sensors in HVAC systems to optimize airflow, minimize unnecessary heating and cooling, and reduce operational costs.
  • Growing awareness of indoor air quality and compliance with building regulations is increasing demand for humidity sensors that help maintain appropriate moisture levels, prevent condensation, and reduce mold-related risks.
  • Increasing use of humidity sensors in pharmaceutical manufacturing, healthcare facilities, food processing, and data centers is driving market growth by supporting precise environmental monitoring, product quality, and sensitive equipment protection.
Segments Covered
  • By Type:
    • Capacitive
    • Resistive
    • Thermal
    • and Other Humidity Sensor
  • By Measurement Technique: Absulute and Relative
  • By End User Application:
    • Environmental Monitoring
    • HVAC & Climate Control
    • Industrial Process Control
    • Consumer Electronics
    • Healthcare & Pharmacuticals
    • Agriculture
    • Automotive
    • Food & Bevarages
    • Building & Construction
    • and Logistics & Supply Chain
Regional Scope North America, Europe, Asia Pacific, and RoW

KEY TAKEAWAYS

  • Humidity Sensor MARKET, BY REGION
    By region, Asia Pacific is expected to record the highest CAGR in the humidity sensor market during the forecast period.
  • Humidity Sensor MARKET, BY Type
    By type, the capacitive segment is expected to dominate the market throughout the forecast period.
  • Humidity Sensor MARKET, BY Measurement Technique
    By measurement technique, the absolute segment is expected to record the fastest CAGR during the forecast period.
  • Humidity Sensor MARKET, BY End User Application
    The environmental monitoring segment is expected to register the highest CAGR in the humidity sensor market, by end-use application, during the forecast period.
  • COMPETITIVE LANDSCAPE - KEY PLAYERS
    Amphonol Advanced Sensors (US), Honeywell International Inc. (US), Texas Instruments Incorporation (US), Setra Systems (US), and Sensirion AG (Switzerland) were identified as some of the star players in the global humidity sensor market, given their strong market share and product footprint.
  • COMPETITIVE LANDSCAPE - STARTUPS/SMES
    AVTECH Software, Inc. (US), Novosense (China), Dickson (US), Sensoterra (Netherlands), and Viridix (Israel) among others have established themselves as specialized players in the humidity sensor market by focusing on high-performance materials and application-specific solutions.

The growth of the humidity sensor industry is being accelerated by the expansion of industrial automation and real time environmental data monitoring across enterprises. This leads to an increase in connected sensing nodes per individual facility. As accuracy tolerances tighten and building control architectures become decentralized, traditional analog sensing approaches are being replaced. Enterprise operators are adopting advanced technologies such as microelectromechanical systems (MEMS) sensors, CMOSens platforms, and integrated digital bus communication architectures. This technological transition expands the overall market value. Emerging applications include smart heating ventilation and air conditioning automation, automotive climate and anti-fogging control, medical cold chain monitoring, and cleanroom environmental regulation.
humidity-sensor-market Overview

Source: Secondary Research, Interviews with Experts, MarketsandMarkets Analysis

TRENDS & DISRUPTIONS IMPACTING CUSTOMERS' CUSTOMERS

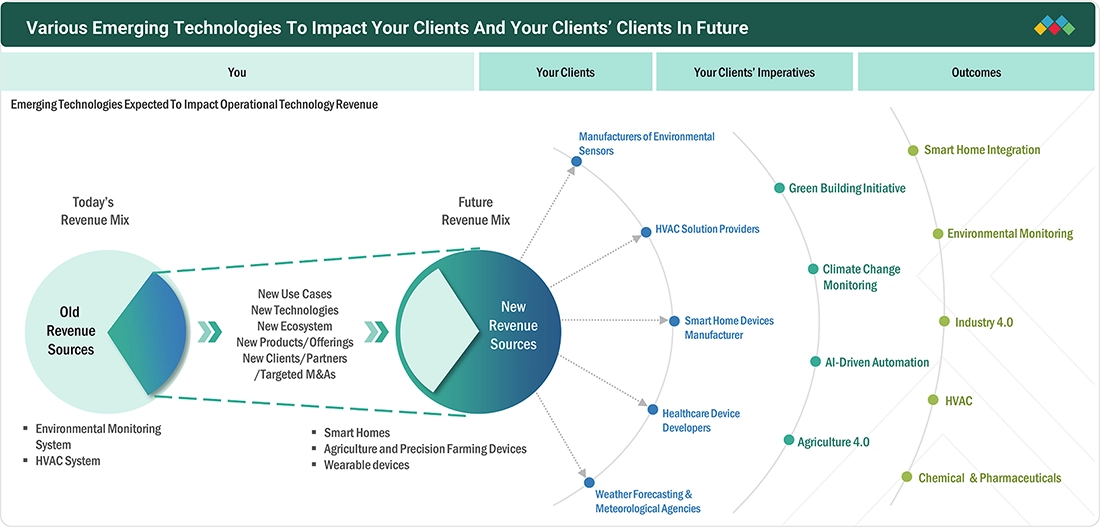
Humidity sensors are being shaped as companies replace traditional technology applications such as standalone environmental monitoring systems and basic HVAC setups. Operational technology providers are adopting new technology architectures. These include miniaturized MEMS sensors, connected modules for smart homes, agriculture and precision farming devices, and wearable electronics. This shift requires customized infrastructure integration for specific client operations. These clients operate across environmental sensor manufacturing, HVAC solution provision, smart home device manufacturing, healthcare device development, and weather forecasting or meteorological agencies. The new sensor architectures address specific client imperatives. These imperatives include green building initiatives, climate change monitoring, AI-driven automation, and Agriculture 4.0 execution. The adoption of these components leads to direct operational outcomes. These outcomes include smart home integration, comprehensive environmental monitoring, Industry 4.0 expansion, optimized HVAC operation, and precision regulation across chemical and pharmaceutical processes.
humidity-sensor-market Disruptions

Source: Secondary Research, Interviews with Experts, MarketsandMarkets Analysis

MARKET DYNAMICS

Drivers
Impact
Level
  • Increasing adoption in energy efficient HVAC and smart building automation
  • Stringent compliance standards across pharmaceutical storage and semiconductor cleanrooms
RESTRAINTS
Impact
Level
  • Performance degradation and measurement drift caused by chemical exposure or dust
  • Recurring calibration costs and downtime during periodic verification cycles
OPPORTUNITIES
Impact
Level
  • Integration of low power MEMS humidity sensors into IoT and wearable products
  • Adoption of printed and flexible sensors in agricultural monitoring and smart packaging
CHALLENGES
Impact
Level
  • Measurement error resulting from hysteresis and rapid temperature swings
  • Interface compatibility issues when retrofitting modern digital sensors into legacy control setups

Source: Secondary Research, Interviews with Experts, MarketsandMarkets Analysis

DRIVERS: Increasing adoption in energy efficient HVAC and smart building automation

Modern facilities integrate sensors into automated HVAC units to regulate heating, ventilation, and moisture levels in real time. This automated airflow control stabilizes indoor environments, ensures strict building standard compliance, and minimizes baseline energy waste across commercial properties.

RESTRAINTS: Performance degradation and measurement drift caused by chemical exposure or dust

Airborne pollutants, dust particles, and volatile chemical vapors coat the polymer and ceramic sensing layers over time. This continuous surface fouling alters electrical capacitance or resistance, creates baseline signal drift, degrades accuracy, and necessitates costly periodic sensor recalibration.

OPPORTUNITIES: Integration of low power MEMS humidity sensors into IoT and wearable products

Miniaturized microelectromechanical systems provide ultra compact footprints and minimal battery power consumption. These design characteristics allow consumer electronics developers to embed environmental monitoring nodes into connected smart home devices, health tracking wearables, and portable asset monitoring tags.

CHALLENGES: Measurement error resulting from hysteresis and rapid temperature swings

Sudden ambient temperature shifts and sorption desorption lag inside sensing films cause significant measurement distortion. Sensors often fail to restore baseline readings promptly after saturation, introducing persistent tracking errors that compromise precision in dynamic operating conditions.

HUMIDITY SENSOR MARKET SIZE, SHARE AND TRENDS: COMMERCIAL USE CASES ACROSS INDUSTRIES

COMPANY USE CASE DESCRIPTION BENEFITS
company logo
Amphenol deploys Telaire series humidity transmitters and ChipCap sensors for commercial HVAC systems and agricultural green houses. The devices monitor relative humidity and ambient temperature in high moisture air ducts, ventilation lines, and climate chambers. Features field replaceable sensing tips to eliminate recalibration factory returns | Provides IP67 water resistant enclosures for washdown zones | Delivers standard Modbus and analog outputs for direct building management integration | Reduces long term maintenance downtime
company logo
Honeywell integrates HumidIcon digital humidity and temperature sensors into medical ventilators, incubators, and server room climate modules. The components provide continuous digital measurement inside airflow delivery circuits and enclosed telecom cabinets. Combines relative humidity and temperature output on a single chip | Delivers low drift rates of 1.2 percent relative humidity over five years | Uses multilayer thermoset polymer coatings to resist dust and chemical exposure | Lowers overall board assembly component count.
company logo
Texas Instruments incorporates HDC series digital capacitive humidity sensors into smart thermostats, cold chain tracking tags, and industrial white goods. The ultra low power chips measure local relative humidity alongside integrated microcontrollers on local printed circuit boards. Minimizes battery consumption with sub microampere active draw modes | Features integrated internal micro heating elements to evaporate surface condensation | Delivers factory calibrated digital I2C output without external signal conditioning | Enables compact footprint layouts for portable instruments.
company logo
Setra Systems installs SRH series wall and duct mount humidity transmitters across pharmaceutical compounding suites, cleanrooms, and hospital isolation areas. The units operate alongside building automation controllers to verify positive pressure airflow and humidity thresholds. Maintains compliance with cleanroom regulatory documentation standards | Prevents pathogen transmission through precise environmental tracking | Provides dual BACnet and Modbus communication compatibility | Incorporates ceramic capacitive elements with protective coatings against cleaning chemicals.
company logo
Sensirion supplies SHT series CMOSens humidity and temperature sensors for automotive cabin anti-fogging systems and high volume consumer electronics. The integrated sensors monitor air intake humidity levels to feed predictive climate algorithm controllers. Delivers fast response times down to a few seconds | Integrates sensor element and signal processing on one silicon die | Supports automated high volume reflow soldering processes | Maintains low unit failure rates under severe automotive thermal cycling.

Logos and trademarks shown above are the property of their respective owners. Their use here is for informational and illustrative purposes only.

MARKET ECOSYSTEM

The humidity sensors ecosystem consists of raw material suppliers, sensor manufacturers, system integrators, component distributors, and end users. This structure forms a value chain supporting sensor component fabrication and commercial equipment deployment. Suppliers such as DuPont, Solvay, Evonik, 3M, Mitsubishi Chemical Group, and Avery Dennison supply core raw material inputs including polymers, chemical coatings, and specialized substrates. Sensor manufacturers including Texas Instruments, Honeywell, TE Connectivity, Amphenol Sensors, Sensirion, E+E Elektronik, Galltec Mela, Bosch, IST AG, and B+B Sensors fabricate these material inputs into sensing elements, digital integrated circuits, and packaged measurement modules. System integrators like Schneider Electric, Rockwell Automation, ABB, and Emerson manage equipment installation, software configuration, and automation integration to ensure continuous monitoring across operational facilities. Global distributors like DigiKey, Newark, Arrow, RS Components, and Mouser Electronics supply components to provide widespread product availability across international supply chains. End users deploy these tailored sensing instruments into daily operations across environmental monitoring solution providers, industrial process control solution providers, consumer electronics providers, healthcare and pharmaceutical solution providers, and agriculture solution providers.
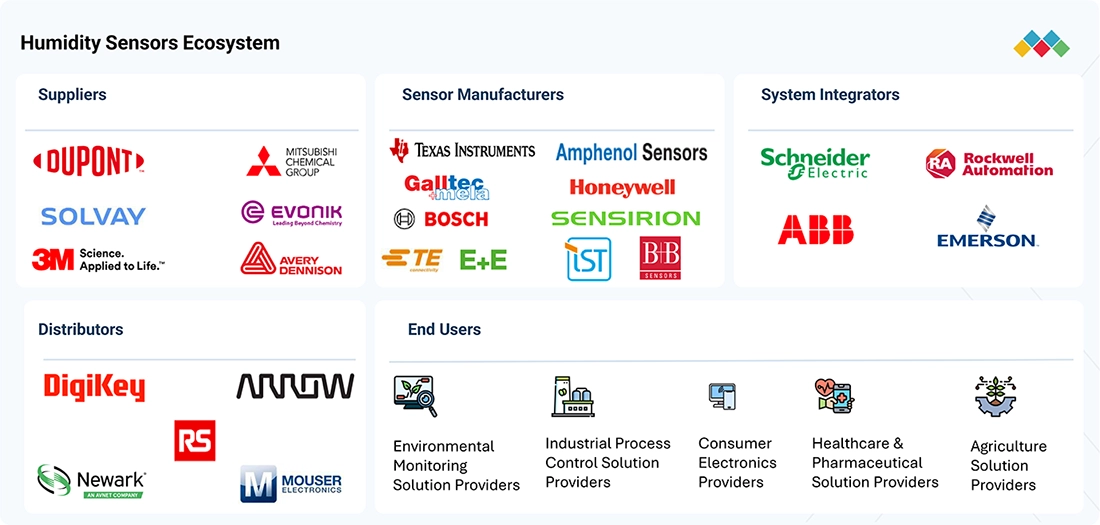
humidity-sensor-market Ecosystem

Logos and trademarks shown above are the property of their respective owners. Their use here is for informational and illustrative purposes only.

MARKET SEGMENTS
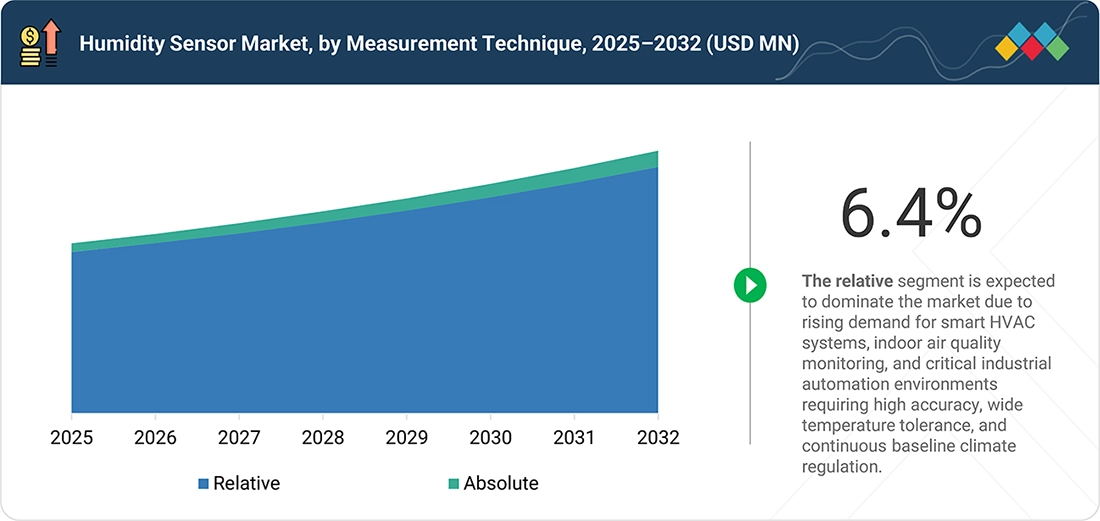
humidity-sensor-market Segments

Source: Secondary Research, Interviews with Experts, MarketsandMarkets Analysis

Humidity Sensor Market, By Type

The capacitive humidity sensor segment holds the largest share and is projected to register the fastest growth. This architecture operates by measuring capacitance changes across a thin polymer or ceramic dielectric layer, utilizing integrated CMOS signal processing circuits to deliver high measurement accuracy, long term stability, and low power consumption. Enterprises across HVAC systems, automotive cabin control, and medical equipment favor capacitive humidity sensors to execute precise climate regulation and maintain strict process tolerances.

Humidity Sensor Market, By Measurement Technique

The relative humidity segment dominates the humidity sensor market. This measurement technique provides an optimal balance between temperature dependent moisture tracking, measurement accuracy, and integration cost. It is widely adopted across HVAC systems, pharmaceutical storage areas, and automotive passenger cabins where continuous environmental monitoring is required without complex gas volume compensation instrumentation.

Humidity Sensor Market, By End User Application

The industrial process control segment holds the largest market share. Industrial facilities adopt dedicated humidity measurement instruments to monitor chemical reactions, cleanroom environments, and automated drying systems. Other expanding vertical sectors include heating ventilation and air conditioning, automotive, consumer electronics, healthcare, and precision agriculture.

Humidity Sensor Market, By Region

Asia Pacific accounts for the largest share of the global humidity sensor market. Dominance of this region is driven by high volume consumer electronics manufacturing, rapid industrial automation across China and India, alongside major investments in smart home and automotive production lines. Meanwhile, the region is also projected to maintain the fastest CAGR due to extensive smart city initiatives, expanding HVAC system installations, and growing government mandates for environmental monitoring across food processing and semiconductor facilities.

REGION

Asia Pacific is expected to be the fastest-growing humidity sensor market during the forecast period

Asia Pacific is expected to register the fastest CAGR in the humidity sensor market. This growth is due to the region's strong dominance in industrial manufacturing across China, Japan, South Korea, and India, coupled with global hubs for automotive assembly, smart HVAC installations, and electronics production. Countries across the region operate as major deployment centers for smart factories and high volume environmental automation. The region contains an established ecosystem of component manufacturers, system integrators, and semiconductor foundries. Increasing investments in IoT enabled appliances, agricultural automation, and cleanroom air regulation drive the demand for compact sensing nodes. Additionally, supportive government policies, green building efficiency mandates, and scalable domestic manufacturing capabilities accelerate overall regional market growth.
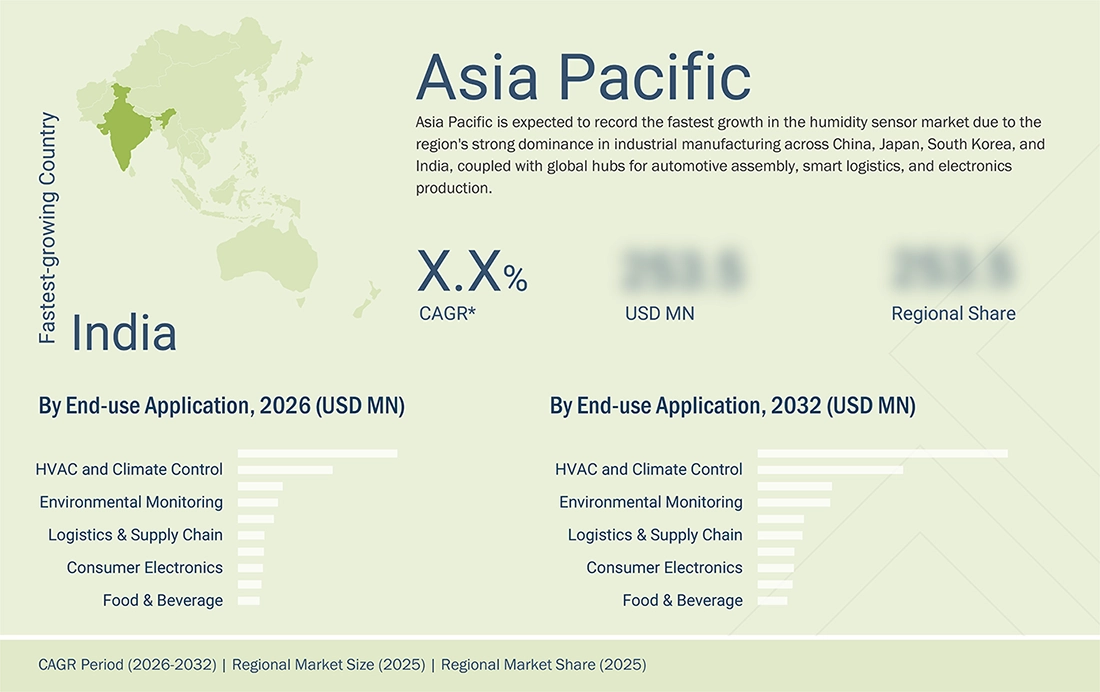
humidity-sensor-market Region

HUMIDITY SENSOR MARKET SIZE, SHARE AND TRENDS: COMPANY EVALUATION MATRIX

In the global humidity sensor market matrix, Amphenol Advanced Sensors (Star) maintains a significant market share and product footprint. The company provides a comprehensive portfolio of relative and absolute humidity sensing solutions, including its Telaire series transmitters and ChipCap integrated sensor architectures. These measurement components deliver low drift, field-swappable calibration, and high-precision environmental tracking across smart HVAC setups, healthcare systems, and industrial processing sectors. Bosch Sensortec (Emerging Leader) is expanding its market position through dedicated microelectromechanical systems (MEMS) technology. It provides compact digital humidity and temperature sensors integrated with consumer electronics, wearable devices, and smart home IoT platforms. This focused operational approach supports its market presence within the global humidity sensor sector.
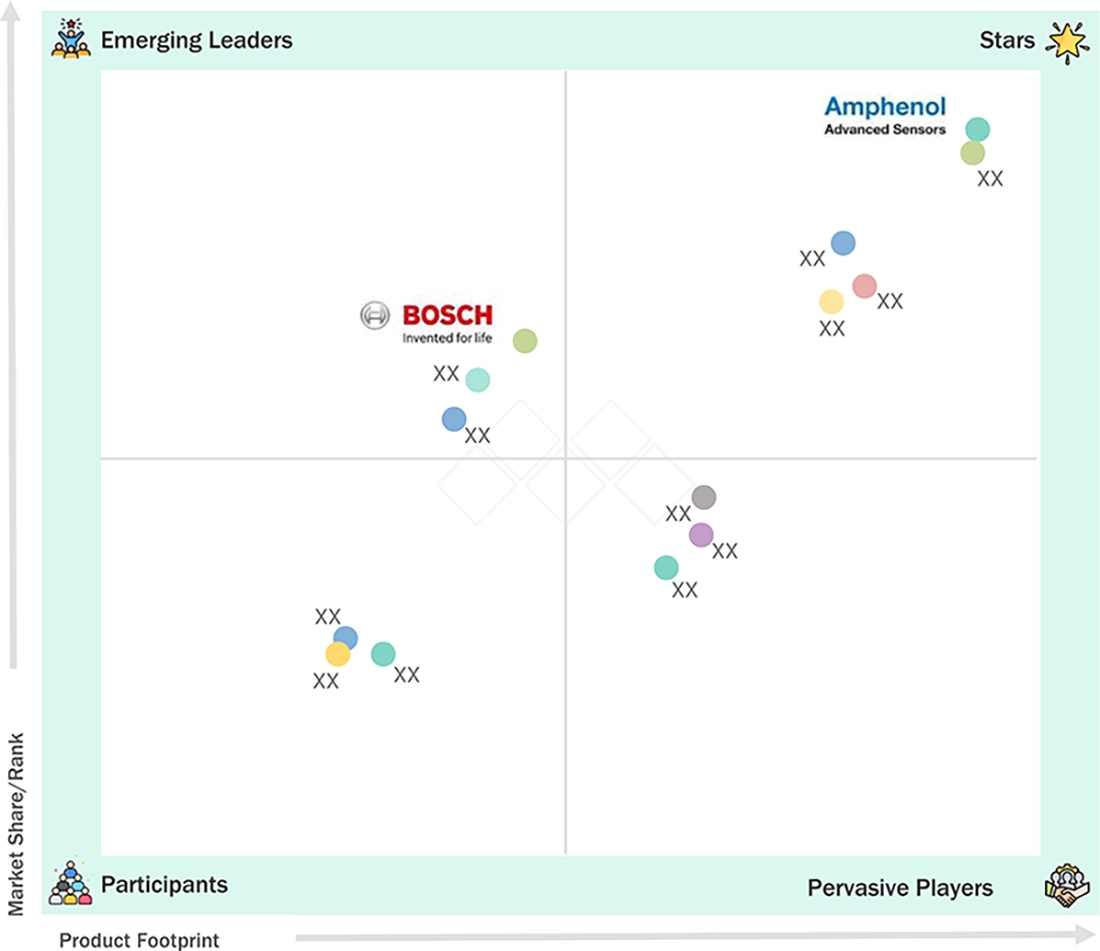
humidity-sensor-market Evaluation Metrics

Source: Secondary Research, Interviews with Experts, MarketsandMarkets Analysis

WHAT IS IN IT FOR YOU: HUMIDITY SENSOR MARKET SIZE, SHARE AND TRENDS REPORT CONTENT GUIDE
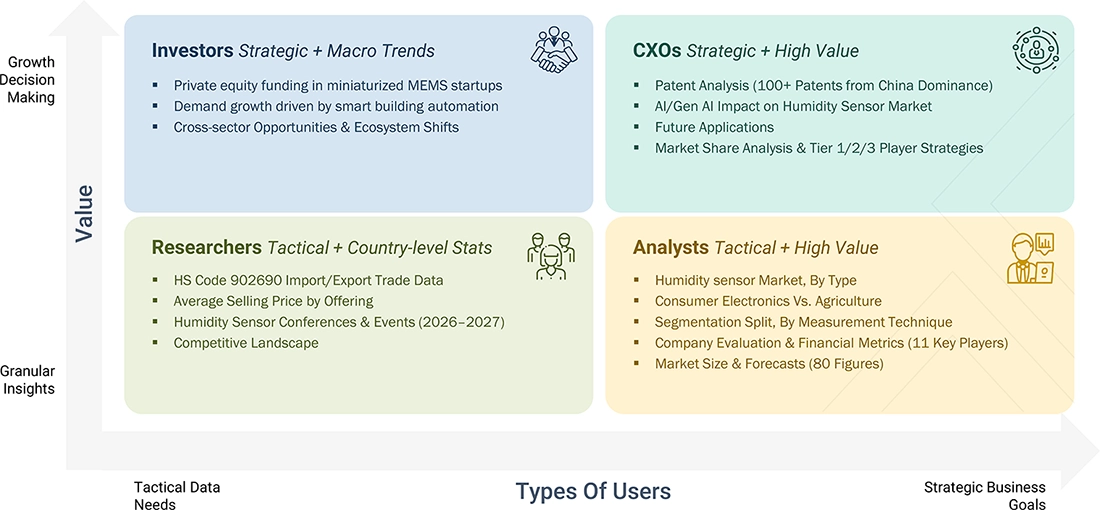
humidity-sensor-market Content Guide

DELIVERED CUSTOMIZATIONS

We have successfully delivered the following deep-dive customizations:

CLIENT REQUEST CUSTOMIZATION DELIVERED VALUE ADDS
Humidity Sensor Component & Material Manufacturer
  • Hardware level benchmarking of capacitive films, ceramic substrates, and CMOS signal ICs
  • Cost performance analysis for MEMS packaging and digital sensor dies
  • Process assessment for scaling cleanroom semiconductor fabrication
  • Supply chain evaluation for sourcing protective polymer coatings and lead frames
  • Differentiate products through specific sensing element and substrate selection
  • Identify cost reductions in wafer packaging workflows
  • Support integration into high volume production lines like automotive climate controllers
  • Enable strategic technology partnerships with industrial module makers
Humidity Sensor Module & Transmitter Vendor
  • Performance benchmarking of duct mount, wall mount, and probe transmitters across target industries
  • Design analysis for field replaceable and pre calibrated sensing tips
  • Competitor assessment against global industrial automation instrument vendors
  • Evaluation of hardware customization for building management system integrators
  • Maintain market position through specific transmitter and probe configurations
  • Identify demand from cleanrooms, food processing plants, and server rooms
  • Support building automation integration with BACnet and Modbus communication standards
  • Align product specifications with international accuracy and calibration requirements
Humidity Sensor End User (HVAC / Healthcare / Industrial Process Control)
  • Instrument benchmarking based on measurement tolerance, response time, long term drift, and hysteresis
  • Vendor landscape assessment across capacitive, resistive, and thermal conductivity technologies
  • Application mapping for continuous cleanroom monitoring and cold chain logistics
  • Evaluation of compliance with FDA 21 CFR Part 11 and ISO environmental standards
  • Enable vendor selection based on verified technical performance criteria
  • Reduce contamination and measurement drift risks with validated sensor packaging
  • Support facility environmental control and energy efficiency targets
  • Ensure regulatory compliance with documented traceability and calibration audits

RECENT DEVELOPMENTS

  • September 2026 : Sensirion announced the global commercial availability of its SEN62 environmental sensing platform. The compact module integrates humidity, temperature, and particulate matter measurement to simplify device engineering across smart home and HVAC applications.
  • March 2026 : Honeywell partnered with Boeing and the University of Reading on Project MIST to develop aircraft-based atmospheric humidity and water vapor sensors. The hardware program focuses on high frequency in flight observations to validate climate modeling and support contrail mitigation initiatives.


Table of Contents

checkmarkExclusive indicates content/data unique to MarketsandMarkets and not available with any competitors.

TITLE
PAGE NO
1
INTRODUCTION


23
2
EXECUTIVE SUMMARY


28
3
PREMIUM INSIGHTS


35
4
MARKET OVERVIEW
Explore booming demand for compact sensors amid legacy system challenges and cross-sector opportunities.


39
 
4.1
INTRODUCTION


4.2
MARKET DYNAMICS


4.2.1
DRIVERS


4.2.1.1
INCREASING DEMAND FOR EFFICIENT AND COMPACT SENSORS


4.2.1.2
RISING NEED FOR PRECISE ENVIRONMENTAL MONITORING SOLUTIONS


4.2.1.3
INCREASING REQUIREMENT FOR HUMIDITY CONTROL IN PRINTING PROCESSES


4.2.2
RESTRAINTS


4.2.2.1
INCOMPATIBILITY OF LEGACY SYSTEMS WITH CONTEMPORARY DIGITAL HUMIDITY SENSORS


4.2.2.2
SENSOR DRIFT AND OTHER PERFORMANCE ISSUES


4.2.3
OPPORTUNITIES


4.2.3.1
RAPID ADVANCES IN PRINTED HUMIDITY SENSORS


4.2.3.2
GROWING DEMAND FOR CALIBRATED HUMIDITY SENSORS FOR COST-EFFECTIVE APPLICATIONS


4.2.4
CHALLENGES


4.2.4.1
SENSOR DESIGN COMPLICATIONS DUE TO LACK OF UNIFORM STANDARDS


4.2.4.2
REQUIREMENT FOR SUBSTANTIAL INVESTMENTS IN ADVANCED MATERIALS AND SOPHISTICATED ENGINEERING APPROACHES


4.3
INTERCONNECTED MARKETS AND CROSS-SECTOR OPPORTUNITIES


4.4
STRATEGIC MOVES BY TIER 1/2/3 PLAYERS


5
INDUSTRY TRENDS
Navigate competitive pressures and emerging opportunities in the evolving global humidity sensor market.


48
 
5.1
PORTER’S FIVE FORCES ANALYSIS


5.1.1
THREAT OF NEW ENTRANTS


5.1.2
THREAT OF SUBSTITUTES


5.1.3
BARGAINING POWER OF SUPPLIERS


5.1.4
BARGAINING POWER OF BUYERS


5.1.5
INTENSITY OF COMPETITIVE RIVALRY


5.2
MACROECONOMIC OUTLOOK


5.2.1
INTRODUCTION


5.2.2
GDP TRENDS AND FORECAST


5.2.3
TRENDS IN GLOBAL INDUSTRIAL PROCESS CONTROL END-USE INDUSTRIES


5.2.4
TRENDS IN GLOBAL HVAC & CLIMATE CONTROL END-USE INDUSTRIES


5.2.5
TRENDS IN GLOBAL ENVIRONMENTAL MONITORING END-USE INDUSTRIES


5.3
VALUE CHAIN ANALYSIS


5.4
ECOSYSTEM ANALYSIS


5.5
PRICING ANALYSIS


5.5.1
AVERAGE SELLING PRICE OF HUMIDITY SENSORS OFFERED BY KEY PLAYERS, BY TYPE, 2025


5.5.2
AVERAGE SELLING PRICE TREND OF HUMIDITY SENSORS, BY REGION, 2022–2025


5.6
TRADE ANALYSIS


5.6.1
IMPORT SCENARIO (HS CODE 902690)


5.6.2
EXPORT SCENARIO (HS CODE 902690)


5.7
KEY CONFERENCES AND EVENTS, 2026–2027


5.8
TRENDS/DISRUPTIONS IMPACTING CUSTOMER BUSINESS


5.9
INVESTMENT AND FUNDING SCENARIO


5.10
CASE STUDY ANALYSIS


5.10.1
BIOPHARMACEUTICAL FACILITY INSTALLS SENSIRION DIGITAL HUMIDITY SENSORS TO OPTIMIZE CLEANROOM CLIMATE CONTROL


5.10.2
LSNE PHARMACEUTICAL FACILITY INSTALLS VAISALA HUMIDITY SENSING SYSTEM TO OPTIMIZE CLEANROOM ENVIRONMENTAL COMPLIANCE


5.10.3
EQUINIX DATA CENTER DEPLOYS VAISALA PRECISION HUMIDITY SENSORS TO OPTIMIZE COOLING EFFICIENCY AND UPTIME


5.10.4
AUTOMOTIVE OEM INTEGRATES SENSIRION DIGITAL HUMIDITY SENSORS TO OPTIMIZE CABIN CLIMATE CONTROL AND DEFOGGING EFFICIENCY


5.10.5
COMMERCIAL VERTICAL FARM INSTALLS VAISALA HUMIDITY AND TEMPERATURE TRANSMITTERS TO OPTIMIZE CROP TRANSPIRATION AND ENERGY EFFICIENCY


5.11
IMPACT OF 2025 US TARIFF – HUMIDITY SENSOR MARKET


5.11.1
INTRODUCTION


5.11.2
KEY TARIFF RATES


5.11.3
PRICE IMPACT ANALYSIS


5.11.4
IMPACT ON COUNTRIES/REGIONS


5.11.4.1
US


5.11.4.2
EUROPE


5.11.4.3
ASIA PACIFIC


5.11.5
IMPACT ON APPLICATIONS


6
TECHNOLOGICAL ADVANCEMENTS, AI-DRIVEN IMPACT, PATENTS, INNOVATIONS, AND FUTURE APPLICATIONS
AI-driven innovations transform humidity sensors, boosting predictive maintenance and smart calibration for industry leaders.


70
 
6.1
TECHNOLOGY ANALYSIS


6.1.1
KEY TECHNOLOGIES


6.1.1.1
GRAVIMETRIC HUMIDITY SENSING


6.1.1.2
NANOMATERIAL-BASED SENSORS


6.1.1.3
FLEXIBLE ELECTRONICS


6.1.2
COMPLEMENTARY TECHNOLOGIES


6.1.2.1
CALIBRATION TECHNOLOGIES


6.1.2.2
WIRELESS COMMUNICATION MODULES


6.1.3
ADJACENT TECHNOLOGIES


6.1.3.1
ENVIRONMENTAL SIMULATION CHAMBERS


6.2
TECHNOLOGY/PRODUCT ROADMAP


6.3
PATENT ANALYSIS


6.4
IMPACT OF AI/GEN AI ON HUMIDITY SENSOR MARKET


6.4.1
TOP USE CASES AND MARKET POTENTIAL


6.4.1.1
PREDICTIVE MAINTENANCE


6.4.1.2
QUALITY CONTROL IN MANUFACTURING


6.4.1.3
EARLY WARNING SYSTEMS


6.4.1.4
SMART CALIBRATION


6.4.1.5
ENERGY EFFICIENCY OPTIMIZATION


6.4.2
BEST PRACTICES FOLLOWED BY OEMS IN HUMIDITY SENSOR MARKET


6.4.3
CASE STUDIES RELATED TO AI/GEN AI IMPLEMENTATION IN HUMIDITY SENSOR MARKET


6.4.4
INTERCONNECTED ECOSYSTEM AND IMPACT ON MARKET PLAYERS


6.4.5
CLIENTS' READINESS TO ADOPT AI/GEN AI-INTEGRATED HUMIDITY SENSOR SOLUTIONS


6.5
SUCCESS STORIES AND REAL-WORLD APPLICATIONS


7
REGULATORY LANDSCAPE
Navigate complex global regulations with insights on key regional compliance and standards.


82
 
7.1
REGIONAL REGULATIONS AND COMPLIANCE


7.1.1
REGULATORY BODIES, GOVERNMENT AGENCIES, AND OTHER ORGANIZATIONS


7.1.2
STANDARDS


7.1.3
REGULATIONS


8
CUSTOMER LANDSCAPE & BUYER BEHAVIOR
Unlock hidden revenue by understanding stakeholder influence and unmet needs in end-use industries.


87
 
8.1
INTRODUCTION


8.2
DECISION-MAKING PROCESS


8.3
KEY STAKEHOLDERS INVOLVED IN BUYING PROCESS AND EVALUATION CRITERIA


8.3.1
KEY STAKEHOLDERS IN BUYING PROCESS


8.3.2
BUYING CRITERIA


8.4
ADOPTION BARRIERS AND INTERNAL CHALLENGES


8.5
UNMET NEEDS OF VARIOUS END-USE INDUSTRIES


8.6
MARKET PROFITABILITY


8.6.1
REVENUE POTENTIAL


8.6.2
COST DYNAMICS


8.6.3
MARGIN OPPORTUNITIES, BY END-USE INDUSTRY


9
HUMIDITY SENSING TECHNOLOGIES
Discover cutting-edge humidity sensors enhancing precision and connectivity across diverse applications.


95
 
9.1
INTRODUCTION


9.2
MEMS-BASED SENSORS


9.3
THIN-FILM SENSORS


9.4
PRINTED HUMIDITY SENSORS


9.5
WIRELESS SENSOR NODES


10
HUMIDITY SENSOR MARKET, BY TYPE
Market Size & Growth Rate Forecast Analysis to 2032 in USD Million | 10 Data Tables


97
 
10.1
INTRODUCTION


10.2
CAPACITIVE


10.2.1
HIGH ACCURACY AND LONG-TERM STABILITY TO SUPPORT SEGMENTAL GROWTH


10.3
RESISTIVE


10.3.1
COST-EFFECTIVE HUMIDITY MEASUREMENT FOR HVAC AND HOUSEHOLD APPLIANCES TO SUPPORT SEGMENTAL GROWTH


10.4
THERMAL


10.4.1
RELIABLE HUMIDITY MEASUREMENT IN HIGH-TEMPERATURE AND HIGH-HUMIDITY ENVIRONMENTS TO SUPPORT GROWTH


10.5
OTHER TYPES


11
HUMIDITY SENSOR MARKET, BY MEASUREMENT TECHNIQUE
Market Size & Growth Rate Forecast Analysis to 2032 in USD Million | 6 Data Tables


104
 
11.1
INTRODUCTION


11.2
ABSOLUTE


11.2.1
REQUIREMENT FOR PRECISE MOISTURE MONITORING IN INDUSTRIAL PROCESSES TO BOOST GROWTH


11.3
RELATIVE


11.3.1
COST-EFFECTIVE HUMIDITY MONITORING AND EASY INTEGRATION INTO HVAC SYSTEMS TO SUPPORT SEGMENTAL GROWTH


12
HUMIDITY SENSOR MARKET, BY END-USE APPLICATION
Market Size & Growth Rate Forecast Analysis to 2032 in USD Million and Units | 24 Data Tables


109
 
12.1
INTRODUCTION


12.2
ENVIRONMENTAL MONITORING


12.2.1
GROWING CONCERN ABOUT CLIMATE CHANGE AND AIR QUALITY MANAGEMENT TO AUGMENT SEGMENTAL GROWTH


12.2.1.1
AIR QUALITY MONITORING


12.2.1.2
WEATHER FORECASTING


12.3
HVAC & CLIMATE CONTROL


12.3.1
ENERGY-EFFICIENT HVAC SYSTEMS AND PRECISE HUMIDITY REGULATION TO DRIVE MARKET GROWTH


12.3.1.1
RESIDENTIAL & COMMERCIAL


12.3.1.2
INDUSTRIAL


12.4
INDUSTRIAL PROCESS CONTROL


12.4.1
RISING NEED FOR PRECISE HUMIDITY CONTROL IN MANUFACTURING AND CONTROLLED ENVIRONMENTS TO SUPPORT MARKET GROWTH


12.4.1.1
MANUFACTURING & PROCESS AUTOMATION


12.4.1.2
CLEANROOM & CONTROLLED ENVIRONMENT MONITORING


12.5
CONSUMER ELECTRONICS


12.5.1
GROWING ADOPTION OF CONNECTED SMART HOME DEVICES TO SUPPORT SEGMENTAL GROWTH


12.5.1.1
WEARABLES


12.5.1.2
SMART HOME DEVICES


12.6
HEALTHCARE & PHARMACEUTICALS


12.6.1
INCREASING NEED FOR CONTROLLED ENVIRONMENTS IN HEALTHCARE AND PHARMACEUTICAL APPLICATIONS TO SUPPORT SEGMENTAL GROWTH


12.6.1.1
COLD CHAIN MONITORING


12.6.1.2
INCUBATOR & HOSPITAL ENVIRONMENT MONITORING


12.6.1.3
STERILE ENVIRONMENT & CLEANROOM MONITORING


12.7
AGRICULTURE


12.7.1
INCREASING NEED FOR HUMIDITY CONTROL IN GREENHOUSES AND CROP STORAGE TO SUPPORT SEGMENTAL GROWTH


12.7.1.1
GREENHOUSE MONITORING


12.7.1.2
CROP STORAGE & PRESERVATION


12.8
AUTOMOTIVE


12.8.1
MOUNTING DEMAND FOR SMART VEHICLES AND ADVANCED TECHNOLOGIES TO FUEL SEGMENTAL GROWTH


12.8.1.1
CABIN CLIMATE CONTROL


12.8.1.2
DEFOGGING


12.8.1.3
ENGINE MANAGEMENT


12.9
FOOD & BEVERAGE


12.9.1
INCREASING ADOPTION OF HUMIDITY MONITORING IN FOOD STORAGE TO SUPPORT SEGMENTAL GROWTH


12.9.1.1
COLD STORAGE & FREEZERS


12.9.1.2
PROCESSING & PACKAGING QUALITY CONTROL


12.10
BUILDING & CONSTRUCTION


12.10.1
INCREASING NEED FOR HUMIDITY CONTROL IN MODERN BUILDINGS TO DRIVE SEGMENTAL GROWTH


12.10.1.1
INDOOR AIR QUALITY MONITORING


12.10.1.2
SMART BUILDING CLIMATE CONTROL


12.11
LOGISTICS & SUPPLY CHAIN


12.11.1
RISING NEED TO ENSURE OPTIMAL CONDITIONS FOR TEMPERATURE-SENSITIVE PRODUCTS TO SPUR DEMAND


12.11.1.1
COLD CHAIN TRANSPORTATION & MONITORING


12.11.1.2
PERISHABLE GOODS STORAGE & TRANSPORT


13
HUMIDITY SENSOR MARKET, BY REGION
Comprehensive coverage of 9 Regions with country-level deep-dive of 10 Countries | 66 Data Tables.


128
 
13.1
INTRODUCTION


13.2
NORTH AMERICA


13.2.1
US


13.2.1.1
RAPID TECHNOLOGICAL ADVANCES AND INDUSTRIAL DEVELOPMENT TO FOSTER MARKET GROWTH


13.2.2
CANADA


13.2.2.1
INCREASING IMPLEMENTATION OF STRINGENT ENERGY EFFICIENCY REGULATIONS TO DRIVE MARKET


13.2.3
MEXICO


13.2.3.1
INCREASING VEHICLE MANUFACTURING AND EXPORT ACTIVITIES TO CONTRIBUTE TO MARKET GROWTH


13.3
EUROPE


13.3.1
UK


13.3.1.1
INCREASING REQUIREMENTS FOR ENVIRONMENTAL MONITORING IN PHARMACEUTICAL STORAGE TO SUPPORT MARKET GROWTH


13.3.2
GERMANY


13.3.2.1
INCREASING FOCUS ON ENERGY-EFFICIENT BUILDINGS TO SUPPORT MARKET GROWTH


13.3.3
FRANCE


13.3.3.1
INCREASING DEPLOYMENT OF SMART BUILDING TECHNOLOGIES TO FUEL MARKET GROWTH


13.3.4
NORDICS


13.3.4.1
GROWING FOCUS ON SUSTAINABLE FARMING PRACTICES TO AUGMENT MARKET GROWTH


13.3.5
REST OF EUROPE


13.4
ASIA PACIFIC


13.4.1
CHINA


13.4.1.1
RISING CONSUMER ELECTRONICS MANUFACTURING TO BOOST MARKET GROWTH


13.4.2
JAPAN


13.4.2.1
EXPANDING USE OF SENSOR-BASED FARMING TECHNOLOGIES TO SUPPORT MARKET GROWTH


13.4.3
INDIA


13.4.3.1
MOUNTING DEMAND FOR ENERGY-EFFICIENT SOLUTIONS TO BOLSTER MARKET GROWTH


13.4.4
SOUTH KOREA


13.4.4.1
INCREASING DEMAND FOR PRECISION ENVIRONMENTAL MONITORING TO SUPPORT MARKET GROWTH


13.4.5
REST OF ASIA PACIFIC


13.5
ROW


13.5.1
SOUTH AMERICA


13.5.1.1
RISING ADOPTION OF PRECISION FARMING TECHNOLOGIES TO ACCELERATE MARKET GROWTH


13.5.2
MIDDLE EAST


13.5.2.1
RAPID INDUSTRIALIZATION AND TECHNOLOGICAL ADVANCES TO FUEL MARKET GROWTH


13.5.2.2
GCC COUNTRIES


13.5.2.3
REST OF MIDDLE EAST


13.5.3
AFRICA


13.5.3.1
INCREASING NEED FOR EFFECTIVE ENVIRONMENTAL MONITORING SOLUTIONS TO BOOST MARKET GROWTH


14
COMPETITIVE LANDSCAPE
Discover strategic moves shaping market dominance and valuation shifts among key industry players.


165
 
14.1
OVERVIEW


14.2
KEY PLAYER STRATEGIES/RIGHT TO WIN, JANUARY 2023– SEPTEMBER 2026


14.3
REVENUE ANALYSIS, 2021–2025


14.4
MARKET SHARE ANALYSIS, 2025


14.5
COMPANY VALUATION AND FINANCIAL METRICS


14.6
BRAND COMPARISON


14.7
COMPANY EVALUATION MATRIX: KEY PLAYERS, 2025


14.7.1
STARS


14.7.2
EMERGING LEADERS


14.7.3
PERVASIVE PLAYERS


14.7.4
PARTICIPANTS


14.7.5
COMPANY FOOTPRINT: KEY PLAYERS, 2025


14.7.5.1
COMPANY FOOTPRINT


14.7.5.2
REGION FOOTPRINT


14.7.5.3
TYPE FOOTPRINT


14.7.5.4
MEASUREMENT TECHNIQUE FOOTPRINT


14.7.5.5
END-USE APPLICATION FOOTPRINT


14.8
COMPANY EVALUATION MATRIX: STARTUPS/SMES, 2025


14.8.1
PROGRESSIVE COMPANIES


14.8.2
RESPONSIVE COMPANIES


14.8.3
DYNAMIC COMPANIES


14.8.4
STARTING BLOCKS


14.8.5
COMPETITIVE BENCHMARKING: STARTUPS/SMES, 2025


14.8.5.1
DETAILED LIST OF KEY STARTUPS/SMES


14.8.5.2
COMPETITIVE BENCHMARKING OF KEY STARTUPS/SMES


14.9
COMPETITIVE SCENARIO


14.9.1
PRODUCT LAUNCHES


14.9.2
DEALS


15
COMPANY PROFILES
In-depth Company Profiles of Leading Market Players with detailed Business Overview, Product and Service Portfolio, Recent Developments, and Unique Analyst Perspective (MnM View)


185
 
15.1
KEY PLAYERS


15.1.1
AMPHENOL CORPORATION


15.1.1.1
BUSINESS OVERVIEW


15.1.1.2
PRODUCTS/SOLUTIONS/SERVICES OFFERED


15.1.1.3
RECENT DEVELOPMENTS


15.1.1.3.1
DEALS


15.1.1.4
MNM VIEW


15.1.1.4.1
KEY STRENGTHS/RIGHT TO WIN


15.1.1.4.2
STRATEGIC CHOICES


15.1.1.4.3
WEAKNESSES/COMPETITIVE THREATS


15.1.2
HONEYWELL INTERNATIONAL INC.


15.1.3
TEXAS INSTRUMENTS INCORPORATED


15.1.4
SETRA SYSTEMS


15.1.5
SENSIRION AG


15.1.6
TE CONNECTIVITY


15.1.7
SIEMENS


15.1.8
TERACOM


15.1.9
BOSCH SENSORTEC GMBH


15.1.10
SCHNEIDER ELECTRIC


15.1.11
RENESAS ELECTRONICS CORPORATION


15.2
OTHER PLAYERS


15.2.1
B+B THERMO-TECHNIK GMBH


15.2.2
E+E ELEKTRONIK GES.M.B.H.


15.2.3
IST AG


15.2.4
HUNAN RIKA ELECTRONIC TECH CO., LTD


15.2.5
DICKSON


15.2.6
GALLTEC MESS- UND REGELTECHNIK GMBH


15.2.7
PCE HOLDING GMBH


15.2.8
SUNSUI PROCESS SYSTEM


15.2.9
PRESSAC COMMUNICATIONS LIMITED


15.2.10
SMART FOG


15.2.11
WINSEN


15.2.12
KELE PRECISION MANUFACTURING


15.2.13
RAYSTEK PROCESS INSTRUMENTS


15.2.14
AHLBORN


15.2.15
SHANDONG RENKE CONTROL TECHNOLOGY CO., LTD.


15.2.16
AVTECH SOFTWARE, INC.


15.2.17
NOVOSENSE


16
RESEARCH METHODOLOGY


238
 
16.1
RESEARCH DATA


16.1.1
SECONDARY DATA


16.1.1.1
LIST OF KEY SECONDARY SOURCES


16.1.1.2
KEY DATA FROM SECONDARY SOURCES


16.1.2
PRIMARY DATA


16.1.2.1
LIST OF PRIMARY INTERVIEW PARTICIPANTS


16.1.2.2
BREAKDOWN OF PRIMARY INTERVIEWS


16.1.2.3
KEY DATA FROM PRIMARY SOURCES


16.1.2.4
KEY INDUSTRY INSIGHTS


16.1.3
SECONDARY AND PRIMARY RESEARCH


16.2
MARKET SIZE ESTIMATION


16.2.1
BOTTOM-UP APPROACH


16.2.1.1
APPROACH TO ARRIVE AT MARKET SIZE USING BOTTOM-UP ANALYSIS (DEMAND SIDE)


16.2.2
TOP-DOWN APPROACH


16.2.2.1
APPROACH TO ARRIVE AT MARKET SIZE USING TOP-DOWN ANALYSIS (SUPPLY SIDE)


16.3
FACTOR ANALYSIS


16.3.1
DEMAND-SIDE ANALYSIS


16.3.2
SUPPLY-SIDE ANALYSIS


16.4
MARKET BREAKDOWN AND DATA TRIANGULATION


16.5
RESEARCH ASSUMPTIONS


16.6
RISK ANALYSIS


16.7
RESEARCH LIMITATIONS


17
APPENDIX


250
 
17.1
KNOWLEDGESTORE: MARKETSANDMARKETS’ SUBSCRIPTION PORTAL


17.2
CUSTOMIZATION OPTIONS


17.3
RELATED REPORTS


17.4
AUTHOR DETAILS


LIST OF TABLES


TABLE 1
HUMIDITY SENSOR MARKET: INCLUSIONS AND EXCLUSIONS


TABLE 2
HUMIDITY SENSOR MARKET: SUMMARY OF CHANGES


TABLE 3
INTERCONNECTED MARKETS AND CROSS-SECTOR OPPORTUNITIES RELATED TO HUMIDITY SENSOR


TABLE 4
STRATEGIC FOCUS ON MAJOR COMPANIES IN HUMIDITY SENSOR MARKET


TABLE 5
PORTER’S FIVE FORCES ANALYSIS


TABLE 6
GDP GROWTH RATES, BY COUNTRY, 2021–2030 (%)


TABLE 7
ROLE OF COMPANIES IN HUMIDITY SENSOR ECOSYSTEM


TABLE 8
AVERAGE SELLING PRICE OF HUMIDITY SENSORS OFFERED BY KEY PLAYERS, BY TYPE, 2025 (USD)


TABLE 9
AVERAGE SELLING PRICE TREND OF HUMIDITY SENSORS, BY REGION, 2022–2025 (USD)


TABLE 10
IMPORT DATA FOR HS CODE 902690-COMPLIANT PRODUCTS, BY COUNTRY, 2021–2025 (USD MILLION)


TABLE 11
EXPORT DATA FOR HS CODE 902690-COMPLIANT PRODUCTS, BY COUNTRY, 2021–2025 (USD MILLION)


TABLE 12
LIST OF KEY CONFERENCES AND EVENTS, 2026–2027


TABLE 13
SENSIRION DIGITAL HUMIDITY AND TEMPERATURE SENSORS INSTALLED TO OPTIMIZE CLEANROOM ENVIRONMENTAL ACCURACY AND ENERGY EFFICIENCY


TABLE 14
VAISALA CONTINUOUS MONITORING SYSTEM INSTALLED TO OPTIMIZE HUMIDITY ACCURACY AND GXP COMPLIANCE


TABLE 15
VAISALA INDUSTRIAL HUMIDITY SENSING PROBES INSTALLED TO OPTIMIZE CRAC UNIT OPERATION AND POWER USAGE EFFECTIVENESS


TABLE 16
SENSIRION AUTOMOTIVE GRADE HUMIDITY AND TEMPERATURE SENSORS INSTALLED TO PREVENT WINDSHIELD FOGGING AND OPTIMIZE HVAC ENERGY CONSUMPTION


TABLE 17
VAISALA INDUSTRIAL HUMIDITY SENSORS INSTALLED TO CONTROL CANOPY MICROCLIMATE AND REDUCE DEHUMIDIFICATION COSTS


TABLE 18
US-ADJUSTED RECIPROCAL TARIFF RATES, 2025


TABLE 19
LIST OF KEY PATENTS, 2017–2026


TABLE 20
BEST PRACTICES FOLLOWED BY COMPANIES IN HUMIDITY SENSOR MARKET


TABLE 21
CASE STUDIES RELATED TO AI/GEN AI IMPLEMENTATION


TABLE 22
INTERCONNECTED ECOSYSTEM AND IMPACT ON HUMIDITY SENSOR MARKET PLAYERS


TABLE 23
NORTH AMERICA: REGULATORY BODIES, GOVERNMENT AGENCIES, AND OTHER ORGANIZATIONS


TABLE 24
EUROPE: REGULATORY BODIES, GOVERNMENT AGENCIES, AND OTHER ORGANIZATIONS


TABLE 25
ASIA PACIFIC: REGULATORY BODIES, GOVERNMENT AGENCIES, AND OTHER ORGANIZATIONS


TABLE 26
ROW: REGULATORY BODIES, GOVERNMENT AGENCIES, AND OTHER ORGANIZATIONS


TABLE 27
INFLUENCE OF STAKEHOLDERS ON BUYING PROCESS FOR TOP THREE END-USE INDUSTRIES (%)


TABLE 28
KEY BUYING CRITERIA FOR TOP THREE END-USE INDUSTRIES


TABLE 29
HUMIDITY SENSOR ADOPTION BARRIERS AND INTERNAL CHALLENGES


TABLE 30
UNMET NEEDS IN HUMIDITY SENSOR MARKET, BY END-USE INDUSTRY


TABLE 31
HUMIDITY SENSOR MARKET, BY TYPE, 2022–2025 (USD MILLION)


TABLE 32
HUMIDITY SENSOR MARKET, BY TYPE, 2026–2032 (USD MILLION)


TABLE 33
CAPACITIVE: HUMIDITY SENSOR MARKET, BY REGION, 2022–2025 (USD MILLION)


TABLE 34
CAPACITIVE: HUMIDITY SENSOR MARKET, BY REGION, 2026–2032 (USD MILLION)


TABLE 35
RESISTIVE: HUMIDITY SENSOR MARKET, BY REGION, 2022–2025 (USD MILLION)


TABLE 36
RESISTIVE: HUMIDITY SENSOR MARKET, BY REGION, 2026–2032 (USD MILLION)


TABLE 37
THERMAL: HUMIDITY SENSOR MARKET, BY REGION, 2022–2025 (USD MILLION)


TABLE 38
THERMAL: HUMIDITY SENSOR MARKET, BY REGION, 2026–2032 (USD MILLION)


TABLE 39
OTHER TYPES: HUMIDITY SENSOR MARKET, BY REGION, 2022–2025 (USD MILLION)


TABLE 40
OTHER TYPES: HUMIDITY SENSOR MARKET, BY REGION, 2026–2032 (USD MILLION)


TABLE 41
HUMIDITY SENSOR MARKET, BY MEASUREMENT TECHNIQUE, 2022–2025 (USD MILLION)


TABLE 42
HUMIDITY SENSOR MARKET, BY MEASUREMENT TECHNIQUE, 2026–2032 (USD MILLION)


TABLE 43
ABSOLUTE: HUMIDITY SENSOR MARKET, BY REGION, 2022–2025 (USD MILLION)


TABLE 44
ABSOLUTE: HUMIDITY SENSOR MARKET, BY REGION, 2026–2032 (USD MILLION)


TABLE 45
RELATIVE: HUMIDITY SENSOR MARKET, BY REGION, 2022–2025 (USD MILLION)


TABLE 46
RELATIVE: HUMIDITY SENSOR MARKET, BY REGION, 2026–2032 (USD MILLION)


TABLE 47
HUMIDITY SENSOR MARKET, BY END-USE APPLICATION, 2022–2025 (USD MILLION)


TABLE 48
HUMIDITY SENSOR MARKET, BY END-USE APPLICATION, 2026–2032 (USD MILLION)


TABLE 49
HUMIDITY SENSOR MARKET, BY END-USE APPLICATION, 2022–2025 (MILLION UNITS)


TABLE 50
HUMIDITY SENSOR MARKET, BY END-USE APPLICATION, 2026–2032 (MILLION UNITS)


TABLE 51
ENVIRONMENTAL MONITORING: HUMIDITY SENSOR MARKET, BY REGION, 2022–2025 (USD MILLION)


TABLE 52
ENVIRONMENTAL MONITORING: HUMIDITY SENSOR MARKET, BY REGION, 2026–2032 (USD MILLION)


TABLE 53
HVAC & CLIMATE CONTROL: HUMIDITY SENSOR MARKET, BY REGION, 2022–2025 (USD MILLION)


TABLE 54
HVAC & CLIMATE CONTROL: HUMIDITY SENSOR MARKET, BY REGION, 2026–2032 (USD MILLION)


TABLE 55
INDUSTRIAL PROCESS CONTROL: HUMIDITY SENSOR MARKET, BY REGION, 2022–2025 (USD MILLION)


TABLE 56
INDUSTRIAL PROCESS CONTROL: HUMIDITY SENSOR MARKET, BY REGION, 2026–2032 (USD MILLION)


TABLE 57
CONSUMER ELECTRONICS: HUMIDITY SENSOR MARKET, BY REGION, 2022–2025 (USD MILLION)


TABLE 58
CONSUMER ELECTRONICS: HUMIDITY SENSOR MARKET, BY REGION, 2026–2032 (USD MILLION)


TABLE 59
HEALTHCARE & PHARMACEUTICALS: HUMIDITY SENSOR MARKET, BY REGION, 2022–2025 (USD MILLION)


TABLE 60
HEALTHCARE & PHARMACEUTICALS: HUMIDITY SENSOR MARKET, BY REGION, 2026–2032 (USD MILLION)


TABLE 61
AGRICULTURE: HUMIDITY SENSOR MARKET, BY REGION, 2022–2025 (USD MILLION)


TABLE 62
AGRICULTURE: HUMIDITY SENSOR MARKET, BY REGION, 2026–2032 (USD MILLION)


TABLE 63
AUTOMOTIVE: HUMIDITY SENSOR MARKET, BY REGION, 2022–2025 (USD MILLION)


TABLE 64
AUTOMOTIVE: HUMIDITY SENSOR MARKET, BY REGION, 2026–2032 (USD MILLION)


TABLE 65
FOOD & BEVERAGE: HUMIDITY SENSOR MARKET, BY REGION, 2022–2025 (USD MILLION)


TABLE 66
FOOD & BEVERAGE: HUMIDITY SENSOR MARKET, BY REGION, 2026–2032 (USD MILLION)


TABLE 67
BUILDING & CONSTRUCTION: HUMIDITY SENSOR MARKET, BY REGION, 2022–2025 (USD MILLION)


TABLE 68
BUILDING & CONSTRUCTION: HUMIDITY SENSOR MARKET, BY REGION, 2026–2032 (USD MILLION)


TABLE 69
LOGISTICS & SUPPLY CHAIN: HUMIDITY SENSOR MARKET, BY REGION, 2022–2025 (USD MILLION)


TABLE 70
LOGISTICS & SUPPLY CHAIN: HUMIDITY SENSOR MARKET, BY REGION, 2026–2032 (USD MILLION)


TABLE 71
HUMIDITY SENSOR MARKET, BY REGION, 2022–2025 (USD MILLION)


TABLE 72
HUMIDITY SENSOR MARKET, BY REGION, 2026–2032 (USD MILLION)


TABLE 73
NORTH AMERICA: HUMIDITY SENSOR MARKET, BY COUNTRY, 2022–2025 (USD MILLION)


TABLE 74
NORTH AMERICA: HUMIDITY SENSOR MARKET, BY COUNTRY, 2026–2032 (USD MILLION)


TABLE 75
NORTH AMERICA: HUMIDITY SENSOR MARKET, BY END-USE APPLICATION, 2022–2025 (USD MILLION)


TABLE 76
NORTH AMERICA: HUMIDITY SENSOR MARKET, BY END-USE APPLICATION, 2026–2032 (USD MILLION)


TABLE 77
NORTH AMERICA: HUMIDITY SENSOR MARKET, BY TYPE, 2022–2025 (USD MILLION)


TABLE 78
NORTH AMERICA: HUMIDITY SENSOR MARKET, BY TYPE, 2026–2032 (USD MILLION)


TABLE 79
NORTH AMERICA: HUMIDITY SENSOR MARKET, BY MEASUREMENT TECHNIQUE, 2022–2025 (USD MILLION)


TABLE 80
NORTH AMERICA: HUMIDITY SENSOR MARKET, BY MEASUREMENT TECHNIQUE, 2026–2032 (USD MILLION)


TABLE 81
US: HUMIDITY SENSOR MARKET, BY TYPE, 2022–2025 (USD MILLION)


TABLE 82
US: HUMIDITY SENSOR MARKET, BY TYPE, 2026–2032 (USD MILLION)


TABLE 83
CANADA: HUMIDITY SENSOR MARKET, BY TYPE, 2022–2025 (USD MILLION)


TABLE 84
CANADA: HUMIDITY SENSOR MARKET, BY TYPE, 2026–2032 (USD MILLION)


TABLE 85
MEXICO: HUMIDITY SENSOR MARKET, BY TYPE, 2022–2025 (USD MILLION)


TABLE 86
MEXICO: HUMIDITY SENSOR MARKET, BY TYPE, 2026–2032 (USD MILLION)


TABLE 87
EUROPE: HUMIDITY SENSOR MARKET, BY COUNTRY, 2022–2025 (USD MILLION)


TABLE 88
EUROPE: HUMIDITY SENSOR MARKET, BY COUNTRY, 2026–2032 (USD MILLION)


TABLE 89
EUROPE: HUMIDITY SENSOR MARKET, BY END-USE APPLICATION, 2022–2025 (USD MILLION)


TABLE 90
EUROPE: HUMIDITY SENSOR MARKET, BY END-USE APPLICATION, 2026–2032 (USD MILLION)


TABLE 91
EUROPE: HUMIDITY SENSOR MARKET, BY TYPE, 2022–2025 (USD MILLION)


TABLE 92
EUROPE: HUMIDITY SENSOR MARKET, BY TYPE, 2026–2032 (USD MILLION)


TABLE 93
EUROPE: HUMIDITY SENSOR MARKET, BY MEASUREMENT TECHNIQUE, 2022–2025 (USD MILLION)


TABLE 94
EUROPE: HUMIDITY SENSOR MARKET, BY MEASUREMENT TECHNIQUE, 2026–2032 (USD MILLION)


TABLE 95
UK: HUMIDITY SENSOR MARKET, BY TYPE, 2022–2025 (USD MILLION)


TABLE 96
UK: HUMIDITY SENSOR MARKET, BY TYPE, 2026–2032 (USD MILLION)


TABLE 97
GERMANY: HUMIDITY SENSOR MARKET, BY TYPE, 2022–2025 (USD MILLION)


TABLE 98
GERMANY: HUMIDITY SENSOR MARKET, BY TYPE, 2026–2032 (USD MILLION)


TABLE 99
FRANCE: HUMIDITY SENSOR MARKET, BY TYPE, 2022–2025 (USD MILLION)


TABLE 100
FRANCE: HUMIDITY SENSOR MARKET, BY TYPE, 2026–2032 (USD MILLION)


TABLE 101
NORDICS: HUMIDITY SENSOR MARKET, BY TYPE, 2022–2025 (USD MILLION)


TABLE 102
NORDICS: HUMIDITY SENSOR MARKET, BY TYPE, 2026–2032 (USD MILLION)


TABLE 103
REST OF EUROPE: HUMIDITY SENSOR MARKET, BY TYPE, 2022–2025 (USD MILLION)


TABLE 104
REST OF EUROPE: HUMIDITY SENSOR MARKET, BY TYPE, 2026–2032 (USD MILLION)


TABLE 105
ASIA PACIFIC: HUMIDITY SENSOR MARKET, BY COUNTRY, 2022–2025 (USD MILLION)


TABLE 106
ASIA PACIFIC: HUMIDITY SENSOR MARKET, BY COUNTRY, 2026–2032 (USD MILLION)


TABLE 107
ASIA PACIFIC: HUMIDITY SENSOR MARKET, BY END-USE APPLICATION, 2022–2025 (USD MILLION)


TABLE 108
ASIA PACIFIC: HUMIDITY SENSOR MARKET, BY END-USE APPLICATION, 2026–2032 (USD MILLION)


TABLE 109
ASIA PACIFIC: HUMIDITY SENSOR MARKET, BY TYPE, 2022–2025 (USD MILLION)


TABLE 110
ASIA PACIFIC: HUMIDITY SENSOR MARKET, BY TYPE, 2026–2032 (USD MILLION)


TABLE 111
ASIA PACIFIC: HUMIDITY SENSOR MARKET, BY MEASUREMENT TECHNIQUE, 2022–2025 (USD MILLION)


TABLE 112
ASIA PACIFIC: HUMIDITY SENSOR MARKET, BY MEASUREMENT TECHNIQUE, 2026–2032 (USD MILLION)


TABLE 113
CHINA: HUMIDITY SENSOR MARKET, BY TYPE, 2022–2025 (USD MILLION)


TABLE 114
CHINA: HUMIDITY SENSOR MARKET, BY TYPE, 2026–2032 (USD MILLION)


TABLE 115
JAPAN: HUMIDITY SENSOR MARKET, BY TYPE, 2022–2025 (USD MILLION)


TABLE 116
JAPAN: HUMIDITY SENSOR MARKET, BY TYPE, 2026–2032 (USD MILLION)


TABLE 117
INDIA: HUMIDITY SENSOR MARKET, BY TYPE, 2022–2025 (USD MILLION)


TABLE 118
INDIA: HUMIDITY SENSOR MARKET, BY TYPE, 2026–2032 (USD MILLION)


TABLE 119
SOUTH KOREA: HUMIDITY SENSOR MARKET, BY TYPE, 2022–2025 (USD MILLION)


TABLE 120
SOUTH KOREA: HUMIDITY SENSOR MARKET, BY TYPE, 2026–2032 (USD MILLION)


TABLE 121
REST OF ASIA PACIFIC: HUMIDITY SENSOR MARKET, BY TYPE, 2022–2025 (USD MILLION)


TABLE 122
REST OF ASIA PACIFIC: HUMIDITY SENSOR MARKET, BY TYPE, 2026–2032 (USD MILLION)


TABLE 123
ROW: HUMIDITY SENSOR MARKET, BY REGION, 2022–2025 (USD MILLION)


TABLE 124
ROW: HUMIDITY SENSOR MARKET, BY REGION, 2026–2032 (USD MILLION)


TABLE 125
ROW: HUMIDITY SENSOR MARKET, BY END-USE APPLICATION, 2022–2025 (USD MILLION)


TABLE 126
ROW: HUMIDITY SENSOR MARKET, BY END-USE APPLICATION, 2026–2032 (USD MILLION)


TABLE 127
ROW: HUMIDITY SENSOR MARKET, BY TYPE, 2022–2025 (USD MILLION)


TABLE 128
ROW: HUMIDITY SENSOR MARKET, BY TYPE, 2026–2032 (USD MILLION)


TABLE 129
ROW: HUMIDITY SENSOR MARKET, BY MEASUREMENT TECHNIQUE, 2022–2025 (USD MILLION)


TABLE 130
ROW: HUMIDITY SENSOR MARKET, BY MEASUREMENT TECHNIQUE, 2026–2032 (USD MILLION)


TABLE 131
SOUTH AMERICA: HUMIDITY SENSOR MARKET, BY TYPE, 2022–2025 (USD MILLION)


TABLE 132
SOUTH AMERICA: HUMIDITY SENSOR MARKET, BY TYPE, 2026–2032 (USD MILLION)


TABLE 133
MIDDLE EAST: HUMIDITY SENSOR MARKET, BY TYPE, 2022–2025 (USD MILLION)


TABLE 134
MIDDLE EAST: HUMIDITY SENSOR MARKET, BY TYPE, 2026–2032 (USD MILLION)


TABLE 135
AFRICA: HUMIDITY SENSOR MARKET, BY TYPE, 2022–2025 (USD MILLION)


TABLE 136
AFRICA: HUMIDITY SENSOR MARKET, BY TYPE, 2026–2032 (USD MILLION)


TABLE 137
HUMIDITY SENSOR MARKET: OVERVIEW OF STRATEGIES ADOPTED BY KEY PLAYERS, JANUARY 2023 TO SEPTEMBER 2026


TABLE 138
HUMIDITY SENSOR MARKET: DEGREE OF COMPETITION, 2025


TABLE 139
HUMIDITY SENSOR MARKET: REGION FOOTPRINT


TABLE 140
HUMIDITY SENSOR MARKET: TYPE FOOTPRINT


TABLE 141
HUMIDITY SENSOR MARKET: MEASUREMENT TECHNIQUE FOOTPRINT


TABLE 142
HUMIDITY SENSOR MARKET: END-USE APPLICATION FOOTPRINT


TABLE 143
HUMIDITY SENSOR MARKET: DETAILED LIST OF KEY STARTUPS/SMES


TABLE 144
HUMIDITY SENSOR MARKET: COMPETITIVE BENCHMARKING OF KEY STARTUPS/SMES


TABLE 145
HUMIDITY SENSOR MARKET: PRODUCT LAUNCHES, JANUARY 2023–SEPTEMBER 2026


TABLE 146
HUMIDITY SENSOR MARKET: DEALS, JANUARY 2023–SEPTEMBER 2026


TABLE 147
AMPHENOL CORPORATION: COMPANY OVERVIEW


TABLE 148
AMPHENOL CORPORATION: PRODUCTS/SOLUTIONS/SERVICES OFFERED


TABLE 149
AMPHENOL CORPORATION: DEALS


TABLE 150
HONEYWELL INTERNATIONAL INC.: COMPANY OVERVIEW


TABLE 151
HONEYWELL INTERNATIONAL INC.: PRODUCTS/SOLUTIONS/SERVICES OFFERED


TABLE 152
HONEYWELL INTERNATIONAL INC.: DEALS


TABLE 153
TEXAS INSTRUMENTS INCORPORATED: COMPANY OVERVIEW


TABLE 154
TEXAS INSTRUMENTS INCORPORATED: PRODUCTS/SOLUTIONS/ SERVICES OFFERED


TABLE 155
TEXAS INSTRUMENTS INCORPORATED: PRODUCT LAUNCHES


TABLE 156
TEXAS INSTRUMENTS INCORPORATED: DEALS


TABLE 157
SETRA SYSTEMS: COMPANY OVERVIEW


TABLE 158
SETRA SYSTEMS: PRODUCTS/SOLUTIONS/SERVICES OFFERED


TABLE 159
SETRA SYSTEMS: DEALS


TABLE 160
SENSIRION AG: COMPANY OVERVIEW


TABLE 161
SENSIRION AG: PRODUCTS/SOLUTIONS/SERVICES OFFERED


TABLE 162
SENSIRION AG: PRODUCT LAUNCHES


TABLE 163
SENSIRION AG: DEALS


TABLE 164
TE CONNECTIVITY: COMPANY OVERVIEW


TABLE 165
TE CONNECTIVITY: PRODUCTS/SOLUTIONS/SERVICES OFFERED


TABLE 166
TE CONNECTIVITY: DEALS


TABLE 167
SIEMENS: COMPANY OVERVIEW


TABLE 168
SIEMENS: PRODUCTS/SOLUTIONS/SERVICES OFFERED


TABLE 169
SIEMENS: DEALS


TABLE 170
TERACOM: COMPANY OVERVIEW


TABLE 171
TERACOM: PRODUCTS/SOLUTIONS/SERVICES OFFERED


TABLE 172
BOSCH SENSORTEC GMBH: COMPANY OVERVIEW


TABLE 173
BOSCH SENSORTEC GMBH: PRODUCTS/SOLUTIONS/SERVICES OFFERED


TABLE 174
SCHNEIDER ELECTRIC: COMPANY OVERVIEW


TABLE 175
SCHNEIDER ELECTRIC: PRODUCTS/SOLUTIONS/SERVICES OFFERED


TABLE 176
RENESAS ELECTRONICS CORPORATION: COMPANY OVERVIEW


TABLE 177
RENESAS ELECTRONICS CORPORATION: PRODUCTS/SOLUTIONS/ SERVICES OFFERED


TABLE 178
B+B THERMO-TECHNIK GMBH: COMPANY OVERVIEW


TABLE 179
E+E ELEKTRONIK GES.M.B.H: COMPANY OVERVIEW


TABLE 180
IST AG: COMPANY OVERVIEW


TABLE 181
HUNAN RIKA ELECTRONIC TECH CO., LTD.: COMPANY OVERVIEW


TABLE 182
DICKSON: COMPANY OVERVIEW


TABLE 183
GALLTEC MESS- UND REGELTECHNIK GMBH: COMPANY OVERVIEW


TABLE 184
PCE HOLDING GMBH: COMPANY OVERVIEW


TABLE 185
SUNSUI PROCESS SYSTEM: COMPANY OVERVIEW


TABLE 186
PRESSAC COMMUNICATIONS LIMITED: COMPANY OVERVIEW


TABLE 187
SMART FOG: COMPANY OVERVIEW


TABLE 188
WINSEN: COMPANY OVERVIEW


TABLE 189
KELE PRECISION MANUFACTURING: COMPANY OVERVIEW


TABLE 190
RAYSTEK PROCESS INSTRUMENTS: COMPANY OVERVIEW


TABLE 191
AHLBORN: COMPANY OVERVIEW


TABLE 192
SHANDONG RENKE CONTROL TECHNOLOGY CO., LTD.: COMPANY OVERVIEW


TABLE 193
AVTECH SOFTWARE, INC.: COMPANY OVERVIEW


TABLE 194
NOVOSENSE: COMPANY OVERVIEW


TABLE 195
HUMIDITY SENSOR MARKET: RISK ANALYSIS


LIST OF FIGURES


FIGURE 1
HUMIDITY SENSOR MARKET SEGMENTATION AND REGIONAL SCOPE


FIGURE 2
HUMIDITY SENSOR MARKET SCENARIO


FIGURE 3
GLOBAL HUMIDITY SENSOR MARKET, 2022–2032


FIGURE 4
MAJOR STRATEGIES ADOPTED BY KEY PLAYERS IN HUMIDITY SENSOR MARKET, JANUARY 2023–SEPTEMBER 2026


FIGURE 5
DISRUPTIONS INFLUENCING GROWTH OF HUMIDITY SENSOR MARKET


FIGURE 6
HIGH-GROWTH SEGMENTS IN HUMIDITY SENSOR MARKET, 2026–2032


FIGURE 7
ASIA PACIFIC TO REGISTER HIGHEST CAGR IN HUMIDITY SENSOR MARKET DURING FORECAST PERIOD


FIGURE 8
RISING DEMAND FOR AUTOMATED HVAC SYSTEMS AND INDUSTRIAL PROCESS CONTROL TO DRIVE MARKET


FIGURE 9
CAPACITIVE SEGMENT TO ACCOUNT FOR LARGEST MARKET SHARE IN 2026


FIGURE 10
RELATIVE SEGMENT TO CAPTURE LARGER MARKET SHARE IN 2026


FIGURE 11
INDUSTRIAL PROCESS CONTROL SEGMENT TO ACCOUNT FOR LARGEST MARKET SHARE IN 2026


FIGURE 12
INDUSTRIAL PROCESS CONTROL SEGMENT TO HOLD LARGEST SHARE OF HUMIDITY SENSOR MARKET IN NORTH AMERICA IN 2032


FIGURE 13
UK TO EXHIBIT HIGHEST CAGR IN GLOBAL HUMIDITY SENSOR MARKET DURING FORECAST PERIOD


FIGURE 14
HUMIDITY SENSOR MARKET: DRIVERS, RESTRAINTS, OPPORTUNITIES, AND CHALLENGES


FIGURE 15
IMPACT ANALYSIS OF DRIVERS


FIGURE 16
IMPACT ANALYSIS OF RESTRAINTS


FIGURE 17
IMPACT ANALYSIS OF OPPORTUNITIES


FIGURE 18
IMPACT ANALYSIS OF CHALLENGES


FIGURE 19
PORTER’S FIVE FORCES ANALYSIS


FIGURE 20
VALUE CHAIN ANALYSIS


FIGURE 21
HUMIDITY SENSOR MARKET: ECOSYSTEM


FIGURE 22
AVERAGE SELLING PRICE TREND OF HUMIDITY SENSORS, BY REGION, 2022–2025


FIGURE 23
IMPORT DATA FOR HS CODE 902690-COMPLIANT PRODUCTS FOR TOP FIVE COUNTRIES, 2021–2025


FIGURE 24
EXPORT DATA FOR HS CODE 902690-COMPLIANT PRODUCTS FOR TOP FIVE COUNTRIES, 2021–2025


FIGURE 25
TRENDS/DISRUPTIONS IMPACTING CUSTOMER BUSINESS


FIGURE 26
INVESTMENT AND FUNDING SCENARIO, 2022–2025


FIGURE 27
PATENTS APPLIED AND GRANTED, 2017–2026


FIGURE 28
STRATEGIC BUYING CRITERIA FOR HUMIDITY SENSORS


FIGURE 29
INFLUENCE OF STAKEHOLDERS ON BUYING PROCESS FOR TOP THREE END-USE INDUSTRIES


FIGURE 30
KEY BUYING CRITERIA FOR TOP THREE END-USE INDUSTRIES


FIGURE 31
THERMAL SEGMENT TO RECORD HIGHEST CAGR DURING FORECAST PERIOD


FIGURE 32
ABSOLUTE SEGMENT TO EXHIBIT HIGHER CAGR BETWEEN 2026 AND 2032


FIGURE 33
ENVIRONMENTAL MONITORING SEGMENT TO EXHIBIT HIGHEST CAGR DURING FORECAST PERIOD


FIGURE 34
HUMIDITY SENSOR MARKET, BY REGION


FIGURE 35
ASIA PACIFIC TO DOMINATE HUMIDITY SENSOR MARKET FROM 2026 TO 2032


FIGURE 36
NORTH AMERICA: HUMIDITY SENSOR MARKET SNAPSHOT


FIGURE 37
US TO REGISTER HIGHEST CAGR IN HUMIDITY SENSOR MARKET IN NORTH AMERICA DURING FORECAST PERIOD


FIGURE 38
EUROPE: HUMIDITY SENSOR MARKET SNAPSHOT


FIGURE 39
GERMANY TO HOLD LARGEST SHARE OF HUMIDITY SENSOR MARKET IN EUROPE BETWEEN 2026 AND 2032


FIGURE 40
ASIA PACIFIC: HUMIDITY SENSOR MARKET SNAPSHOT


FIGURE 41
INDIA TO EXHIBIT HIGHEST CAGR IN ASIA PACIFIC HUMIDITY SENSOR MARKET DURING FORECAST PERIOD


FIGURE 42
MIDDLE EAST TO DOMINATE HUMIDITY SENSOR MARKET IN ROW FROM 2026 TO 2032


FIGURE 43
HUMIDITY SENSOR MARKET: REVENUE ANALYSIS OF KEY PLAYERS, 2021–2025


FIGURE 44
MARKET SHARE ANALYSIS OF COMPANIES OFFERING HUMIDITY SENSORS, 2025


FIGURE 45
COMPANY VALUATION


FIGURE 46
FINANCIAL METRICS (EV/EBITDA)


FIGURE 47
HUMIDITY SENSOR MARKET: BRAND COMPARISON


FIGURE 48
HUMIDITY SENSOR MARKET: COMPANY EVALUATION MATRIX (KEY PLAYERS), 2025


FIGURE 49
HUMIDITY SENSOR MARKET: COMPANY FOOTPRINT


FIGURE 50
HUMIDITY SENSOR MARKET: COMPANY EVALUATION MATRIX (STARTUPS/SMES), 2025


FIGURE 51
AMPHENOL CORPORATION: COMPANY SNAPSHOT


FIGURE 52
HONEYWELL INTERNATIONAL INC.: COMPANY SNAPSHOT


FIGURE 53
TEXAS INSTRUMENTS INCORPORATED: COMPANY SNAPSHOT


FIGURE 54
SENSIRION AG: COMPANY SNAPSHOT


FIGURE 55
TE CONNECTIVITY: COMPANY SNAPSHOT


FIGURE 56
SIEMENS: COMPANY SNAPSHOT


FIGURE 57
SCHNEIDER ELECTRIC: COMPANY SNAPSHOT


FIGURE 58
RENESAS ELECTRONICS CORPORATION: COMPANY SNAPSHOT


FIGURE 59
HUMIDITY SENSOR MARKET: RESEARCH DESIGN


FIGURE 60
CORE FINDINGS FROM INDUSTRY EXPERTS


FIGURE 61
HUMIDITY SENSOR MARKET: BOTTOM-UP APPROACH


FIGURE 62
HUMIDITY SENSOR MARKET: TOP-DOWN APPROACH


FIGURE 63
HUMIDITY SENSOR MARKET SIZE ESTIMATION METHODOLOGY (SUPPLY SIDE)


FIGURE 64
HUMIDITY SENSOR MARKET: DATA TRIANGULATION


FIGURE 65
HUMIDITY SENSOR MARKET: RESEARCH ASSUMPTIONS


Methodology

The research process for this study involved the systematic gathering, recording, and analysis of data on customers and companies operating in the Humidity Sensor market. This process involved the extensive use of secondary sources, directories, and databases (Factiva and OANDA) to identify and collect valuable information for the comprehensive, technical, market-oriented, and commercial study of the Humidity Sensor market. In-depth interviews were conducted with primary respondents, including experts from core and related industries, as well as preferred manufacturers, to obtain and verify critical qualitative and quantitative information and assess growth prospects. Key players in the Humidity Sensor market were identified through secondary research, and their market rankings were determined through a combination of primary and secondary research. This research involved studying the annual reports of top players and conducting interviews with key industry experts, including CEOs, directors, and marketing executives.

Secondary Research

Various sources were utilized in the secondary research process to identify and collect information relevant to this study. These include company annual reports, press releases, investor presentations, white papers, technology journals, certified publications, articles by recognized authors, directories, and databases.

Secondary research was primarily used to gather key information on the industry’s value chain, the total pool of market players, market classification by industry trends at the most detailed level, regional markets, and key developments from both market- and technology-oriented perspectives.

Primary Research

Primary research was also conducted to identify the segmentation types, key players, competitive landscape, and key market dynamics, including drivers, restraints, opportunities, challenges, and industry trends, as well as the key strategies adopted by players operating in the Humidity Sensor market. Extensive qualitative and quantitative analyses were conducted across the complete market engineering process to present key information and insights throughout the report.

Extensive primary research has been conducted following the acquisition of knowledge about the humidity sensor market scenarios through secondary research. Several primary interviews were conducted with experts from the demand side (end-user application and region) and the supply side (by type, measurement technique, and end use application) across four major geographic regions: North America, Europe, Asia Pacific, and RoW. Approximately 60% and 40% of the primary interviews were conducted from the supply and demand sides, respectively. These primary data have been collected through questionnaires, emails, and telephonic interviews.
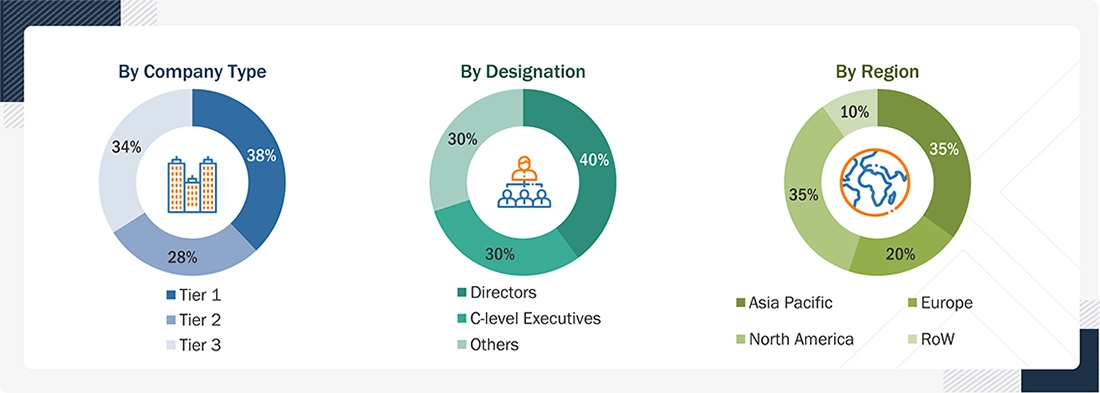
Humidity Sensor Market Size, and Share

Notes: The three tiers of companies have been defined based on their total/segmental revenue as of 2025: Tier 1 = > USD 1 billion, Tier 2 = USD 1 billion–USD 500 million, and Tier 3 = < USD 500 million.
Other designations include sales, marketing, and product managers.

To know about the assumptions considered for the study, download the pdf brochure

Market Size Estimation

In the complete market engineering process, top-down and bottom-up approaches, along with several data triangulation methods, were used to estimate and validate the size of the Humidity Sensor market and various other dependent submarkets. Key players in the market were identified through secondary research, and their market share in each region was determined through a combination of primary and secondary research. This research methodology involved analyzing the annual and financial reports of the top players and conducting interviews with experts (including CEOs, VPs, directors, and marketing executives) to gather key insights (both quantitative and qualitative).

All percentage shares, splits, and breakdowns were determined using secondary sources and verified through primary sources. All possible parameters affecting the markets covered in this study were accounted for, examined in detail, verified through primary research, and analyzed to obtain final quantitative and qualitative data. These data were consolidated and supplemented with detailed inputs and analysis from MarketsandMarkets and presented in this report.

Humidity Sensor Market: Top-Down and Bottom-Up Approach
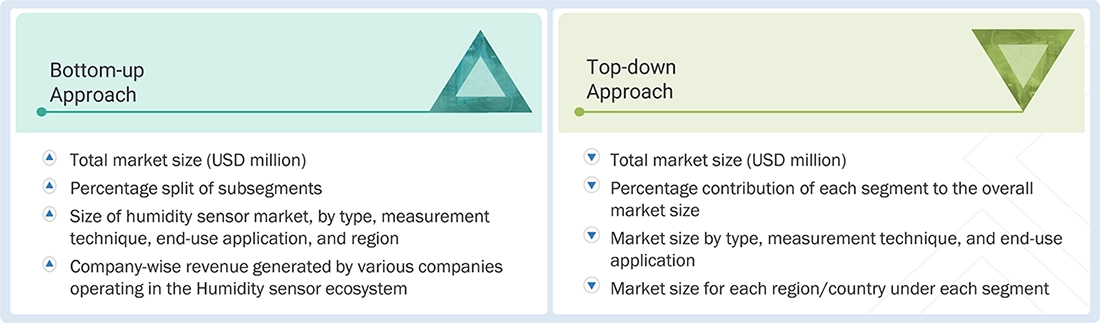
Humidity Sensor Market Top Down and Bottom Up Approach

Data Triangulation

After determining the overall market size through the estimation process, as explained above, the total market was divided into several segments and subsegments. To complete the overall market engineering process and obtain precise statistics for all segments and subsegments, the data triangulation procedure was employed, as applicable. The data was triangulated by studying various factors and trends from the demand and supply sides. Additionally, the market has been validated using both top-down and bottom-up approaches.

Market Definition

A humidity sensor is a device designed to measure and monitor moisture levels in the air, ranging from handheld models to components integrated into air quality systems. Using a sensing element, often a thermistor, these sensors convert data into electrical signals to display humidity levels. They measure either relative humidity (RH) or absolute humidity (AH). RH compares current humidity to its maximum at a given temperature, while AH measures water vapor volume in grams per cubic meter.

Humidity sensors come in three main types: capacitive (measuring RH with a metal strip between electrodes), resistive (using ionized salts for RH), and thermal (measuring AH through temperature differences). Commonly installed indoors or in ducts, these sensors are vital for climate control, energy efficiency, preventing mold, and maintaining industrial environments. Their applications span HVAC systems, weather forecasting, agriculture, and more, enhancing operational efficiency and ensuring optimal living or working conditions.

Key Stakeholders

  • Humidity Sensor Companies  
  • Manufacturers 
  • Raw Material Suppliers  
  • Distributors and Retailers  
  • Technology Providers  
  • Government and Regulatory Bodies  
  • Research and Academic Institutions  
  • System Integrators  
  • End Users

Report Objectives

  • To describe and forecast the humidity sensor market, in terms of value, based on type, measurement technique, and end-use application
  • To define and forecast the market size, in terms of value, with regard to four main regions: North America, Europe, Asia Pacific, and RoW (Rest of the World)
  • To provide detailed information regarding drivers, restraints, opportunities, and challenges influencing the growth of the market
  • To understand the impact of artificial intelligence (AI) on the market
  • To strategically analyze micromarkets1 with respect to individual growth trends, prospects, and contributions to the total market
  • To provide a qualitative overview of different technologies of humidity sensor
  • To analyze opportunities for various stakeholders by identifying high-growth segments of the market
  • To strategically profile key players and comprehensively analyze their market position in terms of ranking and core competencies2, along with detailing the competitive landscape of the market
  • To analyze competitive developments, such as acquisitions, product launches, developments, and partnerships in the market
  • To provide a detailed overview of the ecosystem analysis, case study analysis, patent analysis, trade analysis, technology analysis, average selling price (ASP) analysis, AI/Gen AI impact analysis, Porter’s five forces analysis, macroeconomic outlook, and regulatory landscape pertaining to the humidity sensor market

Available customizations:

With the given market data, MarketsandMarkets offers customizations according to the company’s specific needs. The following customization options are available for the report:


Key Questions Addressed by the Report

What is the projected global humidity sensor market size?

According to MarketsandMarkets, the global humidity sensor market is projected to grow from USD 3.64 billion in 2026 to USD 5.32 billion by 2032.

What is the expected CAGR of the humidity sensor market?

The global humidity sensor market is expected to grow at a CAGR of 6.5% during the forecast period from 2026 to 2032.

What are the key growth drivers of the humidity sensor market?

Key growth drivers include increasing adoption of smart building automation, integration of humidity sensors into HVAC systems, rising demand for environmental monitoring, expansion of industrial applications, and growing emphasis on energy efficiency and indoor air quality.

What are the major trends in the humidity sensor market?

Major trends include increasing adoption of smart sensors, IoT-enabled environmental monitoring, advanced capacitive sensing technologies, real-time humidity measurement, and integration with automated building management systems.

Which region is expected to record the highest growth in the humidity sensor market?

Asia Pacific is expected to record the highest CAGR in the humidity sensor market during the forecast period from 2026 to 2032, supported by industrial expansion and increasing adoption of environmental monitoring technologies.

Which type of humidity sensor is expected to dominate the market?

The capacitive segment is expected to dominate the humidity sensor market throughout the forecast period, owing to its accuracy, reliability, and suitability for a wide range of applications.

Which measurement technique is expected to grow fastest in the humidity sensor market?

The absolute humidity measurement segment is expected to record the fastest CAGR during the forecast period, driven by demand for precise moisture measurement across industrial and environmental applications.

Which end-use application is expected to grow fastest in the humidity sensor market?

The environmental monitoring segment is expected to register the highest CAGR during the forecast period, supported by increasing demand for accurate humidity monitoring in environmental assessment and monitoring systems.

Who are the key companies in the humidity sensor market?

Major players include Amphenol Advanced Sensors (US), Honeywell International Inc. (US), Texas Instruments Incorporated (US), Setra Systems (US), and Sensirion AG (Switzerland). Specialized players include AVTECH Software, Inc. (US), Novosense (China), Dickson (US), Sensoterra (Netherlands), and Viridix (Israel).

What does the humidity sensor market report cover?

The MarketsandMarkets report covers market size and forecasts for 2026–2032, growth trends, key drivers, market segmentation by sensor type, measurement technique and end-use application, regional analysis, and the competitive landscape, including leading and specialized market participants.

Personalize This Research

  • Triangulate with your Own Data
  • Get Data as per your Format and Definition
  • Gain a Deeper Dive on a Specific Application, Geography, Customer or Competitor
  • Any level of Personalization
Request A Free Customisation

Let Us Help You

  • What are the Known and Unknown Adjacencies Impacting the Humidity Sensor Market
  • What will your New Revenue Sources be?
  • Who will be your Top Customer; what will make them switch?
  • Defend your Market Share or Win Competitors
  • Get a Scorecard for Target Partners
Customized Workshop Request

Custom Market Research Services

We Will Customise The Research For You, In Case The Report Listed Above Does Not Meet With Your Requirements

Get 10% Free Customisation

TESTIMONIALS

Growth opportunities and latent adjacency in Humidity Sensor Market

avtar

Benjamin

Apr, 2026

The detailed segmentation by sensor type and technology makes it easy to identify high-growth opportunities..

avtar

Carlos

Apr, 2026

I want additional segmentation on wireless humidity sensors and IoT-enabled nodes can that be added?.

DMCA.com Protection Status
popup img