The study involved four major activities in estimating the current size of the IoT integration market. Exhaustive secondary research was done to collect information on the lending industry. The next step was to validate these findings, assumptions, and sizing with industry experts across the value chain using primary research. Both top-down and bottom-up approaches were employed to estimate the total market size. After that, the market breakup and data triangulation procedures were used to estimate the market size of the segments and sub-segments of the IoT integration market.
Secondary Research
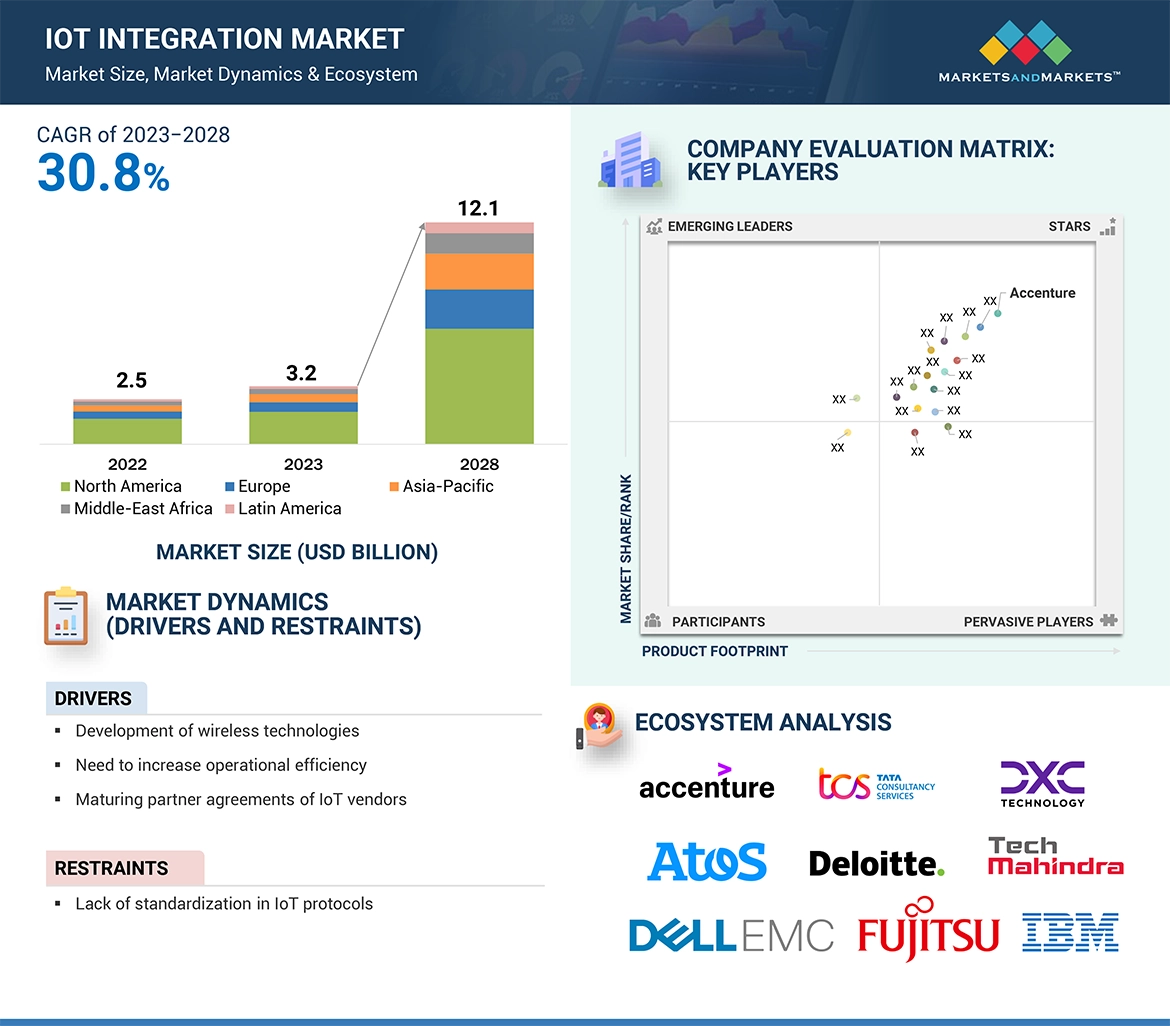
In the secondary research process, various secondary sources were referred to obtain key information about industry insights, the market’s monetary chain, the overall pool of key players, market classification and segmentation, and key developments in the market. The secondary sources included annual reports, press releases of various companies TCS Limited, Wipro Limited, Atos SE, and Accenture among others, white papers, journals, and certified publications and articles from recognized authors, directories, and databases
Primary Research
Extensive primary research has been conducted after understanding the IoT integration market scenario through secondary research. Several primary interviews have been conducted with market experts from demand and supply side players across five major regions: North America, Europe, Asia Pacific, Middle East and Africa, and Latin America. Approximately 70% and 30% of primary interviews have been conducted from the demand and supply sides. Primary data has been collected through questionnaires email, and telephonic interviews. In the canvassing of primaries, various organizations, such as sales. Operations and administration were covered to provide a holistic viewpoint in our report.
After interacting with industry experts, brief sessions were conducted with highly experienced independent consultants to reinforce the findings from our primaries. This, along with the in-house subject matter experts’ opinions, has led us to the findings as described in the remainder of this report
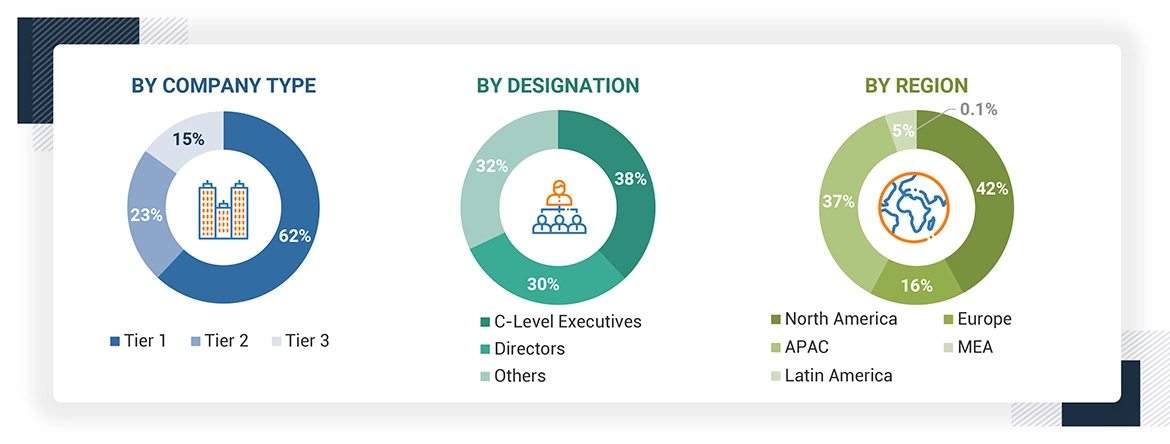
Note: Tier 1 companies have revenues over USD 10 billion; Tier 2 companies’ revenue ranges between USD 1 billion and 10 billion; and Tier 3 companies’ revenue ranges between USD 500 million and USD 1 billion.
Others include senior-level managers, sales executives, and independent consultants.
Source: Industry Experts
To know about the assumptions considered for the study, download the pdf brochure
Market Size Estimation
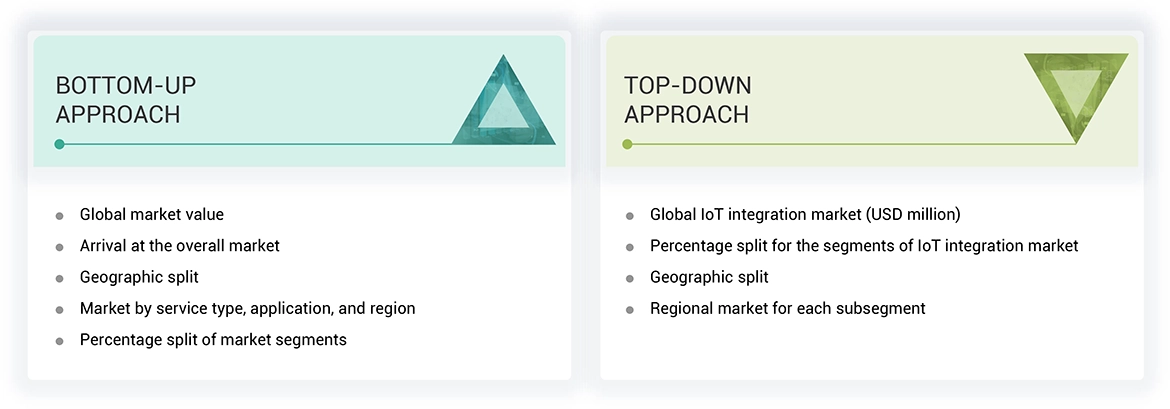
The top-down and bottom-up approaches were used to estimate and validate the size of the global IoT integration market and various other dependent submarkets in the overall market. An exhaustive list of all the vendors offering solutions and services in the market was prepared while using the top-down approach. The market share for all the vendors in the market was estimated through annual reports, press releases, funding, investor presentations, paid databases, and primary interviews. Each vendor was evaluated based on its offering (solutions and services). The aggregate of all companies’ revenues was extrapolated to reach the overall market size.
IoT Integration Market: Top-Down and Bottom-Up Approach
Data Triangulation
After arriving at the overall market size using the market size estimation processes as explained above, the market was split into several segments and subsegments. The data triangulation and market breakup procedures were employed, wherever applicable, to complete the overall market engineering process and arrive at the exact statistics of each market segment and subsegment. The data was triangulated by studying various factors and trends from both the demand and supply sides.
Market Definition
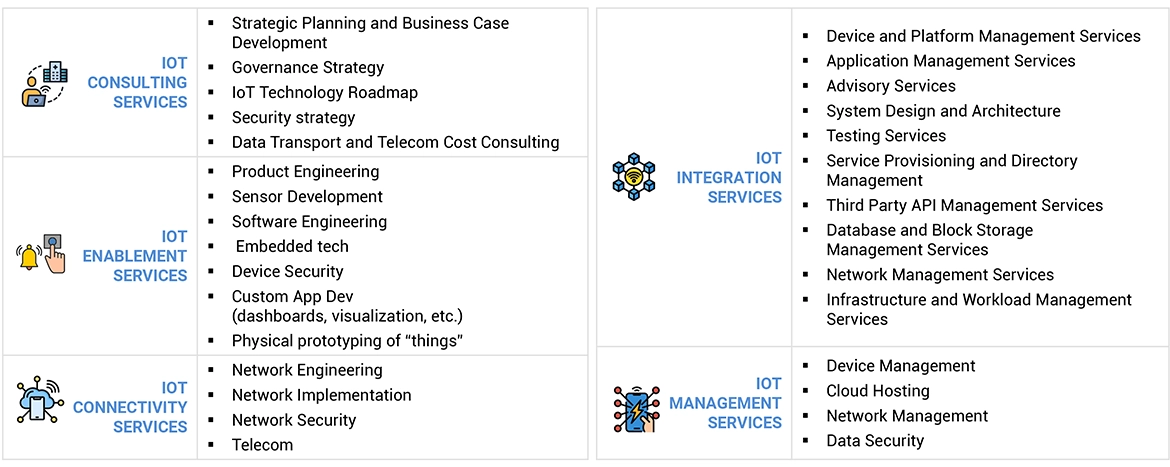
As defined by Software AG, IoT integration is a critical IoT platform capability that enables enterprises to integrate data from connected things with other IT assets, such as SaaS. IoT integration services are transforming into core aspects of the IoT subsystem across multiple application areas to enable secure end-to-end communication between devices and data centers, remote troubleshooting of components, interoperability across subsystems, and advanced business analytics and metrics. IoT integration services offer a newer business proposition for an integrated Go-To-Market (GTM), thereby benefiting internal and external stakeholders, channel partners, and customers.
Stakeholders
-
IoT platform providers
-
IoT integration services providers
-
Managed services providers (MSPs)
-
Communication service providers
-
Application providers
-
Network-as-a-Service providers
-
Third-party System Integrators (SIs)
-
Hardware vendors
-
Independent consultants
-
IoT application providers
-
Regulatory agencies
-
Governments of various countries
Report Objectives
-
To determine and forecast the global IoT integration market based on service, organization size, application, and regions from 2023 to 2028s, and analyze various macro and microeconomic factors that affect the market growth.
-
To forecast the size of the market’s segments with respect to five main regions: North America, Europe, Asia Pacific (APAC), Latin America, and Middle East and Africa (MEA).
-
To provide detailed information about the major factors (drivers, opportunities, threats, and challenges) influencing the growth of the IoT integration market.
-
To analyze each submarket with respect to individual growth trends, prospects, and contributions to the total IoT integration market.
-
To analyze opportunities in the market for stakeholders by identifying the high-growth segments of the IoT integration market.
-
To profile key market players (top vendors and startups); provide a comparative analysis based on their business overviews, regional presence, product offerings, business strategies, and key financials; and illustrate the market’s competitive landscape.
To track and analyze competitive developments, such as mergers and acquisitions, a new product launched and product developments, partnerships, agreements, and collaborations, business expansions, and Research & Development (R&D) activities, in the market
Available Customizations
Along with the market data, MarketsandMarkets offers customizations as per the company’s specific needs. The following customization options are available for the report:
Product Analysis
-
Product Matrix which gives a detailed comparison of the product portfolio of each company
Company Information
-
Detailed analysis and profiling of additional market players (up to 5)


 HIGHEST Market Share (2023–2028)
 Canada FASTEST-GROWING MARKET IN THE REGION
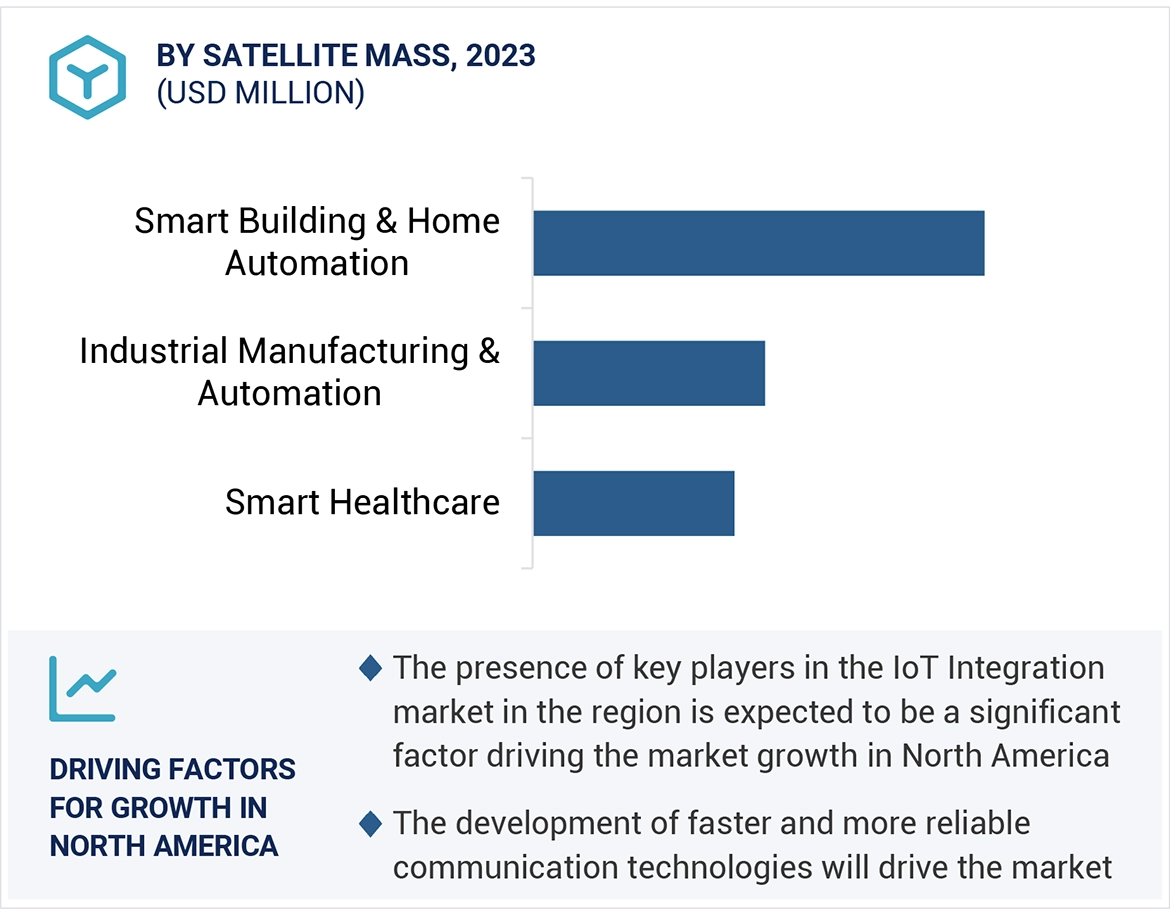


Growth opportunities and latent adjacency in IoT Integration Market