
Livestock Identification Market Size, Share, Growth & Trends

Livestock Identification Market Size, Share, Growth & Trends by Livestock Type (Cattle (Dairy, Beef), Poultry, Swine, Equine), Electronic Identification Tags, Visual Identification Tags (GPS Tags, RFID Tags), Boluses, Data Analytics - Global Forecast to 2031


LIVESTOCK IDENTIFICATION MARKET SIZE, SHARE & TRENDS
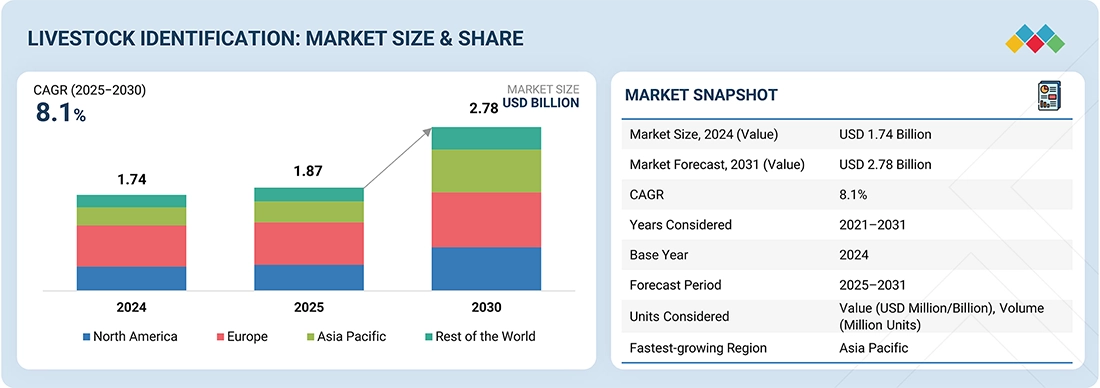
According to Marketsandmarkets, the global livestock identification market size was valued at USD 1.74 billion in 2025 and is projected to reach USD 2.78 billion by 2030, growing at a CAGR of 8.1% from 2025 to 2030. Growth is driven by the rapid adoption of electronic animal identification technologies, expanding government traceability mandates, and rising focus on food safety and disease control. Increasing investments in RFID, biometric, and IoT-enabled tagging systems, along with digital record integration for breeding, vaccination, and supply-chain monitoring, are accelerating market expansion. Additionally, the growing emphasis on sustainable livestock management, export certification compliance, and real-time data analytics is enhancing productivity, reducing livestock losses, and driving sustained growth across global farming and meat processing industries.
MARKET SNAPSHOT TABLE
| REPORT METRIC | DETAILS |
|---|---|
| Market Size, 2025 (Value) | USD 1.74 Billion |
| Market Forecast, 2030 (Value) | USD 2.78 Billion |
| Growth Rate | CAGR of 8.1% from 2025 to 2030 |
| Years Considered | 2021–2031 |
| Base Year | 2024 |
| Forecast Period | 2025–2031 |
| Units Considered | Value (USD Billion), Volume (Million Units) |
| Top Companies |
|
| Growth Drivers |
|
| Report Coverage | Revenue Forecast, Company Ranking, Competitive Landscape, Growth Factors, and Trends |
| Segments Covered |
|
| Regional Scope | North America, Europe, Asia Pacific, RoW |
Market Size & Forecast
KEY TAKEAWAYS
-
BY REGIONEurope is estimated to dominate the livestock identification market with a share of 41.2% in 2025.
-
BY DEVICE LIFECYCLEThe electronic ID (EID) devices are estimated to dominate due to their accuracy, durability, and compatibility with digital herd management platforms for seamless data integration and compliance tracking.
-
BY FARM SIZEMedium-sized farms are gaining prominence due to their balanced adoption of cost-effective RFID and IoT-based systems, which enhance herd monitoring, breeding efficiency, and productivity.
-
BY LIVESTOCK TYPECattle identification is estimated to account for the largest share of 67.4% in 2025 due to government mandates, export traceability requirements, and large herd population across key markets.
-
BY OFFERINGBy offering, the software segment is projected to grow at the highest CAGR of 10.9% during the forecast period.
-
BY APPLICATIONBy application, the animal ownership identification segment is accounted for a share of 36.3% in 2024.
-
COMPETITIVE LANDSCAPEHerdDogg. Inc. (US), mOOvement (Australia), HerdX (US), and SmartAHC Technology (China) have emerged as the startups and SMEs driving technological innovation and market agility in the livestock identification market.
The livestock identification industry is projected to grow significantly over the next decade, driven by rapid digital transformation in animal traceability systems, rising emphasis on food safety and disease control, and increasing government initiatives toward sustainable livestock management and smart farming ecosystems.
Source: Secondary Research, Interviews with Experts, MarketsandMarkets Analysis
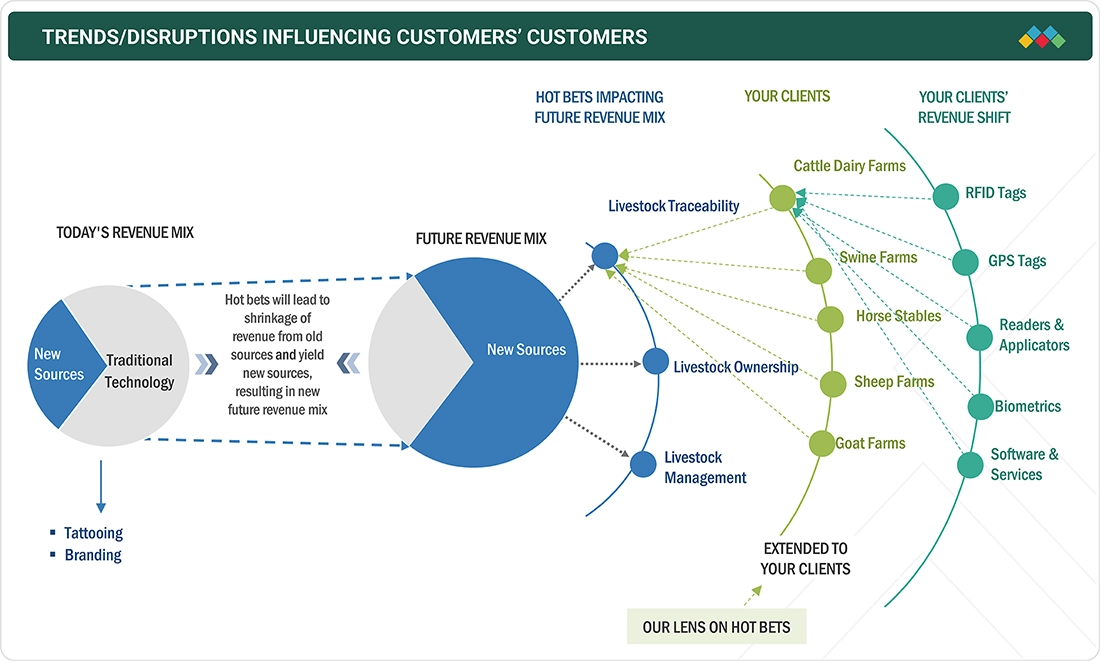
TRENDS & DISRUPTIONS IMPACTING CUSTOMERS' CUSTOMERS
The livestock and animal husbandry vertical primarily includes dairy cooperatives, meat processors, government veterinary agencies, and livestock producers. Livestock identification systems have been increasingly adopted across these segments to enable real-time animal tracking, ownership verification, and supply-chain traceability. Additionally, new opportunities are emerging with the integration of AI-driven analytics, GPS-enabled movement tracking, and cloud-based herd management platforms, enabling data-driven decision-making. These advancements are expected to shape the next generation of smart livestock ecosystems, driving improvements in productivity, operational efficiency, and sustainability, while ensuring traceable, safe, and high-quality animal products for both domestic and export markets.
Source: Secondary Research, Interviews with Experts, MarketsandMarkets Analysis
LIVESTOCK IDENTIFICATION MARKET SHARE DYNAMICS
Level
-
Increasing focus of farmers on reducing mortality and optimizing herd health and productivity

-
Rising inclination of livestock industry players toward data-driven decision-making

Level
-
Limited adoption among small farmers due to budget constraints

-
Rise of vegan dining trend in Europe

Level
-
Integration of blockchain technology into livestock identification tools

-
Government initiatives encouraging use of livestock identification technology

Level
-
Minimizing greenhouse gas emissions from livestock

Source: Secondary Research, Interviews with Experts, MarketsandMarkets Analysis
Driver: Increasing focus of farmers on reducing mortality and optimizing herd health and productivity
Livestock identification systems are being increasingly implemented to address challenges related to herd management, ownership verification, and productivity optimization. Farmers and cooperatives are adopting RFID and IoT-enabled identification systems to enable seamless tracking of animal data, automate recordkeeping, and eliminate errors caused by manual monitoring. The shift toward digital tagging and data-driven livestock management, coupled with expanding government mandates and traceability programs, is fueling strong market adoption. Additionally, the integration of AI, cloud analytics, and smart sensors has enhanced traceability accuracy, data transparency, and herd performance analysis, further accelerating market growth.
Restraint: Limited adoption among small farmers due to budget constraints
Despite clear productivity benefits, the widespread implementation of electronic livestock identification systems requires significant upfront investment in tags, readers, and data management software. The cost of scaling and maintaining digital traceability infrastructure often limits adoption among small and marginal farmers, particularly in developing regions. Limited access to financing, lack of digital literacy, and fragmented regional compliance frameworks hinder integration across farming communities. Data management and system calibration challenges remain key barriers for smaller farms striving to maintain reliable livestock records and consistent reporting accuracy.
Opportunity: Government initiatives encouraging use of livestock identification technology
The ongoing expansion of smart agriculture and digital livestock management initiatives presents a strong growth opportunity for solution providers. Increasing public-sector investments in national animal identification programs, coupled with mandates for traceable meat and dairy exports, are redefining the global livestock data ecosystem. The integration of AI-driven analytics, RFID-enabled tracking, and cloud-based record systems is unlocking new opportunities for operational transparency and export compliance. Furthermore, public–private partnerships (PPP) and integrated database systems are driving modernization, improving productivity, and creating scalable solutions for sustainable livestock development.
Challenge: Minimizing greenhouse gas emissions from livestock
As livestock identification systems increasingly rely on digital data and cloud connectivity, concerns over data privacy, misuse of information, and system security are becoming more pronounced. Unauthorized access or data breaches could undermine ownership verification and compromise compliance tracking. Additionally, there is a growing challenge in monitoring and reporting greenhouse gas emissions associated with livestock operations. Ensuring alignment with sustainability standards, maintaining data transparency, and integrating emission-monitoring modules into livestock ID systems are emerging as critical focus areas for both regulators and technology providers.
Livestock Identification Market Trends: COMMERCIAL USE CASES ACROSS INDUSTRIES
| COMPANY | USE CASE DESCRIPTION | BENEFITS |
|---|---|---|
 |
Deployment of RFID-enabled livestock identification system for dairy herd management, integrating real-time milk yield, health, and breeding data across farms | Improved milk yield traceability, 10–12% productivity gains, faster health issue detection, and transparent farmer payments through data-driven herd management |
 |
Implementation of RFID and blockchain-based traceability solutions for swine operations to ensure end-to-end visibility from farm to processing | Enhanced export compliance, reduced product recalls, and gained a 5–8% price premium through verified animal origin and welfare certification |
 |
Integration of RFID ear tagging across cooperative members for automated milk collection, quality monitoring, and herd health tracking | Fair and timely farmer payments, improved milk quality consistency, and reduced manual data errors, strengthening cooperative transparency. |
 |
Adoption of cloud-based livestock identification and traceability system across beef supply chains to monitor animal health, movement, and sustainability compliance | 40% improvement in traceability efficiency, faster recall management, and increased global market access through verified supply chain transparency |
Logos and trademarks shown above are the property of their respective owners. Their use here is for informational and illustrative purposes only.
LIVESTOCK IDENTIFICATION MARKET GROWTH ECOSYSTEM
The livestock identification ecosystem comprises established providers, including MSD Animal Health, Datamars, Nedap N.V., Shearwell Data Ltd., and Allflex Livestock Intelligence. The synergy among these stakeholders taps new opportunities across areas such as AI-driven animal tracking, RFID and UHF-based identification, cloud-integrated data analytics, and precision livestock management. Continuous innovation in tag materials, data interoperability, and herd analytics platforms is driving greater efficiency, traceability, and compliance across the global livestock identification and smart farming market.
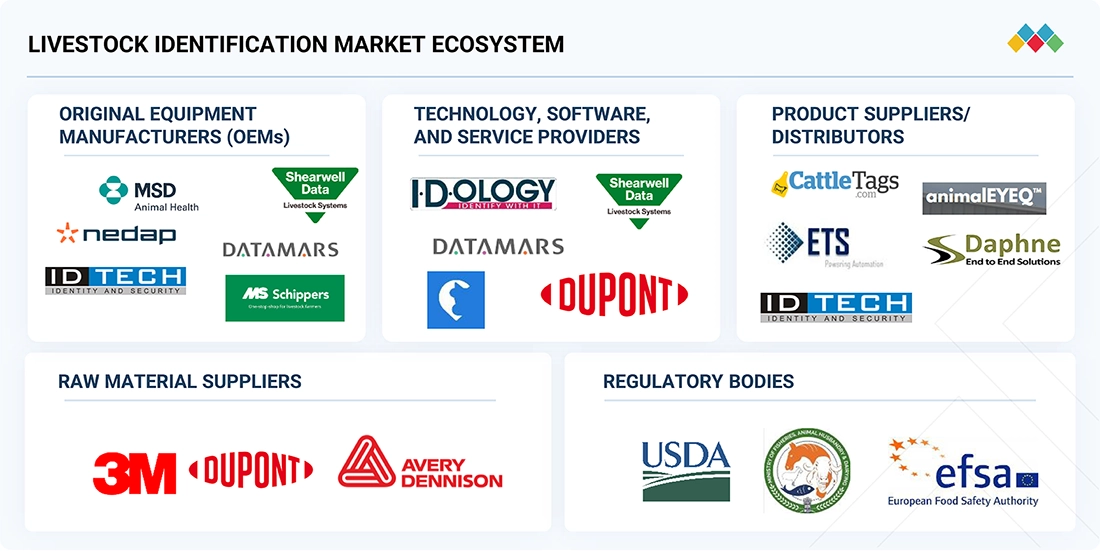
Logos and trademarks shown above are the property of their respective owners. Their use here is for informational and illustrative purposes only.
MARKET SEGMENTS
Source: Secondary Research, Interviews with Experts, MarketsandMarkets Analysis
Livestock Identification Market, by Device Lifecycle
The long device lifecycle segment held the largest market share in 2024, as durable and long-lasting RFID tags are increasingly preferred by farmers and cooperatives for minimizing replacement costs and ensuring continuous animal traceability. These tags, designed to withstand harsh farm environments and prolonged exposure to weather, offer enhanced reliability, low maintenance needs, and consistent data performance throughout the animal’s lifespan. The growing shift toward robust electronic identification solutions integrated with cloud-based data systems continues to strengthen adoption, particularly in large-scale and export-oriented livestock operations where long-term data retention and compliance are critical.
Livestock Identification Market, by Farm Size
The large farm segment accounted for a significant market share in 2024, supported by its higher livestock population, centralized management, and ability to integrate digital tracking at scale. Medium-sized farms are also gaining traction due to cost-effective RFID and IoT-enabled solutions that balance affordability with performance. Increasing access to digital management tools and cooperative-led traceability programs is further driving adoption.
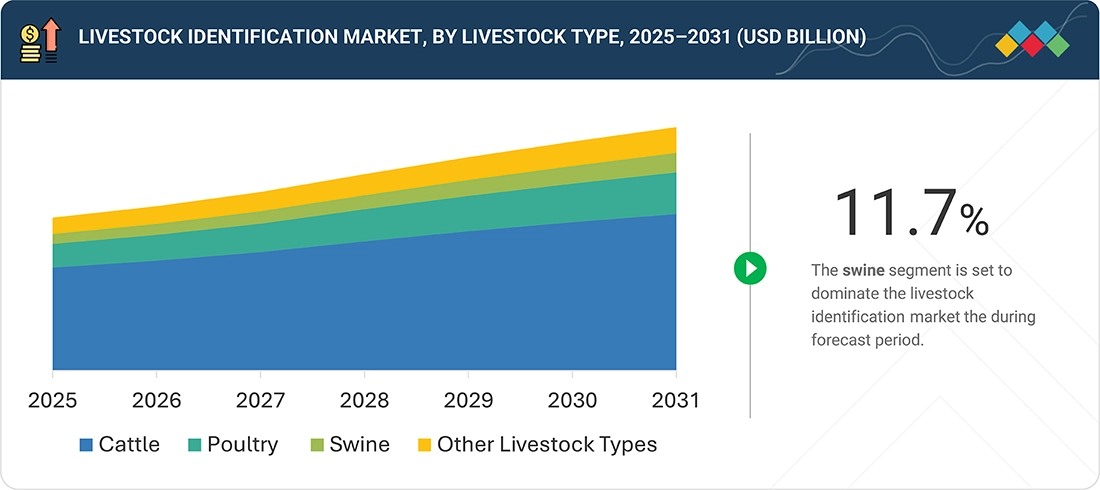
Livestock Identification Market, by Livestock Type
The cattle segment accounted for the largest market share in 2024, driven by strong demand for traceable beef and dairy products, regulatory tagging requirements, and growing export compliance needs. Swine and poultry segments are emerging as fast-growing categories as producers adopt identification systems to enhance operational efficiency, ensure supply-chain transparency, and meet rising food safety standards.
Livestock Identification Market, by Offering
The hardware segment captured the largest share in 2024, driven by growing demand for RFID tags, transponders, and readers integrated with herd management systems. The software and services segment is expanding rapidly, supported by adoption of cloud-based animal record systems, automated data analytics, and mobile-enabled farm dashboards that enhance traceability accuracy and simplify compliance reporting.
Livestock Identification Market, by Application
The animal ownership and traceability segment held the largest market share in 2024, owing to extensive deployment across national livestock registration programs, dairy cooperatives, and export-oriented farms. The rapid adoption of digital herd management and AI-driven productivity monitoring platforms is further accelerating market growth, as producers modernize their record-keeping and improve supply-chain visibility to meet regulatory and commercial standards.
REGION
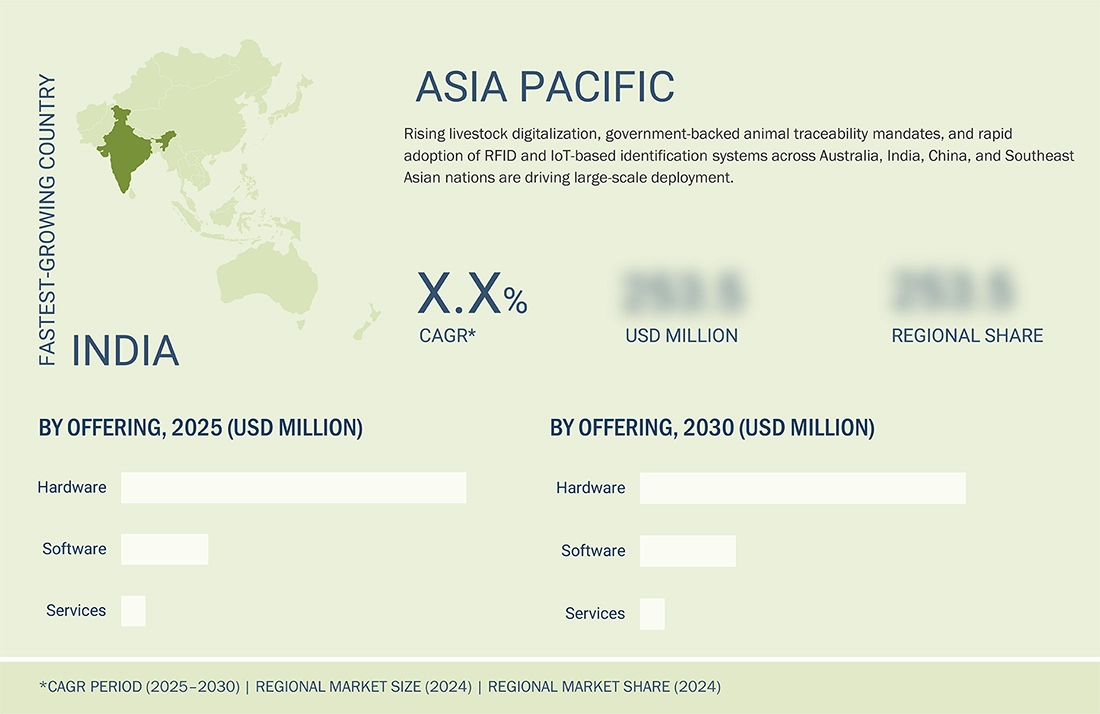
Asia Pacific is expected to register the highest CAGR in the global livestock identification market share during the forecast period.
The Asia Pacific region is projected to record the fastest growth, driven by nationwide livestock traceability programs and increasing government mandates for electronic animal identification across key economies such as India, China, Japan, and Australia. Governments are prioritizing digital livestock management systems to improve transparency in animal ownership, enhance productivity, and support disease-free certification for exports. The region’s progress is further supported by the declining cost of RFID tags and readers, the rapid expansion of dairy and meat production facilities, and strong policy and regulatory backing for large-scale adoption of electronic livestock identification technologies.
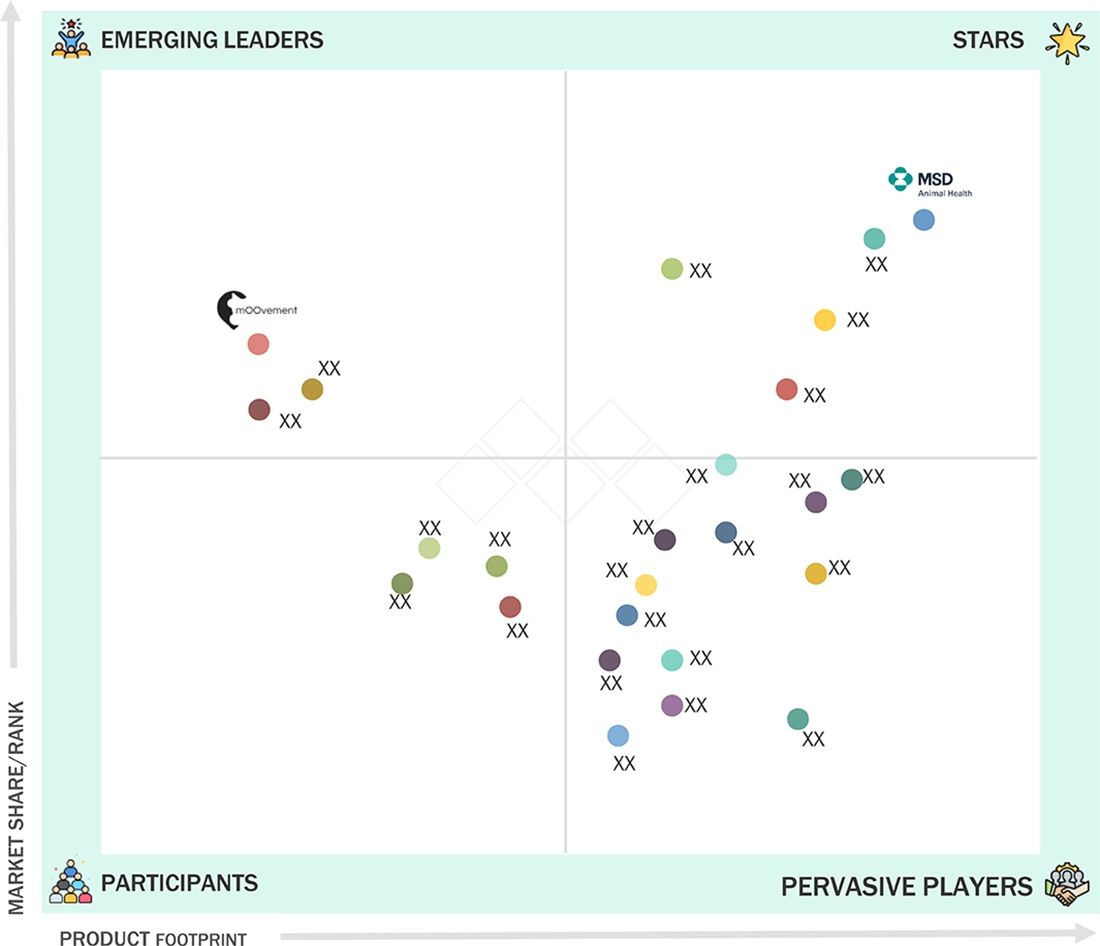
Livestock Identification Market Share: COMPANY EVALUATION MATRIX
In the livestock identification market share, Merck & Co., Inc. (Star) holds a leading position with a robust global presence, a comprehensive range of RFID-based animal identification and monitoring solutions, and deep expertise in integrated livestock management systems. The company’s ongoing focus on traceability innovation, scalability, and digital data integration has reinforced its leadership across major dairy and meat-producing regions worldwide. mOOvement (Emerging Leader) is demonstrating strong market momentum through its GPS-enabled cattle tracking platform and cloud-based herd management tools, which offer real-time visibility and data-driven decision-making for farmers.
Source: Secondary Research, Interviews with Experts, MarketsandMarkets Analysis
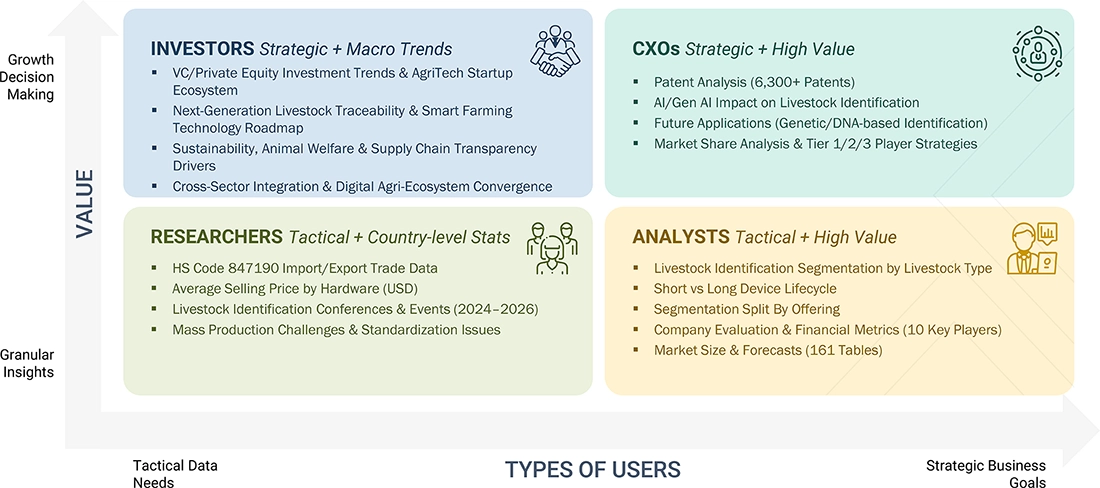
WHAT IS IN IT FOR YOU: Livestock Identification Market Growth REPORT CONTENT GUIDE
DELIVERED CUSTOMIZATIONS
We have successfully delivered the following deep-dive customizations:
| CLIENT REQUEST | CUSTOMIZATION DELIVERED | VALUE ADDS |
|---|---|---|
| Livestock ID System Manufacturer |
|
|
| Livestock Cooperative/Dairy Processor |
|
|
| Agriculture/Veterinary Ministry |
|
|
| Technology Provider/Data Integrator |
|
|
RECENT DEVELOPMENTS
- December 2024 : Luoyang Laipson Information Technology Co., Ltd. launched the TPU Swine Sheep Ear Tags, often featuring bright colors and clear numbering or barcoding for easy visibility and identification from a distance.
- October 2024 : MSD Animal Health launched ALLFLEX APR handheld RFID readers APR650 and APFR250. These readers utilized advanced technology to scan and read various types of animal identification tags, enhancing traceability and management in livestock operations.
- September 2024 : Nedap launched the SmartTag Ear, which provided enhanced dairy herd management by providing real-time data on various health and productivity metrics.
Table of Contents
 Exclusive indicates content/data unique to MarketsandMarkets and not available with any competitors.
Methodology
The research study involved 4 major activities in estimating the size of the livestock identification market. Exhaustive secondary research has been done to collect important information about the market and peer markets. The validation of these findings, assumptions, and sizing with the help of primary research with industry experts across the value chain has been the next step. Both top-down and bottom-up approaches have been used to estimate the market size. Post which the market breakdown and data triangulation have been adopted to estimate the market sizes of segments and sub-segments.
Secondary Research
In the secondary research process, various secondary sources have been referred to for identifying and collecting information required for this study. The secondary sources include annual reports, press releases, investor presentations of companies, white papers, and articles from recognized authors. Secondary research has been mainly done to obtain key information about the market’s value chain, the pool of key market players, market segmentation according to industry trends, regional outlook, and developments from both market and technology perspectives.
In the livestock identification market report, the global market size has been estimated using both the top-down and bottom-up approaches, along with several other dependent submarkets. The major players in the market were identified using extensive secondary research, and their presence in the market was determined using secondary and primary research. All the percentage shares splits, and breakdowns have been determined using secondary sources and verified through primary sources.
Primary Research
Extensive primary research has been conducted after understanding the livestock identification market scenario through secondary research. Several primary interviews have been conducted with key opinion leaders from both demand- and supply-side vendors across 4 major regions— North America, Europe, Asia Pacific, and the Rest of the World. Approximately 25% of the primary interviews have been conducted with the demand-side vendors and 75% with the supply-side vendors. Primary data has been collected mainly through telephonic interviews, which consist of 80% of the total primary interviews; questionnaires and emails have also been used to collect the data.
After successful interaction with industry experts, brief sessions were conducted with highly experienced independent consultants to reinforce the findings of our primary research. This, along with the in-house subject matter experts’ opinions, has led us to the findings as described in the report.

Note: “Others” includes sales, marketing, and product managers
To know about the assumptions considered for the study, download the pdf brochure
Market Size Estimation
In the market engineering process, both top-down and bottom-up approaches, along with data triangulation methods, have been used to estimate and validate the size of the livestock identification and other dependent submarkets. The research methodology used to estimate the market sizes includes the following:
- Identifying top-line investments and spending in the ecosystem and considering segment-level splits and major market developments
- Identifying different stakeholders in the livestock identification market that influence the entire market, along with participants across the supply chain
- Analyzing major manufacturers and service providers in the livestock identification market and studying their solutions and service portfolios
- Analyzing trends related to the adoption of livestock identification solutions and services
- Tracking recent and upcoming market developments, including investments, R&D activities, solution and service launches, collaborations, mergers and acquisitions, and partnerships, as well as forecasting the market size based on these developments and other critical parameters
- Carrying out multiple discussions with key opinion leaders to identify the adoption trends of livestock identification solutions and services
- Segmenting the overall market into various other market segments
- Validating the estimates at every level through discussions with key opinion leaders, such as chief executives (CXOs), directors, and operation managers, and finally with the domain experts at MarketsandMarkets
Livestock Identification Market : Top-Down and Bottom-Up Approach

Data Triangulation
After arriving at the overall market size by the market size estimation process explained in the earlier section, the overall livestock identification market has been divided into several segments and subsegments. To complete the overall market engineering process and arrive at the exact statistics for all segments, the data triangulation and market breakdown procedures have been used, wherever applicable. The data has been triangulated by studying various factors and trends from both the demand and supply side perspectives. Along with data triangulation and market breakdown, the market has been validated by top-down and bottom-up approaches.
Market Definition
Livestock identification, also known as animal identification, refers to gathering and keeping accurate records of individual farm animals or groups of farm animals so that they can be easily tracked from their birth through the marketing chain. It provides essential data such as animals' birth dates, production records, health and medical history, and other important livestock management information.
Key Stakeholders
- Suppliers of raw materials
- Technology investors
- Manufacturers and suppliers of a wide variety of livestock identification solutions
- Integrators, hardware and software suppliers, and service providers of livestock identification solutions
- Government bodies such as regulatory authorities and policymakers for the livestock industry
- Venture capitalists, startup companies, and private equity firms
- Technology developers
- Distributors, resellers, and traders
- Hardware component suppliers and distributors
- Standardization and testing firms
- Associations, forums, and alliances related to the livestock industry
- Research institutions and organizations
- Market research and consulting firms
- End users
Report Objectives
- To define, describe, and forecast the livestock identification market in terms of value on the basis of offering, device lifecycle, livestock type, farm size, application and region.
- To forecast the market size for various segments with respect to four main regions, namely, North America, Europe, Asia Pacific, and Rest of the World
- To define, describe, and forecast hardware offering by tag type in livestock identification market in terms of volume
- To provide detailed information regarding the major drivers, restraints, opportunities, and challenges influencing the growth of the livestock identification market
- To study the complete value chain and related industry segments for the livestock identification market
- To strategically analyze the micromarkets with respect to individual growth trends, prospects, and contributions to the total market
- To analyze trends and disruptions; pricing trends; investment and funding scenario; patents and innovations; trade data (export and import data); regulatory environment; Porter's five forces analysis; case studies; key stakeholders & buying criteria; technology trends; the market ecosystem; and key conferences and events related to the livestock identification market.
- To analyze opportunities in the market for various stakeholders by identifying the high-growth segments of the market
- To strategically profile the key players and comprehensively analyze their market position in terms of ranking and core competencies, along with detailing the competitive landscape for the market leaders.
- To analyze competitive developments such as solution and service launches/developments, expansions, acquisitions, partnerships, collaborations, agreements, and research and development (R&D) activities carried out by players in the livestock identification market
Available Customizations
With the given market data, MarketsandMarkets offers customizations according to the specific requirements of companies. The following customization options are available for the report:
Country-wise Information:s
- Country-wise breakdown for North America, Europe, Asia Pacific, and Rest of the World
Company Information:
- Detailed analysis and profiling of additional market players (up to five)
Key Questions Addressed by the Report
What is the current market size of the global Livestock Identification market?
The global Livestock Identification market was valued at USD 1.74 billion in 2025. Increasing adoption of electronic identification systems, animal traceability programs, and digital livestock management solutions is driving market growth. (MarketsandMarkets)
What is the forecasted size of the Livestock Identification market by 2030?
The Livestock Identification market is projected to reach USD 2.78 billion by 2030, growing from USD 1.74 billion in 2025. (MarketsandMarkets)
What is the expected CAGR of the Livestock Identification market during 2025–2030?
The market is expected to grow at a CAGR of 8.1% from 2025 to 2030, supported by increasing demand for animal traceability, food safety compliance, and disease monitoring systems. (MarketsandMarkets)
What are the major growth drivers for the Livestock Identification industry?
Key growth drivers include increasing government regulations for livestock traceability, rising focus on food safety, disease prevention, export certification requirements, adoption of RFID tags, GPS tracking, and IoT-enabled livestock monitoring systems. (MarketsandMarkets)
What are the key trends shaping the Livestock Identification market?
Major trends include adoption of electronic identification (EID) tags, RFID technology, biometric identification, GPS-based tracking, cloud-based livestock data management, AI analytics, and automated herd monitoring systems. (MarketsandMarkets)
Which companies are the leading players in the Livestock Identification market?
Major companies operating in the market include Merck & Co., Inc., Datamars, Nedap N.V., Leader Products, MS Schippers, Avid Identification Systems, HID Global Corporation, Shearwell Data Limited, Avery Dennison Corporation, GAO RFID, and RFID Inc. (MarketsandMarkets)
Which industries and applications are driving demand for Livestock Identification systems?
Major application areas include dairy farming, beef production, poultry farming, swine production, animal ownership identification, breeding management, disease control, milk traceability, and livestock supply-chain management. (MarketsandMarkets)
Which livestock type segment dominates the Livestock Identification market?
The cattle segment is expected to account for the largest market share, with an estimated 67.4% share in 2025, due to government traceability regulations, dairy management requirements, and demand for meat supply-chain transparency. (MarketsandMarkets)
Which region is expected to dominate the Livestock Identification market?
Europe is estimated to dominate the Livestock Identification market with approximately 41.2% market share in 2025, supported by strict livestock traceability regulations and advanced agricultural technology adoption. (MarketsandMarkets)
What regions and segments are covered in the Livestock Identification market report?
The report covers North America, Europe, Asia Pacific, and Rest of the World (RoW). The market is analyzed by livestock type (cattle, poultry, swine, equine), identification technology (electronic tags, RFID tags, GPS tags, boluses), offering (hardware, software, services), application, farm size, and region. (MarketsandMarkets)
Need a Tailored Report?
Customize this report to your needs
Get 10% FREE Customization
Customize This ReportPersonalize This Research
- Triangulate with your Own Data
- Get Data as per your Format and Definition
- Gain a Deeper Dive on a Specific Application, Geography, Customer or Competitor
- Any level of Personalization
Let Us Help You
- What are the Known and Unknown Adjacencies Impacting the Livestock Identification Market
- What will your New Revenue Sources be?
- Who will be your Top Customer; what will make them switch?
- Defend your Market Share or Win Competitors
- Get a Scorecard for Target Partners

Custom Market Research Services
We Will Customise The Research For You, In Case The Report Listed Above Does Not Meet With Your Requirements
Get 10% Free CustomisationTESTIMONIALS

Tetsuya Ohhira
Business Development Manager-Technology Business
Nikon Corporation,
Leading Japanese MNC specializing in optics and imaging productswww.nikon.com
MarketsandMarkets™ response
is quick. Their attitude is flexible and positive. Analyst Insights are globally considered and
significant. Client Services quickly respond to our inquiry and demand. Their wide range of global
surveys help us make our strategic plan.
We hope Knowledge Store will be easier to search
for a report.
VP - Marketing & Business Development
Leading Provider of Process Control Solutions
We engaged with MarketsandMarkets on a study to perform an analysis and recommend a Go-To-Market strategy for metrology and process control in the semiconductor market. The study was tailored to our targets and needs with well-defined milestones. Our overall experience with the MarketsandMarkets team was very good throughout the project in all aspects including the analysis methodologies used, the quality and depth of primary and secondary data sets, the professionalism and flexibility of the team and the ability to meet the target schedule and milestones. We want to thank MarketsandMarkets team for a job well done.
Growth opportunities and latent adjacency in Livestock Identification Market


Jonathan
Apr, 2026
Is it possible to add a country-level deep dive for Asia-Pacific, especially focusing on China, India, Japan, and Australia growth drivers?.
Bobby
Apr, 2026
The analysis of drivers such as food safety, disease control, and digital livestock management is highly relevant for current industry trends..