
NOC as a Service Market

NOC as a Service Market by Service Type (Event Monitoring & Management, Incident & Problem Management, Service Reporting & Analysis, Capacity & Change Management), Support Model (Onsite, Offsite, Hybrid) - Global Forecast to 2030


OVERVIEW
Source: Secondary Research, Interviews with Experts, MarketsandMarkets Analysis
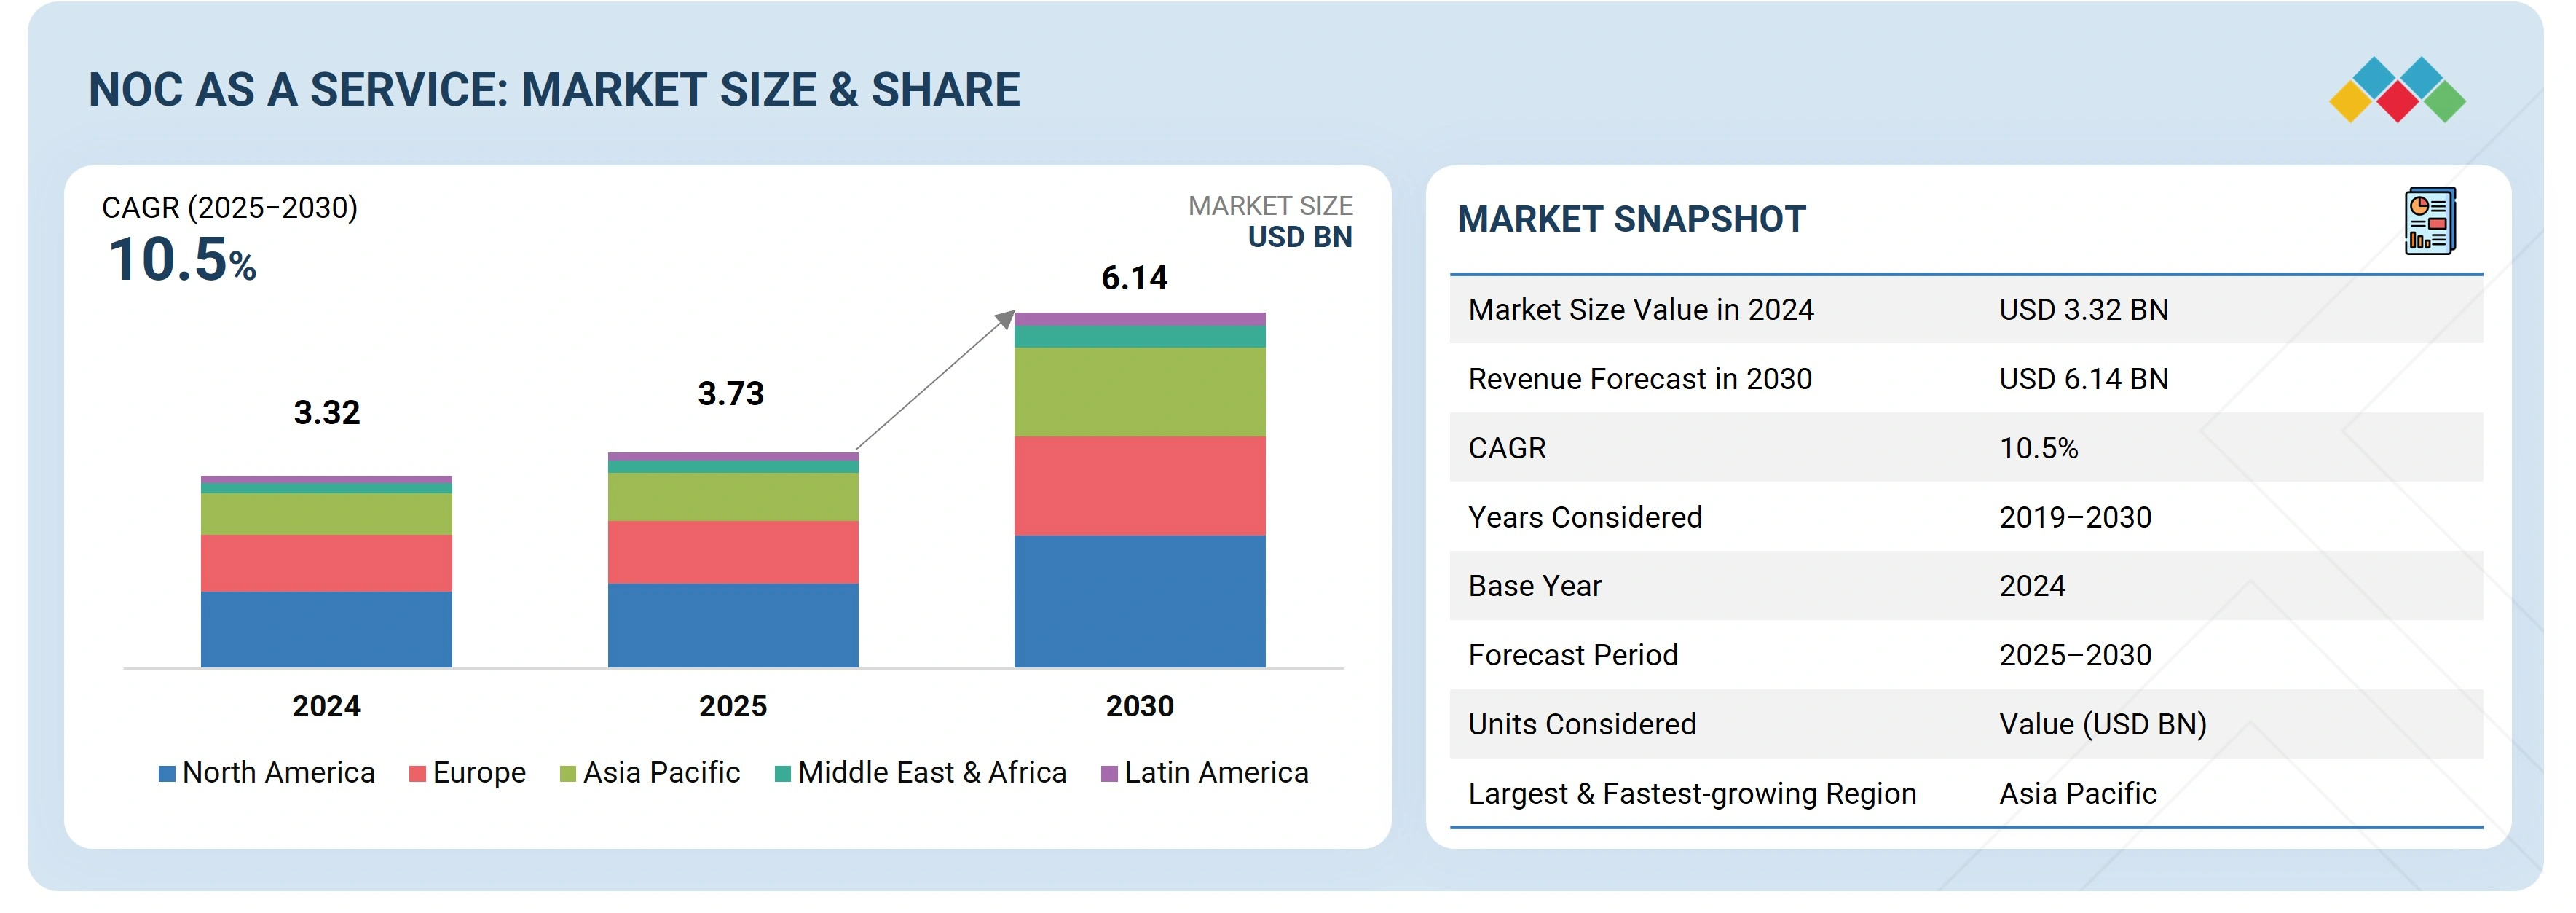
The report for NOC as a Service Market is projected to expand from USD 3.73 billion in 2025 to USD 6.14 billion by 2030, at a CAGR of 10.5% during the forecast period. NOC as a Service growth is being shaped by increasing compliance demands, the need for faster and more reliable incident management, and rising hybrid and multi-cloud complexity. Core services such as event monitoring, incident and problem management, and service reporting are provided via onsite, offsite, and hybrid setups. Event monitoring remains central because it helps reduce downtime and delays in ticket handling. Healthcare and life sciences are witnessing strong demand due to strict regulations, while North America leads adoption through mature MSP channels and evidence-based reporting. Asia Pacific is expected to grow fastest, supported by rapid cloud and SD-WAN rollouts. Progress in AI and GenAI, expanded partner ecosystems, and increased automation are boosting adoption, making NOC as a Service a key facilitator of resilience, compliance, and operational efficiency for enterprises.
Market Size and Forecast:
- 2024 Market Size: USD 3.32 Billion
- 2025 Projected Market Size: USD 3.73 Billion
- 2030 Forecasted Market Size: USD 6.14 Billion
- Growth Rate (2025-2030): CAGR of 10.5%
- Data available from 2019 to 2030
- Forecast period: 2025-2030
- Fastest Growing Region: Asia Pacific
Key Market Trends and Insights
- Key opportunities: Mid-market bundles, 5G rollouts, and edge computing
-
Driving Factors: Increasing hybrid cloud complexity, compliance demands, and AI adoption.
- Latest Trends: AI-driven automation, stricter regulatory compliance, and rapid 5G rollouts.
- Digital Transformation: Expanding hybrid cloud infrastructures and edge environments.
KEY TAKEAWAYS
-
BY SUPPORT MODELOffsite holds the largest share due to cost efficiency and audit-ready evidence, but hybrid segment is expected to record the fastest growth as regulated sectors demand local execution alongside centralized monitoring.
-
BY VERTICALBFSI leads adoption on compliance and fraud control needs, whereas healthcare & life sciences post the highest growth with rising after-hours monitoring and connected device oversight.
-
BY REGIONNorth America holds the largest share with a mature MSP ecosystem, whereas Asia Pacific records the fastest CAGR on hyperscaler, 5G, and SD-WAN expansion.
-
COMPANY LANDSCAPEThe major market players have adopted organic and inorganic strategies, including partnerships and investments. For instance, Fujitsu is gaining big NOC as a Service market share by combining large-scale multivendor monitoring, automation (AIOps), hybrid/offsite delivery, and compliance-ready reporting to support complex multi-cloud enterprises.
TRENDS & DISRUPTIONS IMPACTING CUSTOMERS' CUSTOMERS
NOC as a Service spending is set to evolve over the next 4–5 years, shifting toward new use cases and technologies that deliver measurable outcomes across key verticals. In BFSI, providers such as Fujitsu, Park Place Technologies, and Sify are driving uptime and compliance through audit-ready incident control, hybrid change management, and governed change windows. In Healthcare & Life Sciences, INOC, ConnectWise, and Kaseya are enabling continuous monitoring, separation of duties, and resilient backups to ensure clinical uptime and data safety. In Retail & e-commerce, ConnectWise, Kaseya, and Park Place are optimizing central monitoring, standardized runbooks, and coordinated escalations to reduce checkout failures, speed recovery, and deliver consistent customer experiences across sites.

Source: Secondary Research, Interviews with Experts, MarketsandMarkets Analysis
MARKET DYNAMICS
Level
-
Adoption of AI & AIOps for Network Automation and Efficiency

-
Growing demand for cybersecurity and 24/7 threat monitoring

Level
-
Regulatory and data sovereignty constraints in sensitive industries

-
Integration complexity with legacy and proprietary systems

Level
-
Growing potential for SMB and mid-market tailored service packages

-
Rising adoption of 5G, edge, and IoT networks requiring advanced NOC capabilities

Level
-
Alert fatigue and noisy telemetry impacting incident management

-
Tool fragmentation and data silos limiting unified visibility

Source: Secondary Research, Interviews with Experts, MarketsandMarkets Analysis
Driver: Adoption of AI & AIOps for Network Automation and Efficiency
AI the system groups duplicate alerts, identifies unusual activity early, and initiates approved fixes within safe limits and checks. This reduces alert-to-ticket time, accelerates recovery, and creates clear audit records for leadership review. Key features include root-cause suggestions factoring in recent changes, ranking issues by business impact, and self-heal actions that prevent repeat tickets and cut manual work across shifts. For example, ConnectWise introduced PSA powered by Asio in 2025, featuring a shared data layer and over 50 automation workflows and assistants that coordinate routing and remediation across systems, making these benefits more scalable for MSP NOC operations.
Restraint: Regulatory and data sovereignty constraints in sensitive industries
Laws and contracts require logs and configs to stay region-specific, with restricted, recorded access and legal cross-border transfer rules, adding complexity to outsourced monitoring. Without proof of data location, transfer methods, and least-privilege access, projects face delays, scope reductions, or audit issues. Additional measures include regional data setups and customer-managed encryption keys for compliance in sectors like healthcare, finance, and public sector. The Cloud Security Alliance highlights conflicting regional sovereignty requirements, prompting enterprises to demand region-specific NOCaaS tenants and access proof before launch.
Opportunity: Growing potential for SMB and mid-market tailored service packages
Bundles offering 24/7 monitoring, controlled changes, and ready evidence aligned with HIPAA, PCI, and Basel, with options to store data regionally, provide clear compliance value and reduce audit workload for buyers. This presents an opportunity for enterprises to contract verifiable controls and routine reports instead of developing them internally, thereby lowering risk and shortening time to compliance. Additional features include separation of duties, recorded administrative sessions, and clear rollback records designed for clinical or financial systems with strict time windows. For example, U.S. healthcare compliance updates in 2025 raise expectations for uptime, patch success, and restore testing, increasing demand for NOCaaS programs that can schedule, execute, and demonstrate these controls across hospital networks and medical devices on fixed schedules.
Challenge: Alert fatigue and noisy telemetry impacting incident management
Overwhelming low-value alerts hide real issues, slowing triage and harming service levels if data quality and change context are weak. Correlation tools need clean inputs and awareness of recent changes to reduce noise, or queues and recovery slow down. Business-impact scoring and summaries help direct incidents to the right team initially, reducing handoffs. For example, AIOps guidance improves response time by grouping duplicates and ranking by impact, but requires current device maps and change history to maintain these benefits in live NOCs.
NOC as a Service Market: COMMERCIAL USE CASES ACROSS INDUSTRIES
| COMPANY | USE CASE DESCRIPTION | BENEFITS |
|---|---|---|
 |
Managed NOC for regulated, multi-vendor networks in banking, hospitals, and multi-site retail; combines on-shore GNOC, standardized incident/change control, and governed field coordination. | Higher uptime and faster restoration; audit-ready evidence for compliance; predictable SLAs with multivendor neutrality. |
 |
Platform-attached NOC for MSPs serving retail chains and clinics; modules for endpoint/server/network monitoring with ticket auto-triage and PSA reporting. | Lower tool sprawl and labor; 24x7 coverage without extra headcount; consistent reporting tied to business outcomes. |
 |
Hybrid NOC for India-based BFSI and healthcare estates; shared monitoring for cost footprints, captive/hybrid for high-criticality with SD-WAN and DC integration. | Residency-aware operations; reduced change-related incidents; improved service quality at national scale. |
 |
Asset-to-observability NOC for banks, hospitals, and retailers; Entuity analytics plus field maintenance deliver device-to-service uptime SLAs. | Faster fault isolation and remediation; fewer firmware/config drift issues; single provider from hardware to service. |
 |
Ecosystem-driven NOC for MSPs in retail and healthcare affiliates; centralized monitoring and standardized runbooks integrated with PSA/RMM. | Quicker rollout across multi-site estates; reduced downtime and ticket noise; scalable operations aligned to partner workflows. |
Logos and trademarks shown above are the property of their respective owners. Their use here is for informational and illustrative purposes only.
MARKET ECOSYSTEM
The NOC as a Service market is highly consolidated and comprises many vendors who offer services to a specific or niche market segment. Several changes have occurred in the market in recent years. The vendors are involved in various partnerships and collaborations to develop comprehensive services that address a wide range of requirements.
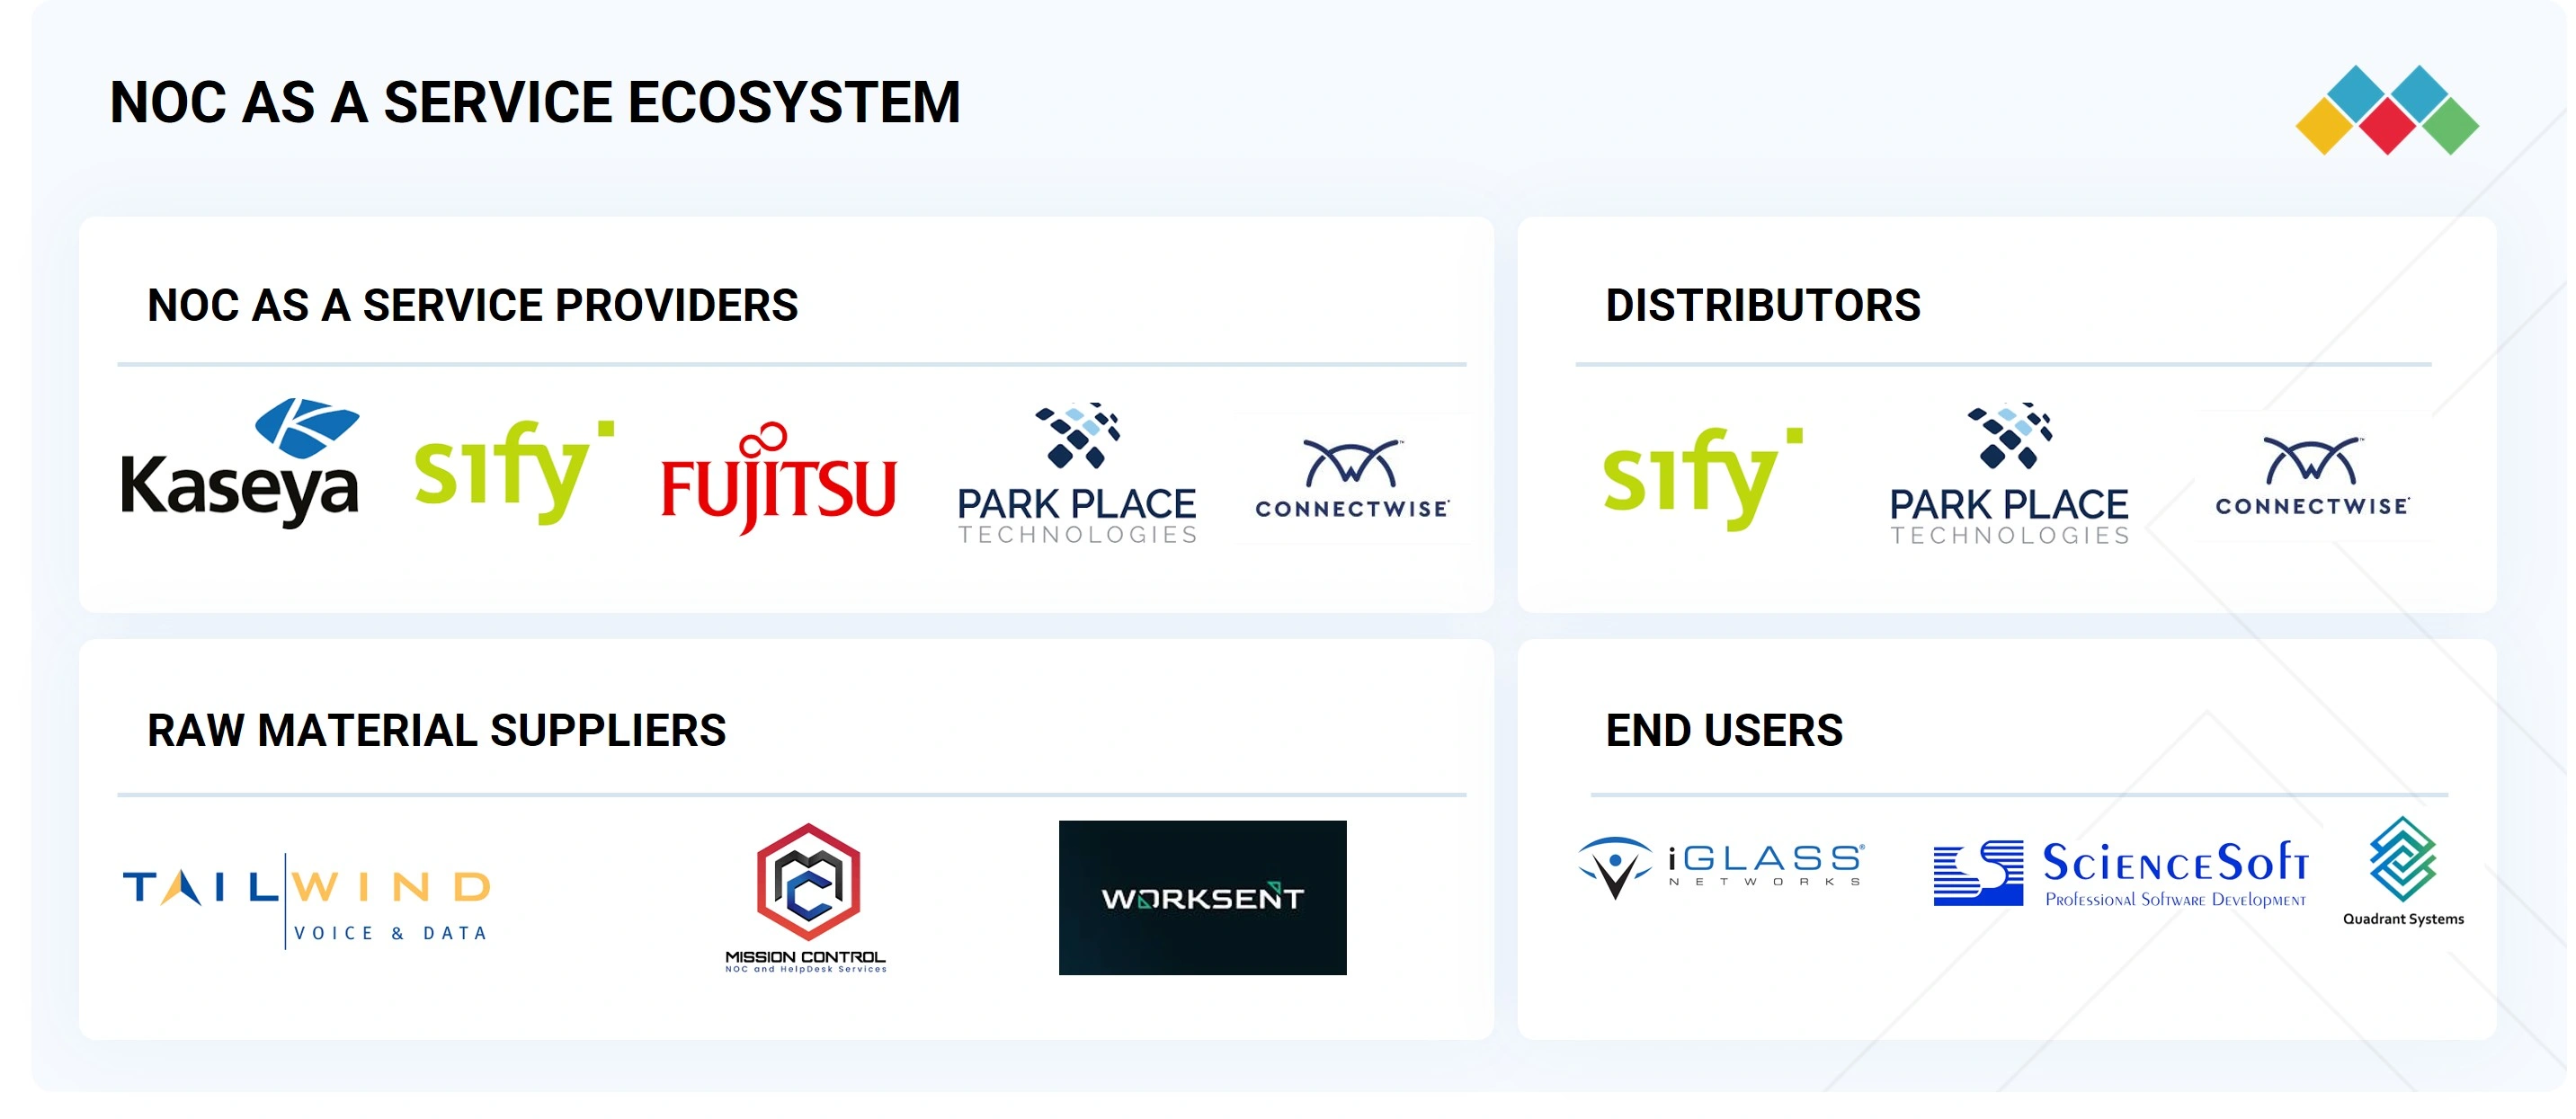
Logos and trademarks shown above are the property of their respective owners. Their use here is for informational and illustrative purposes only.
MARKET SEGMENTS

Source: Secondary Research, Interviews with Experts, MarketsandMarkets Analysis
NOC AS A SERVICE MARKET, BY SERVICE TYPE
Event monitoring and management is the largest NOCaaS because unified correlation consolidates duplicate alerts from networks, cloud, endpoints, and apps into a single, incident-ready ticket enriched with topology and recent change context. This reduces alarm-to-ticket latency, MTTA, and MTTR, justifying 24x7 monitoring as the budget foundation before expanding into deeper remediation and problem management.
REGION
Asia Pacific to be fastest-growing region in global NOC as a Service market during forecast period
Asia Pacific will post the fastest growth because rapid 5G rollouts, hyperscale data-center expansion, and aggressive cloud adoption are multiplying telemetry at the edge and in multi-cloud estates, creating strong demand for centralized monitoring with local execution for regulated subnets. Governments and large enterprises are digitizing at pace across banking, retail, manufacturing, and smart-city programs, while compliance and residency requirements push Hybrid delivery that pairs centralized correlation with in-country change control, an operational fit driving outsized NOCaaS uptake in the region.

NOC as a Service Market: COMPANY EVALUATION MATRIX
The NOC as a Service market is shaped by a range of companies categorized into four main tiers based on market presence, product offerings, and business strategies. Leading the market are stars like Fujitsu, Kaseya, and Park Place Technologies with extensive portfolios and global reach. Emerging Leaders, such as Mission Control NOC and Worksent, are growing through innovative products and business models. Pervasive Players like INOC and CHR Managed Services offer widely adopted NOC solutions supported by strong partner networks, while niche participants like Futurism Technologies and Microscan Communications are gradually establishing their presence. This tiered structure provides a clear view of strategic positioning and competitive dynamics across the NOCaaS market.

Source: Secondary Research, Interviews with Experts, MarketsandMarkets Analysis
KEY MARKET PLAYERS
MARKET SCOPE
| REPORT METRIC | DETAILS |
|---|---|
| Market Size Value in 2024 | USD 3.32 Billion |
| Revenue Forecast in 2030 | USD 6.14 Billion |
| Growth Rate | CAGR of 10.5% from 2025-2030 |
| Actual Data | 2019–2030 |
| Base Year | 2024 |
| Forecast Period | 2025–2030 |
| Units Considered | Value (USD BN) |
| Report Coverage | Revenue forecast, company ranking, competitive landscape, growth factors, and trends |
WHAT IS IN IT FOR YOU: NOC as a Service Market REPORT CONTENT GUIDE

RECENT DEVELOPMENTS
- August 2025 : Mission Control NOC announced new partner-focused enhancements, including volume discounts on Dispatch services, a referral program, and upcoming integrations for SuperOPS PSA and calendar booking, signaling continued convergence between NOC operations and partner ecosystem workflows.
- July 2025 : Industry roundups highlighted a refreshed competitive set of outsourced NOC providers, such as Worksent, Netrio, iGLASS Networks, Infrassist Technologies, EXTNOC, Mission Control NOC, Medha Cloud, INOC, HEX64, and Park Place Technologies, reflecting active product updates and expanded white label offerings for MSPs.
- June 2025 : ConnectWise launched PSA powered by Asio with the new ConnectWise Pro packaging, unifying PSA and RMM data and introducing embedded automation and AI features that streamline ticketing and service delivery for NOC adjacent operations in MSP environments.
- June 2025 : Park Place Technologies reported continued channel momentum with recognition on CRN’s 2025 Solution Provider 500 list, aligning with its ongoing expansion of managed services that include NOC-aligned network monitoring and remediation capabilities for enterprise estates.
- March 2025 : Kyndryl expanded its partnership with Google Cloud to help customers modernize legacy mainframe systems faster by using generative AI; it has been certified as a specialized partner for Google’s AI/Gemini models.
Table of Contents
 Exclusive indicates content/data unique to MarketsandMarkets and not available with any competitors.
Methodology
This research study involved four major activities in estimating the NOC as a Service market size. Exhaustive secondary research was carried out to collect important information about the market and peer markets. The next step involved validating these findings and assumptions and sizing them with the help of primary research with industry experts across the value chain. The top-down and bottom-up approaches were used to estimate the market size. After the market breakdown, data triangulation was utilized to estimate the sizes of segments and sub-segments.
Secondary Research
The market size of the companies offering NOC as a Service to various end users was determined based on secondary data available through paid and unpaid sources, analyzing the product portfolios of major companies in the ecosystem, and rating the companies based on their performance and quality. In the secondary research process, various sources were referred to to identify and collect information for the study. These included annual reports, press releases, investor presentations of companies, white papers, certified publications, and articles from recognized associations and government publishing sources.
Secondary research was mainly used to obtain critical information about industry insights, the market’s monetary chain, the overall pool of key players, market classification and segmentation based on the industry trends to the bottom-most level, regional markets, and key developments from market and technology-oriented perspectives.
Primary Research
In the primary research process, various sources from the supply and demand sides were interviewed to obtain qualitative and quantitative information for the report, such as Chief Experience Officers (CXOs), Vice Presidents (VPs), directors from business development, marketing, and product development/innovation teams, and related key executives from NOC as a Service vendors, system integrators, professional and managed service providers, industry associations, independent consultants, and key opinion leaders.
Primary interviews were conducted to gather insights, such as market statistics, data on revenue collected from platforms and services, market breakups, market size estimations, market forecasts, and data triangulation. Stakeholders from the demand side, such as Chief Information Officers (CIOs), Chief Finance Officers (CFOs), Chief Strategy Officers (CSOs), and the installation team of end users who use NOC as a Service, were interviewed to understand buyers’ perspectives on suppliers, products, service providers, and their use of NOC as a Service which is expected to affect the overall NOC as a Service market growth.

Note: Tier 1 companies have revenues over USD 1 billion, Tier 2 companies have revenues between
USD 500 million and 1 billion, and Tier 3 companies have revenues less than USD 500 million. Other designations include sales managers,
marketing managers, and product managers.
Source: Industry Experts
To know about the assumptions considered for the study, download the pdf brochure
Market Size Estimation
Both top-down and bottom-up approaches were used to estimate and validate the total size of the NOC as a Service market. These methods were also used extensively to estimate the size of various subsegments in the market.
NOC as a Service Market : Top-Down and Bottom-Up Approach

Data Triangulation
The NOC as a Service market was split into several segments and sub-segments after the overall market size was determined using the above estimation process. To complete the overall market engineering process and arrive at the exact statistics for all segments and sub-segments, data triangulation and market breakdown procedures were used, wherever applicable. The data was triangulated by studying various factors and trends from the demand and supply sides. The NOC as a Service market size was validated using top-down and bottom-up approaches.
Market Definition
NOC as a Service (Network Operations Center as a Service) is an outsourced model where an organization enters into a contract with a specialized third-party provider to handle the 24/7 monitoring, management, and support of its IT infrastructure and networks.
The scope of NOC as a Service, as per the defined segmentation, delivers four core capabilities across Onsite, Offsite, and Hybrid models: Event Monitoring & Management to ingest telemetry 24/7, correlate duplicates into one actionable incident, and enrich with topology and recent change context; Incident & Problem Management with tiered L1–L3 diagnostics and runbook-driven remediation, including carrier escalations and rollback to compress MTTR; Service Reporting & Analysis providing audit-ready MTTA/MTTR, alarm-to-ticket latency, patch adherence, and backup test-restore evidence; and Capacity & Change Management orchestrating scheduled patch windows, configuration and image controls, and governed change execution with strict separation of duties.
Stakeholders
- Technology Vendors/OEMs
- Enterprise Customers (Large Enterprises)
- Small & Medium Enterprises (SMEs)
- Channel Partners & System Integrators
- Cloud & Data Center Providers
- Cybersecurity Service Providers
- Telecom Operators & ISPs
- Regulators & Standards Bodies
- Consulting & Advisory Firms
- Investors & Financial Stakeholders
- Managed Service Providers (MSPs)
- Network Equipment Manufacturers
- IT Operations & DevOps Teams (Client Side)
- Industry Associations & Alliances
Report Objectives
- To determine, segment, and forecast the NOC as a Service market based on service type, support model, vertical, and region in terms of value
- To forecast the size of the market segments with respect to five main regions: North America, Europe, Asia Pacific, the Middle East & Africa, and Latin America
- To provide detailed information about the major factors (drivers, restraints, opportunities, and challenges) influencing the growth of the market
- To study the complete value chain and related industry segments, and perform a value chain analysis of the market landscape
- To strategically analyze the macro and micromarkets with respect to individual growth trends, prospects, and contributions to the total market
- To analyze the industry trends, pricing data, patents, and innovations related to the market
- To analyze the opportunities for stakeholders by identifying the high-growth segments of the market
- To profile the key players in the market and comprehensively analyze their market share/ranking and core competencies
- To track and analyze competitive developments, such as mergers & acquisitions, product launches & developments, partnerships, agreements, collaborations, business expansions, and research & development (R&D) activities
Available Customizations
With the given market data, MarketsandMarkets offers customizations based on the company’s specific needs. The following customization options are available for the report:
Geographic Analysis as per Feasibility
- Further break-up of the Asia Pacific market into countries contributing 75% to the regional market size
- Further break-up of the North American market into countries contributing 75% to the regional market size
- Further break-up of the Latin American market into countries contributing 75% to the regional market size
- Further break-up of the Middle East & African market into countries contributing 75% to the regional market size
- Further break-up of the European market into countries contributing 75% to the regional market size
Company Information
- Detailed analysis and profiling of additional market players (up to five)
Key Questions Addressed by the Report
What is the definition of NOC as a Service?
NOC as a Service (Network Operations Center as a Service) is an outsourced model where an organization contracts with a specialized third-party provider to handle the 24/7 monitoring, management, and support of its IT infrastructure and networks.
The scope of NOC as a Service, as per the defined segmentation, delivers four core capabilities across Onsite, Offsite, and Hybrid models: Event Monitoring & Management to ingest telemetry 24/7, correlate duplicates into one actionable incident, and enrich with topology and recent change context; Incident & Problem Management with tiered L1–L3 diagnostics and runbook-driven remediation, including carrier escalations and rollback to compress MTTR; Service Reporting & Analysis providing audit-ready MTTA/MTTR, alarm-to-ticket latency, patch adherence, and backup test-restore evidence; and Capacity & Change Management orchestrating scheduled patch windows, configuration and image controls, and governed change execution with strict separation of duties.
What is the size of the NOC as a Service market?
The NOC as a Service market is projected to grow from USD 3.73 billion in 2025 to USD 6.14 billion by 2030, at a CAGR of 10.5% during the forecast period.
What are the major drivers of the NOC as a Service market?
Major drivers of the NOC as a Service market include the rising need for 24/7 network monitoring, increasing demand for cost optimization, growing complexity of IT and network infrastructure, rapid adoption of cloud and hybrid environments, integration of AI and automation in network management, rising cyber threats and need for enhanced security, shift toward remote and distributed workforces, and demand for faster incident resolution and service continuity.
Who are the key players operating in the NOC as a Service market?
The major players in the NOC as a Service market include Fujitsu (Japan), Park Place Technologies (US), Kaseya (US), Sify Technologies (India), INOC (US), iGlass Networks (US), Infrassist Technologies (India), EXTNOC (US), Mission Control NOC (Canada), Worksent (US), ConnectWise (US), CHR Managed Services (US), Structured (US), Science Soft (US), Microscan Communications (India), CBS (US), Quadrang Systems (India), Futurism Technologies (US), Tailwind Voice & Data (US), Emapta (Philippines), GCX (US), Netrio (US), Quanza (Netherlands), Cloudsmartz (US), HSC (India), Medha Cloud (US), Teceze (England), and HEX64 (US). These players have adopted various growth strategies, such as partnerships, agreements, collaborations, product launches/enhancements, and acquisitions, to expand their footprint in the NOC as a Service market.
What are the opportunities for new entrants in the NOC as a Service market?
The NOC as a Service market is witnessing opportunities through the integration of AI, GenAI, and automation, along with the rising adoption of hybrid and multi-cloud environments that demand flexible support models. Growing IoT and edge deployments, coupled with expansion into SMEs and industry-specific offerings, further open avenues for tailored and scalable NOCaaS services.
Need a Tailored Report?
Customize this report to your needs
Get 10% FREE Customization
Customize This ReportPersonalize This Research
- Triangulate with your Own Data
- Get Data as per your Format and Definition
- Gain a Deeper Dive on a Specific Application, Geography, Customer or Competitor
- Any level of Personalization
Let Us Help You
- What are the Known and Unknown Adjacencies Impacting the NOC as a Service Market
- What will your New Revenue Sources be?
- Who will be your Top Customer; what will make them switch?
- Defend your Market Share or Win Competitors
- Get a Scorecard for Target Partners

Custom Market Research Services
We Will Customise The Research For You, In Case The Report Listed Above Does Not Meet With Your Requirements
Get 10% Free CustomisationTESTIMONIALS


Growth opportunities and latent adjacency in NOC as a Service Market