This research study involved the extensive use of secondary sources, directories, and databases, such as Dun & Bradstreet (D&B) Hoovers and Bloomberg BusinessWeek, to identify and collect information useful for a technical, market-oriented, and commercial study of the open RAN market. The primary sources have been mainly industry experts from the core and related industries and preferred suppliers, manufacturers, distributors, service providers, technology developers, alliances, and organizations related to all segments of the value chain of this market. In-depth interviews have been conducted with various primary respondents, including key industry participants, subject matter experts, C-level executives of key market players, and industry consultants to obtain and verify critical qualitative and quantitative information.
Secondary Research
The market for companies offering open RAN solutions and services to different verticals has been estimated and projected based on the secondary data made available through paid and unpaid sources, as well as by analyzing their product portfolios in the ecosystem of the open RAN market. It also involved rating company products based on their performance and quality. In the secondary research process, various sources such as 1st Global OTIC Summit 2023, Open Air Interface (OAI) workshop 2023, and Open RAN Technical Summit at SCTE Cable-Tec Expo’23 have been referred to for identifying and collecting information for this study on the open RAN market. The secondary sources included annual reports, press releases investor presentations of companies, white papers, journals, and certified publications and articles by recognized authors, directories, and databases. Secondary research has been mainly used to obtain key information about the supply chain of the market, the total pool of key players, market classification, segmentation according to industry trends to the bottommost level, regional markets, and key developments from both market- and technology-oriented perspectives that have been further validated by primary sources.
Primary Research
In the primary research process, various primary sources from both the supply and demand sides were interviewed to obtain qualitative and quantitative information on the market. The primary sources from the supply side included various industry experts, including Chief Experience Officers (CXOs); Vice Presidents (VPs); directors from business development, marketing, and product development/innovation teams; related key executives from open RAN solution vendors, SIs, professional service providers, and industry associations; and key opinion leaders. Primary interviews were conducted to gather insights, such as market statistics, revenue data collected from solutions and services, market breakups, market size estimations, market forecasts, and data triangulation. Primary research also helped understand various trends related to technologies, applications, deployments, and regions. Stakeholders from the demand side, such as Chief Information Officers (CIOs), Chief Technology Officers (CTOs), Chief Strategy Officers (CSOs), and end users using open RAN solutions, were interviewed to understand the buyer’s perspective on suppliers, products, service providers, and their current usage of open RAN solutions which would impact the overall open RAN market.
 Market Size, and Share")
To know about the assumptions considered for the study, download the pdf brochure
Market Size Estimation
Multiple approaches were adopted to estimate and forecast the size of the open RAN market. The first approach involves estimating market size by summing up the revenue generated by companies through the sale of open RAN offerings.
Both top-down and bottom-up approaches were used to estimate and validate the total size of the open RAN market. These methods were extensively used to estimate the size of various segments in the market. The research methodology used to estimate the market size includes the following:
-
Key players in the market have been identified through extensive secondary research.
-
In terms of value, the industry’s supply chain and market size have been determined through primary and secondary research processes.
-
All percentage shares, splits, and breakups have been determined using secondary sources and verified through primary sources.
Open RAN Market Size: Bottom-Up Approach
 Market Bottom Up Approach")
To know about the assumptions considered for the study, Request for Free Sample Report
Open RAN Market Size: Top-Down Approach
 Market Top Down Approach")
Data Triangulation
After arriving at the overall market size, the open RAN market was divided into several segments and subsegments. A data triangulation procedure was used to complete the overall market engineering process and arrive at the exact statistics for all segments and subsegments, wherever applicable. The data was triangulated by studying various factors and trends from the demand and supply sides. Along with data triangulation and market breakdown, the market size was validated by the top-down and bottom-up approaches.
Market Definition
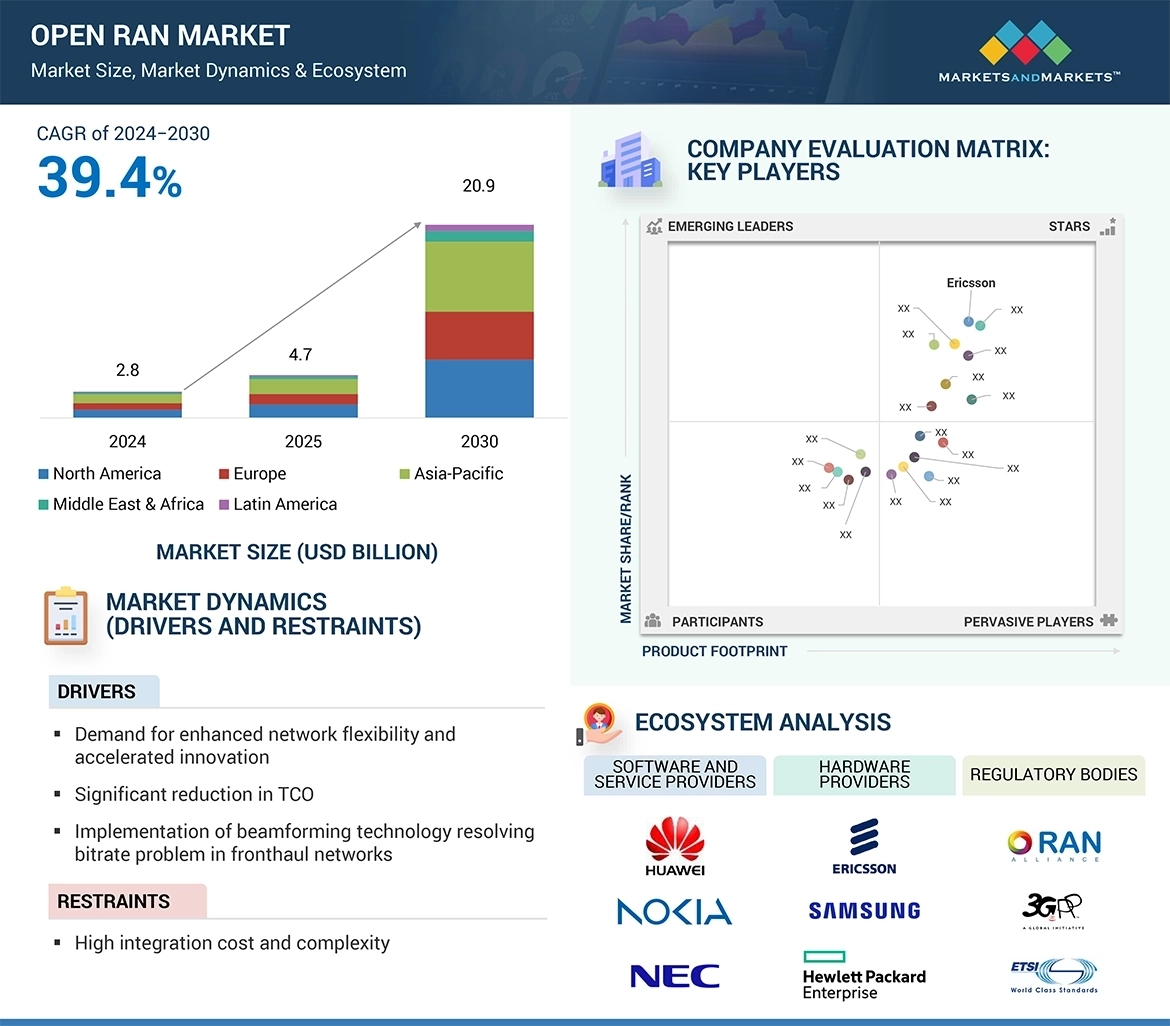
As defined by VIAVI Solutions, Open Radio Access Network (RAN) is a concept based on interoperability and standardization of RAN elements, including a unified interconnection standard for white-box hardware and open-source software elements from different vendors. Open RAN architecture integrates a modular base station software stack on off-the-shelf hardware, which allows baseband and radio unit components from different suppliers to operate seamlessly together.
According to Cisco, an Open RAN is a nonproprietary version of the RAN system that allows interoperation between cellular network equipment provided by different vendors.
Key Stakeholders
-
Government Bodies and Public Safety Agencies
-
IT and Telecommunication Companies
-
Network Infrastructure Developers
-
Mobile Network Operators
-
Software and Hardware Manufacturers
-
Communication and Computing Device Manufacturers
-
Emergency Public Safety Service Providers
-
Chief Information/Technology Officers
-
State Broadband Task Force
-
Commercial Broadband Vendors
-
Urban Area Security Imitative (UASI) Representative
-
Regional Interoperability Committees
-
Statewide Interoperability Governing Body (SIGB)
-
Federal Agencies, especially Federal Emergency Responders
Report Objectives
-
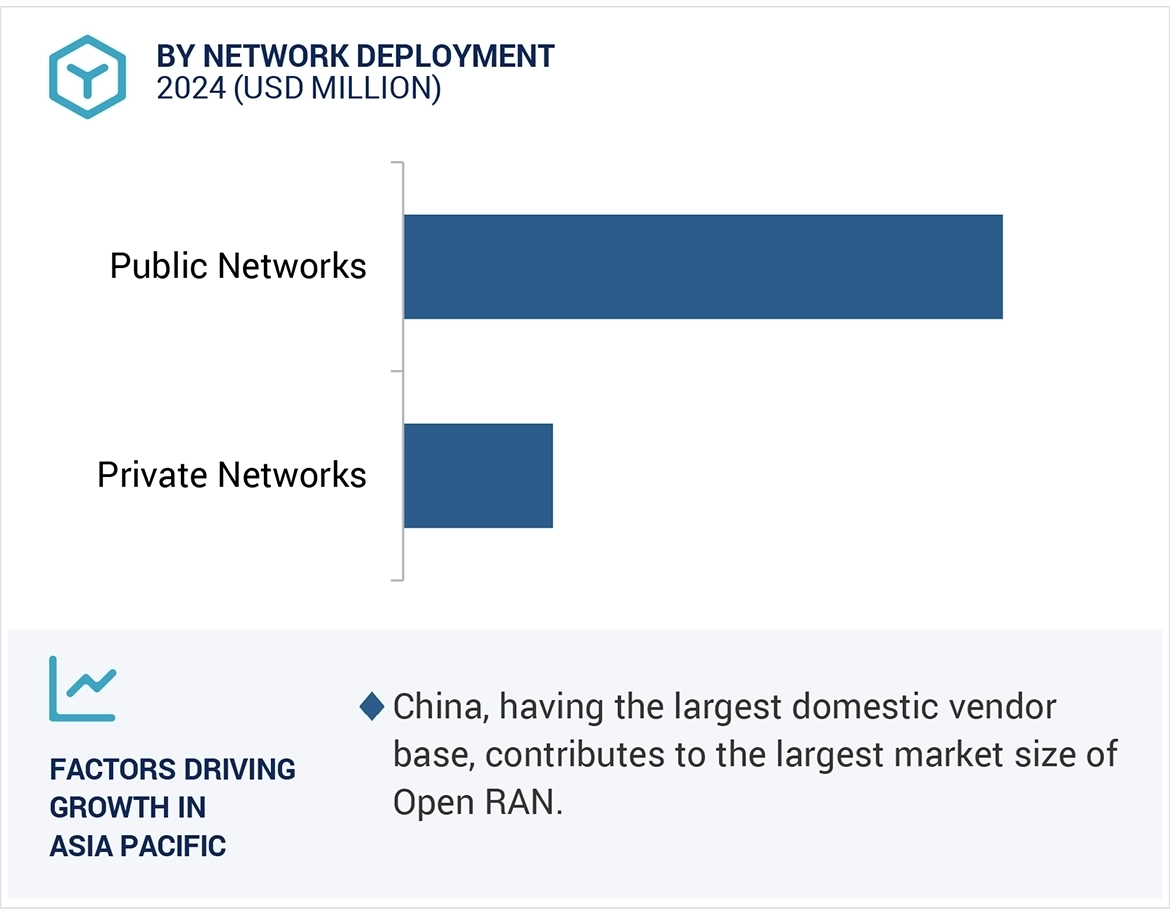
To determine, segment, and forecast the Open RAN market based on offering (hardware, software, and services), network deployment, deployment phase, frequency band, and region in terms of value
-
To forecast the size of the market segments with respect to 5 main regions: North America, Europe, Asia Pacific, Middle East & Africa, and Latin America
-
To provide detailed information about the major factors (drivers, restraints, opportunities, and challenges) influencing the growth of the market
-
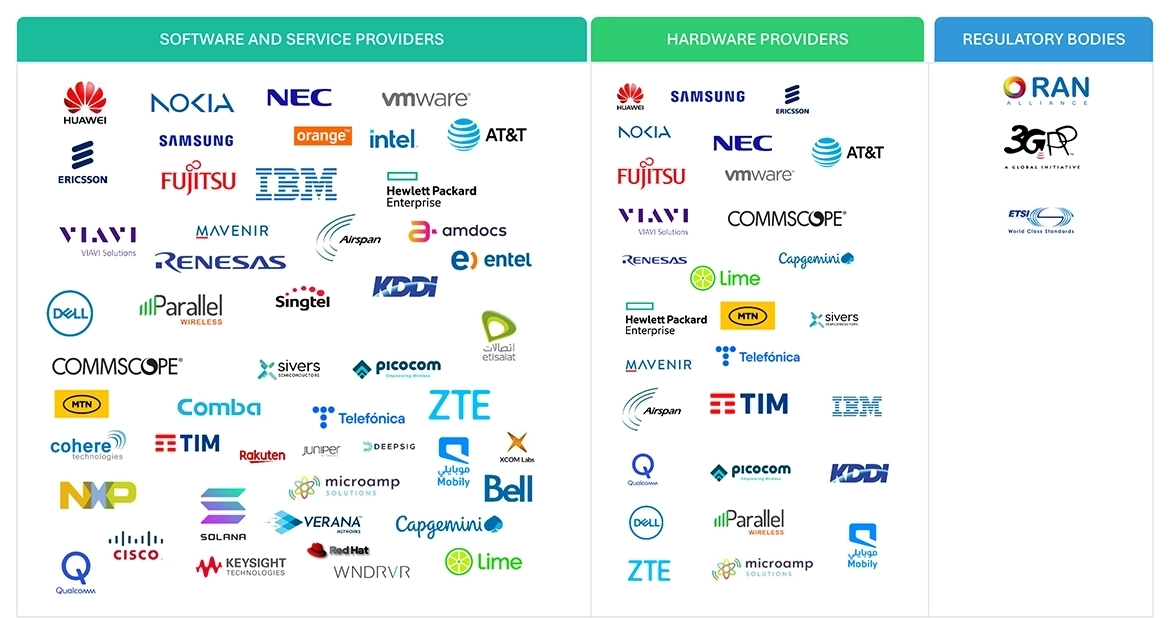
To study the complete value chain and related industry segments and perform a value chain analysis of the market landscape
-
To strategically analyze the macro and micromarkets with respect to individual growth trends, prospects, and contributions to the total market
-
To analyze the industry trends, pricing data, patents, and innovations related to the market
-
To analyze the opportunities for stakeholders by identifying the high-growth segments of the market
-
To profile the key players in the market and comprehensively analyze their market share/ranking and core competencies
-
To track and analyze competitive developments, such as mergers & acquisitions, product launches & developments, partnerships, agreements, collaborations, business expansions, and R&D activities
Available Customizations
With the given market data, MarketsandMarkets offers customizations as per the company’s specific needs. The following customization options are available for the report:
Company Information
-
Detailed analysis and profiling of additional market players (up to 5)


Growth opportunities and latent adjacency in Open Radio Access Network (Open RAN) Market