2
RESEARCH METHODOLOGY
41
5
MARKET OVERVIEW
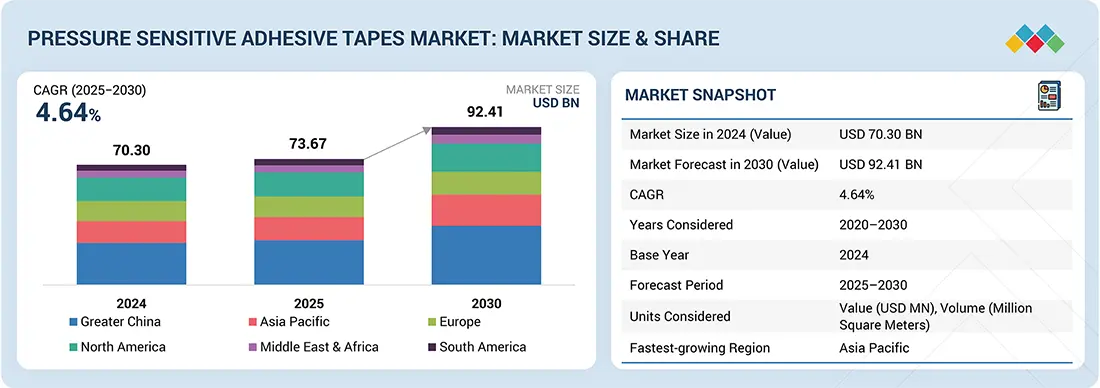
PSA tapes market growth driven by packaging demand, sustainability focus, and EV industry expansion.
59
5.2.1.1
Growing demand for PSA tapes from packaging industry
5.2.1.2
Increasing emphasis on environmental sustainability across various industries
5.2.1.3
Wide use of PSA tapes in electric vehicles
5.2.2.1
Volatility in raw material prices
5.2.3.1
Potential substitutes to traditional fastening systems
5.2.3.2
Advancements in PSA tape technology
5.2.4.1
Implementation of stringent regulatory policies
5.3
PORTER'S FIVE FORCES ANALYSIS
5.3.1
THREAT OF NEW ENTRANTS
5.3.2
THREAT OF SUBSTITUTES
5.3.3
BARGAINING POWER OF SUPPLIERS
5.3.4
BARGAINING POWER OF BUYERS
5.3.5
INTENSITY OF COMPETITIVE RIVALRY
5.4
KEY STAKEHOLDERS AND BUYING CRITERIA
5.4.1
KEY STAKEHOLDERS IN BUYING PROCESS
5.5
MACROECONOMIC OUTLOOK
5.5.1
GDP TRENDS AND FORECAST
6
INDUSTRY TRENDS
Discover how supply chain innovations and pricing trends reshape adhesive tape markets globally.
71
6.1
SUPPLY CHAIN ANALYSIS
6.1.1
RAW MATERIAL SUPPLIERS
6.1.3
DISTRIBUTION NETWORKS
6.2.1
AVERAGE SELLING PRICE OF PRESSURE-SENSITIVE ADHESIVE TAPES OFFERED BY KEY PLAYERS, 2024
6.2.2
AVERAGE SELLING PRICE TREND OF PRESSURE-SENSITIVE ADHESIVE TAPES, BY REGION, 2022–2030
6.3
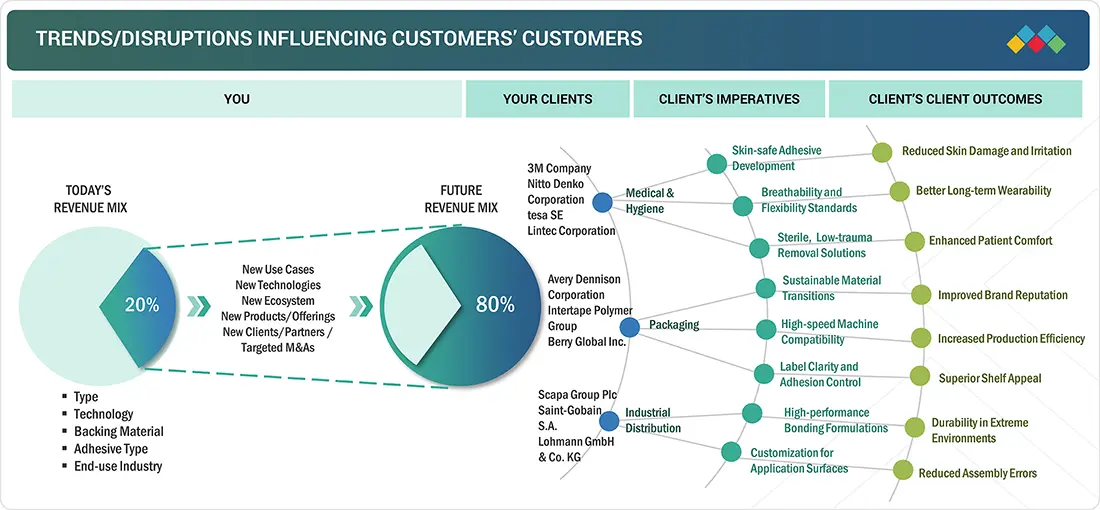
TRENDS/DISRUPTIONS IMPACTING CUSTOMER BUSINESS
6.5.1
STREAMLINING PACKAGING AT MAJOR CHEMICAL MANUFACTURER WITH SPECTAPE
6.5.2
REDUCING VOCS IN AUTOMOTIVE LABELING THROUGH CIRCULAR PSA INNOVATION
6.6.1.1
Adhesive formulation technology
6.6.1.2
Coating and lamination technology
6.6.2
COMPLIMENTARY TECHNOLOGIES
6.6.2.1
Application and dispensing equipment
6.7.1
IMPORT SCENARIO (HS CODE 3919)
6.7.2
EXPORT SCENARIO (HS CODE 3919)
6.8.1
REGULATORY BODIES, GOVERNMENT AGENCIES, AND OTHER ORGANIZATIONS
6.8.2
REGULATORY FRAMEWORK
6.8.2.1
ISO 13485 – Quality Management Systems for Medical Devices
6.8.2.2
RoHS Directive (2011/65/EU) – Restriction of Hazardous Substances
6.9
KEY CONFERENCES AND EVENTS
6.10
INVESTMENT AND FUNDING SCENARIO
6.11.4
JURISDICTION ANALYSIS
6.12
IMPACT OF 2025 US TARIFF – OVERVIEW
6.12.3
PRICE IMPACT ANALYSIS
6.12.4
IMPACT ON COUNTRY/REGION
6.12.5
IMPACT ON END-USE INDUSTRIES:
6.13
IMPACT OF AI/GEN AI ON PRESSURE-SENSITIVE ADHESIVE TAPES MARKET
7
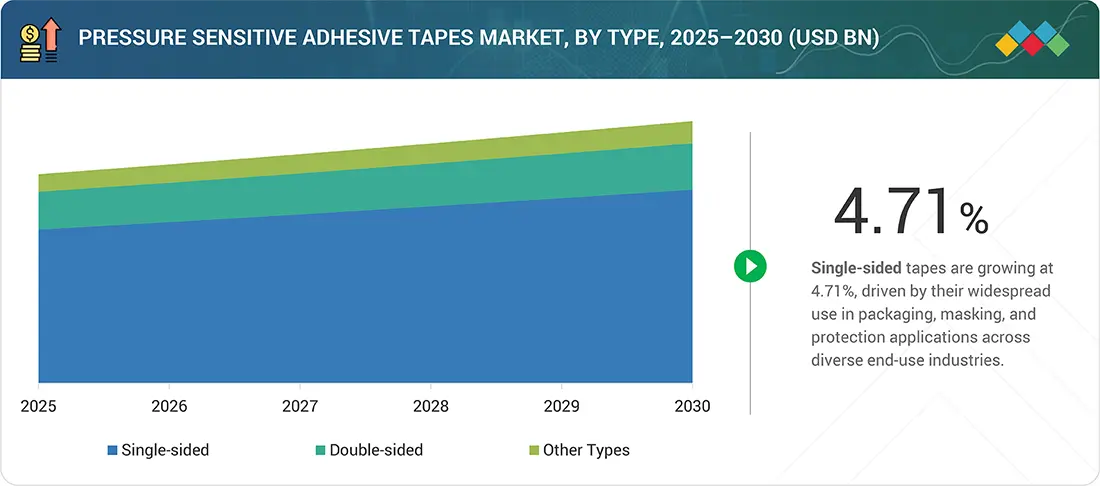
PRESSURE-SENSITIVE ADHESIVE TAPES MARKET, BY TYPE
Market Size & Growth Rate Forecast Analysis to 2030 in USD Million and Square Meters | 16 Data Tables
98
7.2.1
EXPANDING USAGE IN LABELING AND PACKAGING TO DRIVE MARKET
7.3.1
DEMAND FOR AESTHETIC AND SEAMLESS BONDING TO BOOST MARKET
8
PRESSURE-SENSITIVE ADHESIVE TAPES MARKET, BY ADHESIVE TYPE
Market Size & Growth Rate Forecast Analysis to 2030 in USD Million and Square Meters | 20 Data Tables
107
8.2.1
RISING DEMAND FOR HIGH-PERFORMANCE BONDING SOLUTIONS TO DRIVE DEMAND
8.3.1
COST-EFFECTIVENESS OF RUBBER TO BOOST DEMAND
8.4.1
ADVANCED INDUSTRIAL APPLICATIONS TO ACCELERATE SILICONE TAPE ADOPTION
9
PRESSURE-SENSITIVE ADHESIVE TAPES MARKET, BY BACKING MATERIAL
Market Size & Growth Rate Forecast Analysis to 2030 in USD Million and Square Meters | 20 Data Tables
118
9.2.1
STRENGTH AND VERSATILITY ACROSS INDUSTRIES TO FUEL MARKET GROWTH
9.3.1
ECO-FRIENDLY PACKAGING AND PROCESS EFFICIENCY TO DRIVE MARKET
9.4.1
DURABILITY AND ELECTRICAL INSULATION PROPERTIES TO DRIVE DEMAND
9.5
OTHER BACKING MATERIALS
10
PRESSURE-SENSITIVE ADHESIVE TAPES MARKET, BY TECHNOLOGY
Market Size & Growth Rate Forecast Analysis to 2030 in USD Million and Square Meters | 16 Data Tables
129
10.2
SOLVENT-BASED TECHNOLOGY
10.2.1
HIGH BOND STRENGTH AND MATERIAL COMPATIBILITY TO DRIVE MARKET
10.3
WATER-BASED TECHNOLOGY
10.3.1
ECO-FRIENDLY FORMULATIONS AND SAFER PRODUCTION TO BOOST MARKET DEMAND
10.4
HOT MELT-BASED TECHNOLOGY
10.4.1
RAPID PROCESSING AND HIGH TACK EFFICIENCY TO FUEL MARKET GROWTH
11
PRESSURE-SENSITIVE ADHESIVE TAPES MARKET, BY END-USE INDUSTRY
Market Size & Growth Rate Forecast Analysis to 2030 in USD Million and Square Meters | 40 Data Tables
138
11.2.1
RISING DEMAND FOR FUNCTIONAL AND DECORATIVE ADHESIVE SOLUTIONS TO DRIVE MARKET
11.3.1
ELECTRONICS MINIATURIZATION AND ASSEMBLY EFFICIENCY TO FUEL DEMAND
11.4.1
LIGHTWEIGHT AND DURABLE BONDING SOLUTIONS TO DRIVE MARKET
11.5
ELECTRICAL SYSTEM/WIRE HARNESSING
11.5.1
SAFE AND DURABLE WIRE MANAGEMENT TO BOOST MARKET DEMAND
11.6
INDUSTRIAL DISTRIBUTION
11.6.1
RELIABLE SUPPLY CHAIN OPERATIONS TO FUEL GROWTH
11.7
FLEXO PRINTING & PAPER
11.7.1
PRINTING PRECISION AND OPERATIONAL UPTIME TO FUEL MARKET DEMAND
11.8.1
ADVANCED HEALTHCARE AND HYGIENE NEEDS TO FUEL ADOPTION
11.9.1
SUSTAINABLE AND TAMPER-PROOF SOLUTIONS TO DRIVE DEMAND
11.10
OTHER END-USE INDUSTRIES
12
PRESSURE-SENSITIVE ADHESIVE TAPES MARKET, BY REGION
Market Size & Growth Rate Forecast Analysis to 2030 in USD Million and Square Meters | 240 Data Tables
160
12.2.1.1
Rapidly expanding economy to boost market
12.2.2.1
Strong semiconductor and electronics base to drive demand
12.2.3.1
Active re-export trade to boost demand
12.3.1.1
Strong presence of automobile manufacturers to drive market
12.3.2.1
Growing healthcare industry to drive demand
12.3.3.1
Government initiatives in industrial sector to drive market
12.3.4.1
Growing electronics manufacturing ecosystem to fuel growth
12.4.1.1
Strong industrial infrastructure to fuel growth
12.4.2.1
Focus on advanced research and development to drive demand
12.4.3.1
Expanding manufacturing sector to support market growth
12.5.1.1
Automotive industry leadership to boost market
12.5.2.1
Emphasis on sustainable packaging to fuel demand
12.5.3.1
Stringent regulatory framework to propel market
12.5.4.1
Growing aerospace industry to drive market
12.5.5.1
Advanced logistics and export activities to drive demand
12.5.6.1
Robust industrial base to drive demand
12.6
MIDDLE EAST & AFRICA
12.6.1.1
Growth in local manufacturing to fuel demand
12.6.2.1
Foreign investments and rapid urbanization to drive market
12.6.3.1
Rising automotive parts manufacturing to boost demand
12.6.4.1
Cheap labor and raw material cost to drive market
12.7.1.1
Rising infrastructure investments to drive demand
12.7.2.1
Expansion of public healthcare services to drive demand
12.7.3.1
Packaging and food exports growth to fuel demand
13
COMPETITIVE LANDSCAPE
Discover dominant strategies and market positions shaping the competitive edge in 2024.
255
13.2
KEY PLAYER STRATEGIES/RIGHT TO WIN
13.3
MARKET SHARE ANALYSIS, 2024
13.4
REVENUE ANALYSIS OF TOP FIVE PLAYERS, 2020–2024
13.5
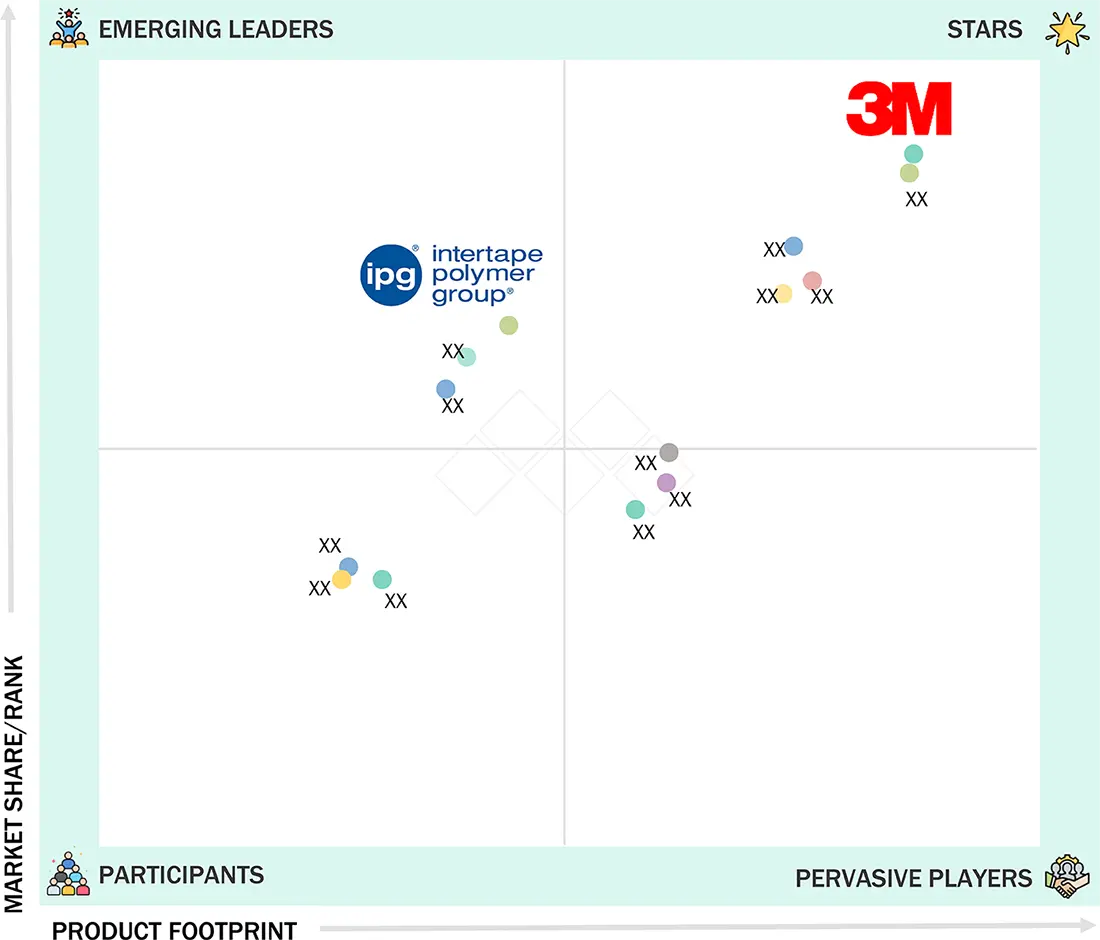
COMPANY EVALUATION MATRIX: KEY PLAYERS, 2024
13.5.5
COMPANY FOOTPRINT: KEY PLAYERS, 2024
13.5.5.1
Company footprint
13.5.5.2
Region footprint
13.5.5.4
Adhesive type footprint
13.5.5.5
Backing material footprint
13.5.5.6
Technology footprint
13.5.5.7
End-use industry footprint
13.6
COMPANY EVALUATION MATRIX: STARTUPS/SMES, 2024
13.6.1
PROGRESSIVE COMPANIES
13.6.2
RESPONSIVE COMPANIES
13.6.5
COMPETITIVE BENCHMARKING: STARTUPS/SMES, 2024
13.6.5.1
Detailed list of key startups/SMES
13.6.5.2
Competitive benchmarking of key startups/SMEs
13.7
BRAND/PRODUCT COMPARISON ANALYSIS
13.8
COMPANY VALUATION AND FINANCIAL METRICS
13.9
COMPETITIVE SCENARIO
14
COMPANY PROFILES
In-depth Company Profiles of Leading Market Players with detailed Business Overview, Product and Service Portfolio, Recent Developments, and Unique Analyst Perspective (MnM View)
277
14.1.1.1
Business overview
14.1.1.2
Products/Solutions/Services offered
14.1.1.3
Recent developments
14.1.3
NITTO DENKO CORPORATION
14.1.4
LINTEC CORPORATION
14.1.5
INTERTAPE POLYMER GROUP INC.
14.1.6
AVERY DENNISON CORPORATION
14.1.7
LOHMANN GMBH & CO. KG
14.1.8
BERRY GLOBAL GROUP, INC.
14.1.9
SCAPA GROUP PLC (MATIV HOLDINGS)
14.1.10
SAINT-GOBAIN S.A.
14.2.1
NICHIBAN CO., LTD.
14.2.2
SHURTAPE TECHNOLOGIES, LLC
14.2.3
ROGERS CORPORATION
14.2.4
GERGONNE INDUSTRIE
14.2.5
ORAFOL EUROPE GMBH
14.2.6
PPI ADHESIVE PRODUCTS (C.E.) S.R.O.
14.2.7
AMERICAN BILTRITE INC.
14.2.8
TERAOKA SEISAKUSHO CO., LTD.
14.2.9
ADVANCE TAPES INTERNATIONAL
14.2.11
BOLEX (SHENZHEN) ADHESIVE PRODUCTS CO., LTD.
14.2.13
SUN CHEMICAL (DIC CORPORATION)
14.2.14
PPM INDUSTRIES SPA
15
ADJACENT & RELATED MARKETS
312
15.3
ADHESIVE TAPES MARKET
15.4
ADHESIVE TAPES MARKET, BY REGION
15.4.4
MIDDLE EAST & AFRICA
16.2
KNOWLEDGESTORE: MARKETSANDMARKETS’ SUBSCRIPTION PORTAL
16.3
CUSTOMIZATION OPTIONS
TABLE 1
PRESSURE-SENSITIVE ADHESIVE TAPES MARKET: DEFINITION AND INCLUSIONS, BY TYPE
TABLE 2
PRESSURE-SENSITIVE ADHESIVE TAPES MARKET: DEFINITION AND INCLUSIONS, BY ADHESIVE TYPE
TABLE 3
PRESSURE-SENSITIVE ADHESIVE TAPES MARKET: DEFINITION AND INCLUSIONS, BY BACKING MATERIAL
TABLE 4
PRESSURE-SENSITIVE ADHESIVE TAPES MARKET: DEFINITION AND INCLUSIONS, BY TECHNOLOGY
TABLE 5
PRESSURE-SENSITIVE ADHESIVE TAPES MARKET: DEFINITION AND INCLUSIONS, BY END-USE INDUSTRY
TABLE 6
PRESSURE-SENSITIVE ADHESIVE TAPES MARKET: PORTER'S FIVE FORCES ANALYSIS
TABLE 7
IMPACT OF STAKEHOLDERS ON BUYING PROCESS OF TOP THREE END-USE INDUSTRIES (%)
TABLE 8
KEY BUYING CRITERIA FOR TOP THREE END-USE INDUSTRIES
TABLE 9
GDP TRENDS AND FORECAST OF MAJOR ECONOMIES, 2021–2030 (USD BILLION)
TABLE 10
AVERAGE SELLING PRICE OF PRESSURE-SENSITIVE ADHESIVE TAPES OFFERED BY KEY PLAYERS, BY ADHESIVE TYPE, 2024 (USD/SQUARE METER)
TABLE 11
AVERAGE SELLING PRICE TREND OF PRESSURE-SENSITIVE ADHESIVE TAPES, BY REGION, 2022–2030 (USD/SQUARE METER)
TABLE 12
ROLE OF COMPANIES IN PRESSURE-SENSITIVE ADHESIVE TAPES ECOSYSTEM
TABLE 13
IMPORT DATA RELATED TO PRESSURE-SENSITIVE ADHESIVE TAPES, BY REGION, 2019–2024 (USD MILLION)
TABLE 14
EXPORT DATA RELATED TO PRESSURE-SENSITIVE ADHESIVE TAPES, BY REGION, 2019–2024 (USD MILLION)
TABLE 15
GLOBAL: REGULATORY BODIES, GOVERNMENT AGENCIES, AND OTHER ORGANIZATIONS
TABLE 16
NORTH AMERICA: REGULATORY BODIES, GOVERNMENT AGENCIES, AND OTHER ORGANIZATIONS
TABLE 17
EUROPE: REGULATORY BODIES, GOVERNMENT AGENCIES, AND OTHER ORGANIZATIONS
TABLE 18
ASIA PACIFIC: REGULATORY BODIES, GOVERNMENT AGENCIES, AND OTHER ORGANIZATIONS
TABLE 19
MIDDLE EAST & AFRICA: REGULATORY BODIES, GOVERNMENT AGENCIES, AND OTHER ORGANIZATIONS
TABLE 20
SOUTH AMERICA: REGULATORY BODIES, GOVERNMENT AGENCIES, AND OTHER ORGANIZATIONS
TABLE 21
PRESSURE-SENSITIVE ADHESIVE TAPES MARKET: LIST OF KEY CONFERENCES AND EVENTS, 2025–2026
TABLE 22
PRESSURE-SENSITIVE ADHESIVE TAPES MARKET: FUNDING/INVESTMENT SCENARIO
TABLE 23
PATENT STATUS: PATENT APPLICATIONS, LIMITED PATENTS, AND GRANTED PATENTS, 2014–2024
TABLE 24
LIST OF MAJOR PATENTS RELATED TO PRESSURE-SENSITIVE ADHESIVE TAPES, 2014–2024
TABLE 25
PATENTS BY 3M INNOVATIVE PROPERTIES COMPANY
TABLE 26
US ADJUSTED RECIPROCAL TARIFF RATES
TABLE 27
PRESSURE-SENSITIVE ADHESIVE TAPES MARKET, BY TYPE, 2020–2024 (USD MILLION)
TABLE 28
PRESSURE-SENSITIVE ADHESIVE TAPES MARKET, BY TYPE, 2025–2030 (USD MILLION)
TABLE 29
PRESSURE-SENSITIVE ADHESIVE TAPES MARKET, BY TYPE, 2020–2024 (MILLION SQUARE METER)
TABLE 30
PRESSURE-SENSITIVE ADHESIVE TAPES MARKET, BY TYPE, 2025–2030 (MILLION SQUARE METER)
TABLE 31
SINGLE-SIDED TAPES: PRESSURE-SENSITIVE ADHESIVE TAPES MARKET, BY REGION, 2020–2024 (USD MILLION)
TABLE 32
SINGLE-SIDED TAPES: PRESSURE-SENSITIVE ADHESIVE TAPES MARKET, BY REGION, 2025–2030 (USD MILLION)
TABLE 33
SINGLE-SIDED TAPES: PRESSURE-SENSITIVE ADHESIVE TAPES MARKET, BY REGION, 2020–2024 (MILLION SQUARE METER)
TABLE 34
SINGLE-SIDED TAPES: PRESSURE-SENSITIVE ADHESIVE TAPES MARKET, BY REGION, 2025–2030 (MILLION SQUARE METER)
TABLE 35
DOUBLE-SIDED TAPES: PRESSURE-SENSITIVE ADHESIVE TAPES MARKET, BY REGION, 2020–2024 (USD MILLION)
TABLE 36
DOUBLE-SIDED TAPES: PRESSURE-SENSITIVE ADHESIVE TAPES MARKET, BY REGION, 2025–2030 (USD MILLION)
TABLE 37
DOUBLE-SIDED TAPES: PRESSURE-SENSITIVE ADHESIVE TAPES MARKET, BY REGION, 2020–2024 (MILLION SQUARE METER)
TABLE 38
DOUBLE-SIDED TAPES: PRESSURE-SENSITIVE ADHESIVE TAPES MARKET, BY REGION, 2025–2030 (MILLION SQUARE METER)
TABLE 39
OTHER TYPES: PRESSURE-SENSITIVE ADHESIVE TAPES MARKET, BY REGION, 2020–2024 (USD MILLION)
TABLE 40
OTHER TYPES: PRESSURE-SENSITIVE ADHESIVE TAPES MARKET, BY REGION, 2025–2030 (USD MILLION)
TABLE 41
OTHER TYPES: PRESSURE-SENSITIVE ADHESIVE TAPES MARKET, BY REGION, 2020–2024 (MILLION SQUARE METER)
TABLE 42
OTHER TYPES: PRESSURE-SENSITIVE ADHESIVE TAPES MARKET, BY REGION, 2025–2030 (MILLION SQUARE METER)
TABLE 43
PRESSURE-SENSITIVE ADHESIVE TAPES MARKET, BY ADHESIVE TYPE, 2020–2024 (USD MILLION)
TABLE 44
PRESSURE-SENSITIVE ADHESIVE TAPES MARKET, BY ADHESIVE TYPE, 2025–2030 (USD MILLION)
TABLE 45
PRESSURE-SENSITIVE ADHESIVE TAPES MARKET, BY ADHESIVE TYPE, 2020–2024 (MILLION SQUARE METER)
TABLE 46
PRESSURE-SENSITIVE ADHESIVE TAPES MARKET, BY ADHESIVE TYPE, 2025–2030 (MILLION SQUARE METER)
TABLE 47
ACRYLIC: PRESSURE-SENSITIVE ADHESIVE TAPES MARKET, BY REGION, 2020–2024 (USD MILLION)
TABLE 48
ACRYLIC: PRESSURE-SENSITIVE ADHESIVE TAPES MARKET, BY REGION, 2025–2030 (USD MILLION)
TABLE 49
ACRYLIC: PRESSURE-SENSITIVE ADHESIVE TAPES MARKET, BY REGION, 2020–2024 (MILLION SQUARE METER)
TABLE 50
ACRYLIC: PRESSURE-SENSITIVE ADHESIVE TAPES MARKET, BY REGION, 2025–2030 (MILLION SQUARE METER)
TABLE 51
RUBBER: PRESSURE-SENSITIVE ADHESIVE TAPES MARKET, BY REGION, 2020–2024 (USD MILLION)
TABLE 52
RUBBER: PRESSURE-SENSITIVE ADHESIVE TAPES MARKET, BY REGION, 2025–2030 (USD MILLION)
TABLE 53
RUBBER: PRESSURE-SENSITIVE ADHESIVE TAPES MARKET, BY REGION, 2020–2024 (MILLION SQUARE METER)
TABLE 54
RUBBER: PRESSURE-SENSITIVE ADHESIVE TAPES MARKET, BY REGION, 2025–2030 (MILLION SQUARE METER)
TABLE 55
SILICONE: PRESSURE-SENSITIVE ADHESIVE TAPES MARKET, BY REGION, 2020–2024 (USD MILLION)
TABLE 56
SILICONE: PRESSURE-SENSITIVE ADHESIVE TAPES MARKET, BY REGION, 2025–2030 (USD MILLION)
TABLE 57
SILICONE: PRESSURE-SENSITIVE ADHESIVE TAPES MARKET, BY REGION, 2020–2024 (MILLION SQUARE METER)
TABLE 58
SILICONE: PRESSURE-SENSITIVE ADHESIVE TAPES MARKET, BY REGION, 2025–2030 (MILLION SQUARE METER)
TABLE 59
OTHER ADHESIVE TYPES: PRESSURE-SENSITIVE ADHESIVE TAPES MARKET, BY REGION, 2020–2024 (USD MILLION)
TABLE 60
OTHER ADHESIVE TYPES: PRESSURE-SENSITIVE ADHESIVE TAPES MARKET, BY REGION, 2025–2030 (USD MILLION)
TABLE 61
OTHER ADHESIVE TYPES: PRESSURE-SENSITIVE ADHESIVE TAPES MARKET, BY REGION, 2020–2024 (MILLION SQUARE METER)
TABLE 62
OTHER ADHESIVE TYPES: PRESSURE-SENSITIVE ADHESIVE TAPES MARKET, BY REGION, 2025–2030 (MILLION SQUARE METER)
TABLE 63
PRESSURE-SENSITIVE ADHESIVE TAPES MARKET, BY BACKING MATERIAL, 2020–2024 (USD MILLION)
TABLE 64
PRESSURE-SENSITIVE ADHESIVE TAPES MARKET, BY BACKING MATERIAL, 2025–2030 (USD MILLION)
TABLE 65
PRESSURE-SENSITIVE ADHESIVE TAPES MARKET, BY BACKING MATERIAL, 2020–2024 (MILLION SQUARE METER)
TABLE 66
PRESSURE-SENSITIVE ADHESIVE TAPES MARKET, BY BACKING MATERIAL, 2025–2030 (MILLION SQUARE METER)
TABLE 67
POLYPROPYLENE: PRESSURE-SENSITIVE ADHESIVE TAPES MARKET, BY REGION, 2020–2024 (USD MILLION)
TABLE 68
POLYPROPYLENE: PRESSURE-SENSITIVE ADHESIVE TAPES MARKET, BY REGION, 2025–2030 (USD MILLION)
TABLE 69
POLYPROPYLENE: PRESSURE-SENSITIVE ADHESIVE TAPES MARKET, BY REGION, 2020–2024 (MILLION SQUARE METER)
TABLE 70
POLYPROPYLENE: PRESSURE-SENSITIVE ADHESIVE TAPES MARKET, BY REGION, 2025–2030 (MILLION SQUARE METER)
TABLE 71
PAPER: PRESSURE-SENSITIVE ADHESIVE TAPES MARKET, BY REGION, 2020–2024 (USD MILLION)
TABLE 72
PAPER: PRESSURE-SENSITIVE ADHESIVE TAPES MARKET, BY REGION, 2025–2030 (USD MILLION)
TABLE 73
PAPER: PRESSURE-SENSITIVE ADHESIVE TAPES MARKET, BY REGION, 2020–2024 (MILLION SQUARE METER)
TABLE 74
PAPER: PRESSURE-SENSITIVE ADHESIVE TAPES MARKET, BY REGION, 2025–2030 (MILLION SQUARE METER)
TABLE 75
POLYVINYL CHLORIDE: PRESSURE-SENSITIVE ADHESIVE TAPES MARKET, BY REGION, 2020–2024 (USD MILLION)
TABLE 76
POLYVINYL CHLORIDE: PRESSURE-SENSITIVE ADHESIVE TAPES MARKET, BY REGION, 2025–2030 (USD MILLION)
TABLE 77
POLYVINYL CHLORIDE: PRESSURE-SENSITIVE ADHESIVE TAPES MARKET, BY REGION, 2020–2024 (MILLION SQUARE METER)
TABLE 78
POLYVINYL CHLORIDE: PRESSURE-SENSITIVE ADHESIVE TAPES MARKET, BY REGION, 2025–2030 (MILLION SQUARE METER)
TABLE 79
OTHER BACKING MATERIALS: PRESSURE-SENSITIVE ADHESIVE TAPES MARKET, BY REGION, 2020–2024 (USD MILLION)
TABLE 80
OTHER BACKING MATERIALS: PRESSURE-SENSITIVE ADHESIVE TAPES MARKET, BY REGION, 2025–2030 (USD MILLION)
TABLE 81
OTHER BACKING MATERIALS: PRESSURE-SENSITIVE ADHESIVE TAPES MARKET, BY REGION, 2020–2024 (MILLION SQUARE METER)
TABLE 82
OTHER BACKING MATERIALS: PRESSURE-SENSITIVE ADHESIVE TAPES MARKET, BY REGION, 2025–2030 (MILLION SQUARE METER)
TABLE 83
PRESSURE-SENSITIVE ADHESIVE TAPES MARKET, BY TECHNOLOGY, 2020–2024 (USD MILLION)
TABLE 84
PRESSURE-SENSITIVE ADHESIVE TAPES MARKET, BY TECHNOLOGY, 2025–2030 (USD MILLION)
TABLE 85
PRESSURE-SENSITIVE ADHESIVE TAPES MARKET, BY TECHNOLOGY, 2020–2024 (MILLION SQUARE METER)
TABLE 86
PRESSURE-SENSITIVE ADHESIVE TAPES MARKET, BY TECHNOLOGY, 2025–2030 (MILLION SQUARE METER)
TABLE 87
SOLVENT-BASED: PRESSURE-SENSITIVE ADHESIVE TAPES MARKET, BY REGION, 2020–2024 (USD MILLION)
TABLE 88
SOLVENT-BASED: PRESSURE-SENSITIVE ADHESIVE TAPES MARKET, BY REGION, 2025–2030 (USD MILLION)
TABLE 89
SOLVENT-BASED: PRESSURE-SENSITIVE ADHESIVE TAPES MARKET, BY REGION, 2020–2024 (MILLION SQUARE METER)
TABLE 90
SOLVENT-BASED: PRESSURE-SENSITIVE ADHESIVE TAPES MARKET, BY REGION, 2025–2030 (MILLION SQUARE METER)
TABLE 91
WATER-BASED: PRESSURE-SENSITIVE ADHESIVE TAPES MARKET, BY REGION, 2020–2024 (USD MILLION)
TABLE 92
WATER-BASED: PRESSURE-SENSITIVE ADHESIVE TAPES MARKET, BY REGION, 2025–2030 (USD MILLION)
TABLE 93
WATER-BASED: PRESSURE-SENSITIVE ADHESIVE TAPES MARKET, BY REGION, 2020–2024 (MILLION SQUARE METER)
TABLE 94
WATER-BASED: PRESSURE-SENSITIVE ADHESIVE TAPES MARKET, BY REGION, 2025–2030 (MILLION SQUARE METER)
TABLE 95
HOT MELT: PRESSURE-SENSITIVE ADHESIVE TAPES MARKET, BY REGION, 2020–2024 (USD MILLION)
TABLE 96
HOT MELT: PRESSURE-SENSITIVE ADHESIVE TAPES MARKET, BY REGION, 2025–2030 (USD MILLION)
TABLE 97
HOT MELT: PRESSURE-SENSITIVE ADHESIVE TAPES MARKET, BY REGION, 2020–2024 (MILLION SQUARE METER)
TABLE 98
HOT MELT: PRESSURE-SENSITIVE ADHESIVE TAPES MARKET, BY REGION, 2025–2030 (MILLION SQUARE METER)
TABLE 99
PRESSURE-SENSITIVE ADHESIVE TAPES MARKET, BY END-USE INDUSTRY, 2020–2024 (USD MILLION)
TABLE 100
PRESSURE-SENSITIVE ADHESIVE TAPES MARKET, BY END-USE INDUSTRY, 2025–2030 (USD MILLION)
TABLE 101
PRESSURE-SENSITIVE ADHESIVE TAPES MARKET, BY END-USE INDUSTRY, 2020–2024 (MILLION SQUARE METER)
TABLE 102
PRESSURE-SENSITIVE ADHESIVE TAPES MARKET, BY END-USE INDUSTRY, 2025–2030 (MILLION SQUARE METER)
TABLE 103
CONSUMER: PRESSURE-SENSITIVE ADHESIVE TAPES MARKET, BY REGION, 2020–2024 (USD MILLION)
TABLE 104
CONSUMER: PRESSURE-SENSITIVE ADHESIVE TAPES MARKET, BY REGION, 2025–2030 (USD MILLION)
TABLE 105
CONSUMER: PRESSURE-SENSITIVE ADHESIVE TAPES MARKET, BY REGION, 2020–2024 (MILLION SQUARE METER)
TABLE 106
CONSUMER: PRESSURE-SENSITIVE ADHESIVE TAPES MARKET, BY REGION, 2025–2030 (MILLION SQUARE METER)
TABLE 107
ELECTRONICS: PRESSURE-SENSITIVE ADHESIVE TAPES MARKET, BY REGION, 2020–2024 (USD MILLION)
TABLE 108
ELECTRONICS: PRESSURE-SENSITIVE ADHESIVE TAPES MARKET, BY REGION, 2025–2030 (USD MILLION)
TABLE 109
ELECTRONICS: PRESSURE-SENSITIVE ADHESIVE TAPES MARKET, BY REGION, 2020–2024 (MILLION SQUARE METER)
TABLE 110
ELECTRONICS: PRESSURE-SENSITIVE ADHESIVE TAPES MARKET, BY REGION, 2025–2030 (MILLION SQUARE METER)
TABLE 111
AUTOMOTIVE: PRESSURE-SENSITIVE ADHESIVE TAPES MARKET, BY REGION, 2020–2024 (USD MILLION)
TABLE 112
AUTOMOTIVE: PRESSURE-SENSITIVE ADHESIVE TAPES MARKET, BY REGION, 2025–2030 (USD MILLION)
TABLE 113
AUTOMOTIVE: PRESSURE-SENSITIVE ADHESIVE TAPES MARKET, BY REGION, 2020–2024 (MILLION SQUARE METER)
TABLE 114
AUTOMOTIVE: PRESSURE-SENSITIVE ADHESIVE TAPES MARKET, BY REGION, 2025–2030 (MILLION SQUARE METER)
TABLE 115
ELECTRICAL SYSTEM/WIRE HARNESSING: PRESSURE-SENSITIVE ADHESIVE TAPES MARKET, BY REGION, 2020–2024 (USD MILLION)
TABLE 116
ELECTRICAL SYSTEM/WIRE HARNESSING: PRESSURE-SENSITIVE ADHESIVE TAPES MARKET, BY REGION, 2025–2030 (USD MILLION)
TABLE 117
ELECTRICAL SYSTEM/WIRE HARNESSING: PRESSURE-SENSITIVE ADHESIVE TAPES MARKET, BY REGION, 2020–2024 (MILLION SQUARE METER)
TABLE 118
ELECTRICAL SYSTEM/WIRE HARNESSING: PRESSURE-SENSITIVE ADHESIVE TAPES MARKET, BY REGION, 2025–2030 (MILLION SQUARE METER)
TABLE 119
INDUSTRIAL DISTRIBUTION: PRESSURE-SENSITIVE ADHESIVE TAPES MARKET, BY REGION, 2020–2024 (USD MILLION)
TABLE 120
INDUSTRIAL DISTRIBUTION: PRESSURE-SENSITIVE ADHESIVE TAPES MARKET, BY REGION, 2025–2030 (USD MILLION)
TABLE 121
INDUSTRIAL DISTRIBUTION: PRESSURE-SENSITIVE ADHESIVE TAPES MARKET, BY REGION, 2020–2024 (MILLION SQUARE METER)
TABLE 122
INDUSTRIAL DISTRIBUTION: PRESSURE-SENSITIVE ADHESIVE TAPES MARKET, BY REGION, 2025–2030 (MILLION SQUARE METER)
TABLE 123
FLEXO PRINTING & PAPER: PRESSURE-SENSITIVE ADHESIVE TAPES MARKET, BY REGION, 2020–2024 (USD MILLION)
TABLE 124
FLEXO PRINTING & PAPER: PRESSURE-SENSITIVE ADHESIVE TAPES MARKET, BY REGION, 2025–2030 (USD MILLION)
TABLE 125
FLEXO PRINTING & PAPER: PRESSURE-SENSITIVE ADHESIVE TAPES MARKET, BY REGION, 2020–2024 (MILLION SQUARE METER)
TABLE 126
FLEXO PRINTING & PAPER: PRESSURE-SENSITIVE ADHESIVE TAPES MARKET, BY REGION, 2025–2030 (MILLION SQUARE METER)
TABLE 127
MEDICAL & HYGIENE: PRESSURE-SENSITIVE ADHESIVE TAPES MARKET, BY REGION, 2020–2024 (USD MILLION)
TABLE 128
MEDICAL & HYGIENE: PRESSURE-SENSITIVE ADHESIVE TAPES MARKET, BY REGION, 2025–2030 (USD MILLION)
TABLE 129
MEDICAL & HYGIENE: PRESSURE-SENSITIVE ADHESIVE TAPES MARKET, BY REGION, 2020–2024 (MILLION SQUARE METER)
TABLE 130
MEDICAL & HYGIENE: PRESSURE-SENSITIVE ADHESIVE TAPES MARKET, BY REGION, 2025–2030 (MILLION SQUARE METER)
TABLE 131
PACKAGING: PRESSURE-SENSITIVE ADHESIVE TAPES MARKET, BY REGION, 2020–2024 (USD MILLION)
TABLE 132
PACKAGING: PRESSURE-SENSITIVE ADHESIVE TAPES MARKET, BY REGION, 2025–2030 (USD MILLION)
TABLE 133
PACKAGING: PRESSURE-SENSITIVE ADHESIVE TAPES MARKET, BY REGION, 2020–2024 (MILLION SQUARE METER)
TABLE 134
PACKAGING: PRESSURE-SENSITIVE ADHESIVE TAPES MARKET, BY REGION, 2025–2030 (MILLION SQUARE METER)
TABLE 135
OTHER END-USE INDUSTRIES: PRESSURE-SENSITIVE ADHESIVE TAPES MARKET, BY REGION, 2020–2024 (USD MILLION)
TABLE 136
OTHER END-USE INDUSTRIES: PRESSURE-SENSITIVE ADHESIVE TAPES MARKET, BY REGION, 2025–2030 (USD MILLION)
TABLE 137
OTHER END-USE INDUSTRIES: PRESSURE-SENSITIVE ADHESIVE TAPES MARKET, BY REGION, 2020–2024 (MILLION SQUARE METER)
TABLE 138
OTHER END-USE INDUSTRIES: PRESSURE-SENSITIVE ADHESIVE TAPES MARKET, BY REGION, 2025–2030 (MILLION SQUARE METER)
TABLE 139
PRESSURE-SENSITIVE ADHESIVE TAPES MARKET, BY REGION, 2020–2024 (USD MILLION)
TABLE 140
PRESSURE-SENSITIVE ADHESIVE TAPES MARKET, BY REGION, 2025–2030 (USD MILLION)
TABLE 141
PRESSURE-SENSITIVE ADHESIVE TAPES MARKET, BY REGION, 2020–2024 (MILLION SQUARE METER)
TABLE 142
PRESSURE-SENSITIVE ADHESIVE TAPES MARKET, BY REGION, 2025–2030 (MILLION SQUARE METER)
TABLE 143
GREATER CHINA: PRESSURE-SENSITIVE ADHESIVE TAPES MARKET, BY TYPE, 2020–2024 (USD MILLION)
TABLE 144
GREATER CHINA: PRESSURE-SENSITIVE ADHESIVE TAPES MARKET, BY TYPE, 2025–2030 (USD MILLION)
TABLE 145
GREATER CHINA: PRESSURE-SENSITIVE ADHESIVE TAPES MARKET, BY TYPE, 2020–2024 (MILLION SQUARE METER)
TABLE 146
GREATER CHINA: PRESSURE-SENSITIVE ADHESIVE TAPES MARKET, BY TYPE, 2025–2030 (MILLION SQUARE METER)
TABLE 147
GREATER CHINA: PRESSURE-SENSITIVE ADHESIVE TAPES MARKET, BY ADHESIVE TYPE, 2020–2024 (USD MILLION)
TABLE 148
GREATER CHINA: PRESSURE-SENSITIVE ADHESIVE TAPES MARKET, BY ADHESIVE TYPE, 2025–2030 (USD MILLION)
TABLE 149
GREATER CHINA: PRESSURE-SENSITIVE ADHESIVE TAPES MARKET, BY ADHESIVE TYPE, 2020–2024 (MILLION SQUARE METER)
TABLE 150
GREATER CHINA: PRESSURE-SENSITIVE ADHESIVE TAPES MARKET, BY ADHESIVE TYPE, 2025–2030 (MILLION SQUARE METER)
TABLE 151
GREATER CHINA: PRESSURE-SENSITIVE ADHESIVE TAPES MARKET, BY BACKING MATERIAL, 2020–2024 (USD MILLION)
TABLE 152
GREATER CHINA: PRESSURE-SENSITIVE ADHESIVE TAPES MARKET, BY BACKING MATERIAL, 2025–2030 (USD MILLION)
TABLE 153
GREATER CHINA: PRESSURE-SENSITIVE ADHESIVE TAPES MARKET, BY BACKING MATERIAL, 2020–2024 (MILLION SQUARE METER)
TABLE 154
GREATER CHINA: PRESSURE-SENSITIVE ADHESIVE TAPES MARKET, BY BACKING MATERIAL, 2025–2030 (MILLION SQUARE METER)
TABLE 155
GREATER CHINA: PRESSURE-SENSITIVE ADHESIVE TAPES MARKET, BY TECHNOLOGY, 2020–2024 (USD MILLION)
TABLE 156
GREATER CHINA: PRESSURE-SENSITIVE ADHESIVE TAPES MARKET, BY TECHNOLOGY, 2025–2030 (USD MILLION)
TABLE 157
GREATER CHINA: PRESSURE-SENSITIVE ADHESIVE TAPES MARKET, BY TECHNOLOGY, 2020–2024 (MILLION SQUARE METER)
TABLE 158
GREATER CHINA: PRESSURE-SENSITIVE ADHESIVE TAPES MARKET, BY TECHNOLOGY, 2025–2030 (MILLION SQUARE METER)
TABLE 159
GREATER CHINA: PRESSURE-SENSITIVE ADHESIVE TAPES MARKET, BY END-USE INDUSTRY, 2020–2024 (USD MILLION)
TABLE 160
GREATER CHINA: PRESSURE-SENSITIVE ADHESIVE TAPES MARKET, BY END-USE INDUSTRY, 2025–2030 (USD MILLION)
TABLE 161
GREATER CHINA: PRESSURE-SENSITIVE ADHESIVE TAPES MARKET, BY END-USE INDUSTRY, 2020–2024 (MILLION SQUARE METER)
TABLE 162
GREATER CHINA: PRESSURE-SENSITIVE ADHESIVE TAPES MARKET, BY END-USE INDUSTRY, 2025–2030 (MILLION SQUARE METER)
TABLE 163
GREATER CHINA: PRESSURE-SENSITIVE ADHESIVE TAPES MARKET, BY COUNTRY, 2020–2024 (USD MILLION)
TABLE 164
GREATER CHINA: PRESSURE-SENSITIVE ADHESIVE TAPES MARKET, BY COUNTRY, 2025–2030 (USD MILLION)
TABLE 165
GRAETER CHINA: PRESSURE-SENSITIVE ADHESIVE TAPES MARKET, BY COUNTRY, 2020–2024 (MILLION SQUARE METER)
TABLE 166
GREATER CHINA: PRESSURE-SENSITIVE ADHESIVE TAPES MARKET, BY COUNTRY, 2025–2030 (MILLION SQUARE METER)
TABLE 167
CHINA: PRESSURE-SENSITIVE ADHESIVE TAPES MARKET, BY ADHESIVE TYPE, 2020–2024 (USD MILLION)
TABLE 168
CHINA: PRESSURE-SENSITIVE ADHESIVE TAPES MARKET, BY ADHESIVE TYPE, 2025–2030 (USD MILLION)
TABLE 169
CHINA: PRESSURE-SENSITIVE ADHESIVE TAPES MARKET, BY ADHESIVE TYPE, 2020–2024 (MILLION SQUARE METER)
TABLE 170
CHINA: PRESSURE-SENSITIVE ADHESIVE TAPES MARKET, BY ADHESIVE TYPE, 2025–2030 (MILLION SQUARE METER)
TABLE 171
TAIWAN: PRESSURE-SENSITIVE ADHESIVE TAPES MARKET, BY ADHESIVE TYPE, 2020–2024 (USD MILLION)
TABLE 172
TAIWAN: PRESSURE-SENSITIVE ADHESIVE TAPES MARKET, BY ADHESIVE TYPE, 2025–2030 (USD MILLION)
TABLE 173
TAIWAN: PRESSURE-SENSITIVE ADHESIVE TAPES MARKET, BY ADHESIVE TYPE, 2020–2024 (MILLION SQUARE METER)
TABLE 174
TAIWAN: PRESSURE-SENSITIVE ADHESIVE TAPES MARKET, BY ADHESIVE TYPE, 2025–2030 (MILLION SQUARE METER)
TABLE 175
HONG KONG: PRESSURE-SENSITIVE ADHESIVE TAPES MARKET, BY ADHESIVE TYPE, 2020–2024 (USD MILLION)
TABLE 176
HONG KONG: PRESSURE-SENSITIVE ADHESIVE TAPES MARKET, BY ADHESIVE TYPE, 2025–2030 (USD MILLION)
TABLE 177
HONG KONG: PRESSURE-SENSITIVE ADHESIVE TAPES MARKET, BY ADHESIVE TYPE, 2020–2024 (MILLION SQUARE METER)
TABLE 178
HONG KONG: PRESSURE-SENSITIVE ADHESIVE TAPES MARKET, BY ADHESIVE TYPE, 2025–2030 (MILLION SQUARE METER)
TABLE 179
ASIA PACIFIC: PRESSURE-SENSITIVE ADHESIVE TAPES MARKET, BY TYPE, 2020–2024 (USD MILLION)
TABLE 180
ASIA PACIFIC: PRESSURE-SENSITIVE ADHESIVE TAPES MARKET, BY TYPE, 2025–2030 (USD MILLION)
TABLE 181
ASIA PACIFIC: PRESSURE-SENSITIVE ADHESIVE TAPES MARKET, BY TYPE, 2020–2024 (MILLION SQUARE METER)
TABLE 182
ASIA PACIFIC: PRESSURE-SENSITIVE ADHESIVE TAPES MARKET, BY TYPE, 2025–2030 (MILLION SQUARE METER)
TABLE 183
ASIA PACIFIC: PRESSURE-SENSITIVE ADHESIVE TAPES MARKET, BY ADHESIVE TYPE, 2020–2024 (USD MILLION)
TABLE 184
ASIA PACIFIC: PRESSURE-SENSITIVE ADHESIVE TAPES MARKET, BY ADHESIVE TYPE, 2025–2030 (USD MILLION)
TABLE 185
ASIA PACIFIC: PRESSURE-SENSITIVE ADHESIVE TAPES MARKET, BY ADHESIVE TYPE, 2020–2024 (MILLION SQUARE METER)
TABLE 186
ASIA PACIFIC: PRESSURE-SENSITIVE ADHESIVE TAPES MARKET, BY ADHESIVE TYPE, 2025–2030 (MILLION SQUARE METER)
TABLE 187
ASIA PACIFIC: PRESSURE-SENSITIVE ADHESIVE TAPES MARKET, BY BACKING MATERIAL, 2020–2024 (USD MILLION)
TABLE 188
ASIA PACIFIC: PRESSURE-SENSITIVE ADHESIVE TAPES MARKET, BY BACKING MATERIAL, 2025–2030 (USD MILLION)
TABLE 189
ASIA PACIFIC: PRESSURE-SENSITIVE ADHESIVE TAPES MARKET, BY BACKING MATERIAL, 2020–2024 (MILLION SQUARE METER)
TABLE 190
ASIA PACIFIC: PRESSURE-SENSITIVE ADHESIVE TAPES MARKET, BY BACKING MATERIAL, 2025–2030 (MILLION SQUARE METER)
TABLE 191
ASIA PACIFIC: PRESSURE-SENSITIVE ADHESIVE TAPES MARKET, BY TECHNOLOGY, 2020–2024 (USD MILLION)
TABLE 192
ASIA PACIFIC: PRESSURE-SENSITIVE ADHESIVE TAPES MARKET, BY TECHNOLOGY, 2025–2030 (USD MILLION)
TABLE 193
ASIA PACIFIC: PRESSURE-SENSITIVE ADHESIVE TAPES MARKET, BY TECHNOLOGY, 2020–2024 (MILLION SQUARE METER)
TABLE 194
ASIA PACIFIC: PRESSURE-SENSITIVE ADHESIVE TAPES MARKET, BY TECHNOLOGY, 2025–2030 (MILLION SQUARE METER)
TABLE 195
ASIA PACIFIC: PRESSURE-SENSITIVE ADHESIVE TAPES MARKET, BY END-USE INDUSTRY, 2020–2024 (USD MILLION)
TABLE 196
ASIA PACIFIC: PRESSURE-SENSITIVE ADHESIVE TAPES MARKET, BY END-USE INDUSTRY, 2025–2030 (USD MILLION)
TABLE 197
ASIA PACIFIC: PRESSURE-SENSITIVE ADHESIVE TAPES MARKET, BY END-USE INDUSTRY, 2020–2024 (MILLION SQUARE METER)
TABLE 198
ASIA PACIFIC: PRESSURE-SENSITIVE ADHESIVE TAPES MARKET, BY END-USE INDUSTRY, 2025–2030 (MILLION SQUARE METER)
TABLE 199
ASIA PACIFIC: PRESSURE-SENSITIVE ADHESIVE TAPES MARKET, BY COUNTRY, 2020–2024 (USD MILLION)
TABLE 200
ASIA PACIFIC: PRESSURE-SENSITIVE ADHESIVE TAPES MARKET, BY COUNTRY, 2025–2030 (USD MILLION)
TABLE 201
ASIA PACIFIC: PRESSURE-SENSITIVE ADHESIVE TAPES MARKET, BY COUNTRY, 2020–2024 (MILLION SQUARE METER)
TABLE 202
ASIA PACIFIC: PRESSURE-SENSITIVE ADHESIVE TAPES MARKET, BY COUNTRY, 2025–2030 (MILLION SQUARE METER)
TABLE 203
JAPAN: PRESSURE-SENSITIVE ADHESIVE TAPES MARKET, BY ADHESIVE TYPE, 2020–2024 (USD MILLION)
TABLE 204
JAPAN: PRESSURE-SENSITIVE ADHESIVE TAPES MARKET, BY ADHESIVE TYPE, 2025–2030 (USD MILLION)
TABLE 205
JAPAN: PRESSURE-SENSITIVE ADHESIVE TAPES MARKET, BY ADHESIVE TYPE, 2020–2024 (MILLION SQUARE METER)
TABLE 206
JAPAN: PRESSURE-SENSITIVE ADHESIVE TAPES MARKET, BY ADHESIVE TYPE, 2025–2030 (MILLION SQUARE METER)
TABLE 207
INDIA: PRESSURE-SENSITIVE ADHESIVE TAPES MARKET, BY ADHESIVE TYPE, 2020–2024 (USD MILLION)
TABLE 208
INDIA: PRESSURE-SENSITIVE ADHESIVE TAPES MARKET, BY ADHESIVE TYPE, 2025–2030 (USD MILLION)
TABLE 209
INDIA: PRESSURE-SENSITIVE ADHESIVE TAPES MARKET, BY ADHESIVE TYPE, 2020–2024 (MILLION SQUARE METER)
TABLE 210
INDIA: PRESSURE-SENSITIVE ADHESIVE TAPES MARKET, BY ADHESIVE TYPE, 2025–2030 (MILLION SQUARE METER)
TABLE 211
SOUTH KOREA: PRESSURE-SENSITIVE ADHESIVE TAPES MARKET, BY ADHESIVE TYPE, 2020–2024 (USD MILLION)
TABLE 212
SOUTH KOREA: PRESSURE-SENSITIVE ADHESIVE TAPES MARKET, BY ADHESIVE TYPE, 2025–2030 (USD MILLION)
TABLE 213
SOUTH KOREA: PRESSURE-SENSITIVE ADHESIVE TAPES MARKET, BY ADHESIVE TYPE, 2020–2024 (MILLION SQUARE METER)
TABLE 214
SOUTH KOREA: PRESSURE-SENSITIVE ADHESIVE TAPES MARKET, BY ADHESIVE TYPE, 2025–2030 (MILLION SQUARE METER)
TABLE 215
ASEAN: PRESSURE-SENSITIVE ADHESIVE TAPES MARKET, BY ADHESIVE TYPE, 2020–2024 (USD MILLION)
TABLE 216
ASEAN: PRESSURE-SENSITIVE ADHESIVE TAPES MARKET, BY ADHESIVE TYPE, 2025–2030 (USD MILLION)
TABLE 217
ASEAN: PRESSURE-SENSITIVE ADHESIVE TAPES MARKET, BY ADHESIVE TYPE, 2020–2024 (MILLION SQUARE METER)
TABLE 218
ASEAN: PRESSURE-SENSITIVE ADHESIVE TAPES MARKET, BY ADHESIVE TYPE, 2025–2030 (MILLION SQUARE METER)
TABLE 219
NORTH AMERICA: PRESSURE-SENSITIVE ADHESIVE TAPES MARKET, BY TYPE, 2020–2024 (USD MILLION)
TABLE 220
NORTH AMERICA: PRESSURE-SENSITIVE ADHESIVE TAPES MARKET, BY TYPE, 2025–2030 (USD MILLION)
TABLE 221
NORTH AMERICA: PRESSURE-SENSITIVE ADHESIVE TAPES MARKET, BY TYPE, 2020–2024 (MILLION SQUARE METER)
TABLE 222
NORTH AMERICA: PRESSURE-SENSITIVE ADHESIVE TAPES MARKET, BY TYPE, 2025–2030 (MILLION SQUARE METER)
TABLE 223
NORTH AMERICA: PRESSURE-SENSITIVE ADHESIVE TAPES MARKET, BY ADHESIVE TYPE, 2020–2024 (USD MILLION)
TABLE 224
NORTH AMERICA: PRESSURE-SENSITIVE ADHESIVE TAPES MARKET, BY ADHESIVE TYPE, 2025–2030 (USD MILLION)
TABLE 225
NORTH AMERICA: PRESSURE-SENSITIVE ADHESIVE TAPES MARKET, BY ADHESIVE TYPE, 2020–2024 (MILLION SQUARE METER)
TABLE 226
NORTH AMERICA: PRESSURE-SENSITIVE ADHESIVE TAPES MARKET, BY ADHESIVE TYPE, 2025–2030 (MILLION SQUARE METER)
TABLE 227
NORTH AMERICA: PRESSURE-SENSITIVE ADHESIVE TAPES MARKET, BY BACKING MATERIAL, 2020–2024 (USD MILLION)
TABLE 228
NORTH AMERICA: PRESSURE-SENSITIVE ADHESIVE TAPES MARKET, BY BACKING MATERIAL, 2025–2030 (USD MILLION)
TABLE 229
NORTH AMERICA: PRESSURE-SENSITIVE ADHESIVE TAPES MARKET, BY BACKING MATERIAL, 2020–2024 (MILLION SQUARE METER)
TABLE 230
NORTH AMERICA: PRESSURE-SENSITIVE ADHESIVE TAPES MARKET, BY BACKING MATERIAL, 2025–2030 (MILLION SQUARE METER)
TABLE 231
NORTH AMERICA: PRESSURE-SENSITIVE ADHESIVE TAPES MARKET, BY TECHNOLOGY, 2020–2024 (USD MILLION)
TABLE 232
NORTH AMERICA: PRESSURE-SENSITIVE ADHESIVE TAPES MARKET, BY TECHNOLOGY, 2025–2030 (USD MILLION)
TABLE 233
NORTH AMERICA: PRESSURE-SENSITIVE ADHESIVE TAPES MARKET, BY TECHNOLOGY, 2020–2024 (MILLION SQUARE METER)
TABLE 234
NORTH AMERICA: PRESSURE-SENSITIVE ADHESIVE TAPES MARKET, BY TECHNOLOGY, 2025–2030 (MILLION SQUARE METER)
TABLE 235
NORTH AMERICA: PRESSURE-SENSITIVE ADHESIVE TAPES MARKET, BY END-USE INDUSTRY, 2020–2024 (USD MILLION)
TABLE 236
NORTH AMERICA: PRESSURE-SENSITIVE ADHESIVE TAPES MARKET, BY END-USE INDUSTRY, 2025–2030 (USD MILLION)
TABLE 237
NORTH AMERICA: PRESSURE-SENSITIVE ADHESIVE TAPES MARKET, BY END-USE INDUSTRY, 2020–2024 (MILLION SQUARE METER)
TABLE 238
NORTH AMERICA: PRESSURE-SENSITIVE ADHESIVE TAPES MARKET, BY END-USE INDUSTRY, 2025–2030 (MILLION SQUARE METER)
TABLE 239
NORTH AMERICA: PRESSURE-SENSITIVE ADHESIVE TAPES MARKET, BY COUNTRY, 2020–2024 (USD MILLION)
TABLE 240
NORTH AMERICA: PRESSURE-SENSITIVE ADHESIVE TAPES MARKET, BY COUNTRY, 2025–2030 (USD MILLION)
TABLE 241
NORTH AMERICA: PRESSURE-SENSITIVE ADHESIVE TAPES MARKET, BY COUNTRY, 2020–2024 (MILLION SQUARE METER)
TABLE 242
NORTH AMERICA: PRESSURE-SENSITIVE ADHESIVE TAPES MARKET, BY COUNTRY, 2025–2030 (MILLION SQUARE METER)
TABLE 243
US: PRESSURE-SENSITIVE ADHESIVE TAPES MARKET, BY ADHESIVE TYPE, 2020–2024 (USD MILLION)
TABLE 244
US: PRESSURE-SENSITIVE ADHESIVE TAPES MARKET, BY ADHESIVE TYPE, 2025–2030 (USD MILLION)
TABLE 245
US: PRESSURE-SENSITIVE ADHESIVE TAPES MARKET, BY ADHESIVE TYPE, 2020–2024 (MILLION SQUARE METER)
TABLE 246
US: PRESSURE-SENSITIVE ADHESIVE TAPES MARKET, BY ADHESIVE TYPE, 2025–2030 (MILLION SQUARE METER)
TABLE 247
CANADA: PRESSURE-SENSITIVE ADHESIVE TAPES MARKET, BY ADHESIVE TYPE, 2020–2024 (USD MILLION)
TABLE 248
CANADA: PRESSURE-SENSITIVE ADHESIVE TAPES MARKET, BY ADHESIVE TYPE, 2025–2030 (USD MILLION)
TABLE 249
CANADA: PRESSURE-SENSITIVE ADHESIVE TAPES MARKET, BY ADHESIVE TYPE, 2020–2024 (MILLION SQUARE METER)
TABLE 250
CANADA: PRESSURE-SENSITIVE ADHESIVE TAPES MARKET, BY ADHESIVE TYPE, 2025–2030 (MILLION SQUARE METER)
TABLE 251
MEXICO: PRESSURE-SENSITIVE ADHESIVE TAPES MARKET, BY ADHESIVE TYPE, 2020–2024 (USD MILLION)
TABLE 252
MEXICO: PRESSURE-SENSITIVE ADHESIVE TAPES MARKET, BY ADHESIVE TYPE, 2025–2030 (USD MILLION)
TABLE 253
MEXICO: PRESSURE-SENSITIVE ADHESIVE TAPES MARKET, BY ADHESIVE TYPE, 2020–2024 (MILLION SQUARE METER)
TABLE 254
MEXICO: PRESSURE-SENSITIVE ADHESIVE TAPES MARKET, BY ADHESIVE TYPE, 2025–2030 (MILLION SQUARE METER)
TABLE 255
EUROPE: PRESSURE-SENSITIVE ADHESIVE TAPES MARKET, BY TYPE, 2020–2024 (USD MILLION)
TABLE 256
EUROPE: PRESSURE-SENSITIVE ADHESIVE TAPES MARKET, BY TYPE, 2025–2030 (USD MILLION)
TABLE 257
EUROPE: PRESSURE-SENSITIVE ADHESIVE TAPES MARKET, BY TYPE, 2020–2024 (MILLION SQUARE METER)
TABLE 258
EUROPE: PRESSURE-SENSITIVE ADHESIVE TAPES MARKET, BY TYPE, 2025–2030 (MILLION SQUARE METER)
TABLE 259
EUROPE: PRESSURE-SENSITIVE ADHESIVE TAPES MARKET, BY ADHESIVE TYPE, 2020–2024 (USD MILLION)
TABLE 260
EUROPE: PRESSURE-SENSITIVE ADHESIVE TAPES MARKET, BY ADHESIVE TYPE, 2025–2030 (USD MILLION)
TABLE 261
EUROPE: PRESSURE-SENSITIVE ADHESIVE TAPES MARKET, BY ADHESIVE TYPE, 2020–2024 (MILLION SQUARE METER)
TABLE 262
EUROPE: PRESSURE-SENSITIVE ADHESIVE TAPES MARKET, BY ADHESIVE TYPE, 2025–2030 (MILLION SQUARE METER)
TABLE 263
EUROPE: PRESSURE-SENSITIVE ADHESIVE TAPES MARKET, BY BACKING MATERIAL, 2020–2024 (USD MILLION)
TABLE 264
EUROPE: PRESSURE-SENSITIVE ADHESIVE TAPES MARKET, BY BACKING MATERIAL, 2025–2030 (USD MILLION)
TABLE 265
EUROPE: PRESSURE-SENSITIVE ADHESIVE TAPES MARKET, BY BACKING MATERIAL, 2020–2024 (MILLION SQUARE METER)
TABLE 266
EUROPE: PRESSURE-SENSITIVE ADHESIVE TAPES MARKET, BY BACKING MATERIAL, 2025–2030 (MILLION SQUARE METER)
TABLE 267
EUROPE: PRESSURE-SENSITIVE ADHESIVE TAPES MARKET, BY TECHNOLOGY, 2020–2024 (USD MILLION)
TABLE 268
EUROPE: PRESSURE-SENSITIVE ADHESIVE TAPES MARKET, BY TECHNOLOGY, 2025–2030 (USD MILLION)
TABLE 269
EUROPE: PRESSURE-SENSITIVE ADHESIVE TAPES MARKET, BY TECHNOLOGY, 2020–2024 (MILLION SQUARE METER)
TABLE 270
EUROPE: PRESSURE-SENSITIVE ADHESIVE TAPES MARKET, BY TECHNOLOGY, 2025–2030 (MILLION SQUARE METER)
TABLE 271
EUROPE: PRESSURE-SENSITIVE ADHESIVE TAPES MARKET, BY END-USE INDUSTRY, 2020–2024 (USD MILLION)
TABLE 272
EUROPE: PRESSURE-SENSITIVE ADHESIVE TAPES MARKET, BY END-USE INDUSTRY, 2025–2030 (USD MILLION)
TABLE 273
EUROPE: PRESSURE-SENSITIVE ADHESIVE TAPES MARKET, BY END-USE INDUSTRY, 2020–2024 (MILLION SQUARE METER)
TABLE 274
EUROPE: PRESSURE-SENSITIVE ADHESIVE TAPES MARKET, BY END-USE INDUSTRY, 2025–2030 (MILLION SQUARE METER)
TABLE 275
EUROPE: PRESSURE-SENSITIVE ADHESIVE TAPES MARKET, BY COUNTRY, 2020–2024 (USD MILLION)
TABLE 276
EUROPE: PRESSURE-SENSITIVE ADHESIVE TAPES MARKET, BY COUNTRY, 2025–2030 (USD MILLION)
TABLE 277
EUROPE: PRESSURE-SENSITIVE ADHESIVE TAPES MARKET, BY COUNTRY, 2020–2024 (MILLION SQUARE METER)
TABLE 278
EUROPE: PRESSURE-SENSITIVE ADHESIVE TAPES MARKET, BY COUNTRY, 2025–2030 (MILLION SQUARE METER)
TABLE 279
GERMANY: PRESSURE-SENSITIVE ADHESIVE TAPES MARKET, BY ADHESIVE TYPE, 2020–2024 (USD MILLION)
TABLE 280
GERMANY: PRESSURE-SENSITIVE ADHESIVE TAPES MARKET, BY ADHESIVE TYPE, 2025–2030 (USD MILLION)
TABLE 281
GERMANY: PRESSURE-SENSITIVE ADHESIVE TAPES MARKET, BY ADHESIVE TYPE, 2020–2024 (MILLION SQUARE METER)
TABLE 282
GERMANY: PRESSURE-SENSITIVE ADHESIVE TAPES MARKET, BY ADHESIVE TYPE, 2025–2030 (MILLION SQUARE METER)
TABLE 283
FRANCE: PRESSURE-SENSITIVE ADHESIVE TAPES MARKET, BY ADHESIVE TYPE, 2020–2024 (USD MILLION)
TABLE 284
FRANCE: PRESSURE-SENSITIVE ADHESIVE TAPES MARKET, BY ADHESIVE TYPE, 2025–2030 (USD MILLION)
TABLE 285
FRANCE: PRESSURE-SENSITIVE ADHESIVE TAPES MARKET, BY ADHESIVE TYPE, 2020–2024 (MILLION SQUARE METER)
TABLE 286
FRANCE: PRESSURE-SENSITIVE ADHESIVE TAPES MARKET, BY ADHESIVE TYPE, 2025–2030 (MILLION SQUARE METER)
TABLE 287
UK: PRESSURE-SENSITIVE ADHESIVE TAPES MARKET, BY ADHESIVE TYPE, 2020–2024 (USD MILLION)
TABLE 288
UK: PRESSURE-SENSITIVE ADHESIVE TAPES MARKET, BY ADHESIVE TYPE, 2025–2030 (USD MILLION)
TABLE 289
UK: PRESSURE-SENSITIVE ADHESIVE TAPES MARKET, BY ADHESIVE TYPE, 2020–2024 (MILLION SQUARE METER)
TABLE 290
UK: PRESSURE-SENSITIVE ADHESIVE TAPES MARKET, BY ADHESIVE TYPE, 2025–2030 (MILLION SQUARE METER)
TABLE 291
SPAIN: PRESSURE-SENSITIVE ADHESIVE TAPES MARKET, BY ADHESIVE TYPE, 2020–2024 (USD MILLION)
TABLE 292
SPAIN: PRESSURE-SENSITIVE ADHESIVE TAPES MARKET, BY ADHESIVE TYPE, 2025–2030 (USD MILLION)
TABLE 293
SPAIN: PRESSURE-SENSITIVE ADHESIVE TAPES MARKET, BY ADHESIVE TYPE, 2020–2024 (MILLION SQUARE METER)
TABLE 294
SPAIN: PRESSURE-SENSITIVE ADHESIVE TAPES MARKET, BY ADHESIVE TYPE, 2025–2030 (MILLION SQUARE METER)
TABLE 295
NETHERLANDS: PRESSURE-SENSITIVE ADHESIVE TAPES MARKET, BY ADHESIVE TYPE, 2020–2024 (USD MILLION)
TABLE 296
NETHERLANDS: PRESSURE-SENSITIVE ADHESIVE TAPES MARKET, BY ADHESIVE TYPE, 2025–2030 (USD MILLION)
TABLE 297
NETHERLANDS: PRESSURE-SENSITIVE ADHESIVE TAPES MARKET, BY ADHESIVE TYPE, 2020–2024 (MILLION SQUARE METER)
TABLE 298
NETHERLANDS: PRESSURE-SENSITIVE ADHESIVE TAPES MARKET, BY ADHESIVE TYPE, 2025–2030 (MILLION SQUARE METER)
TABLE 299
POLAND: PRESSURE-SENSITIVE ADHESIVE TAPES MARKET, BY ADHESIVE TYPE, 2020–2024 (USD MILLION)
TABLE 300
POLAND: PRESSURE-SENSITIVE ADHESIVE TAPES MARKET, BY ADHESIVE TYPE, 2025–2030 (USD MILLION)
TABLE 301
POLAND: PRESSURE-SENSITIVE ADHESIVE TAPES MARKET, BY ADHESIVE TYPE, 2020–2024 (MILLION SQUARE METER)
TABLE 302
POLAND: PRESSURE-SENSITIVE ADHESIVE TAPES MARKET, BY ADHESIVE TYPE, 2025–2030 (MILLION SQUARE METER)
TABLE 303
MIDDLE EAST & AFRICA: PRESSURE-SENSITIVE ADHESIVE TAPES MARKET, BY TYPE, 2020–2024 (USD MILLION)
TABLE 304
MIDDLE EAST & AFRICA: PRESSURE-SENSITIVE ADHESIVE TAPES MARKET, BY TYPE, 2025–2030 (USD MILLION)
TABLE 305
MIDDLE EAST & AFRICA: PRESSURE-SENSITIVE ADHESIVE TAPES MARKET, BY TYPE, 2020–2024 (MILLION SQUARE METER)
TABLE 306
MIDDLE EAST & AFRICA: PRESSURE-SENSITIVE ADHESIVE TAPES MARKET, BY TYPE, 2025–2030 (MILLION SQUARE METER)
TABLE 307
MIDDLE EAST & AFRICA: PRESSURE-SENSITIVE ADHESIVE TAPES MARKET, BY ADHESIVE TYPE, 2020–2024 (USD MILLION)
TABLE 308
MIDDLE EAST & AFRICA: PRESSURE-SENSITIVE ADHESIVE TAPES MARKET, BY ADHESIVE TYPE, 2025–2030 (USD MILLION)
TABLE 309
MIDDLE EAST & AFRICA: PRESSURE-SENSITIVE ADHESIVE TAPES MARKET, BY ADHESIVE TYPE, 2020–2024 (MILLION SQUARE METER)
TABLE 310
MIDDLE EAST & AFRICA: PRESSURE-SENSITIVE ADHESIVE TAPES MARKET, BY ADHESIVE TYPE, 2025–2030 (MILLION SQUARE METER)
TABLE 311
MIDDLE EAST & AFRICA: PRESSURE-SENSITIVE ADHESIVE TAPES MARKET, BY BACKING MATERIAL, 2020–2024 (USD MILLION)
TABLE 312
MIDDLE EAST & AFRICA: PRESSURE-SENSITIVE ADHESIVE TAPES MARKET, BY BACKING MATERIAL, 2025–2030 (USD MILLION)
TABLE 313
MIDDLE EAST & AFRICA: PRESSURE-SENSITIVE ADHESIVE TAPES MARKET, BY BACKING MATERIAL, 2020–2024 (MILLION SQUARE METER)
TABLE 314
MIDDLE EAST & AFRICA: PRESSURE-SENSITIVE ADHESIVE TAPES MARKET, BY BACKING MATERIAL, 2025–2030 (MILLION SQUARE METER)
TABLE 315
MIDDLE EAST & AFRICA: PRESSURE-SENSITIVE ADHESIVE TAPES MARKET, BY TECHNOLOGY, 2020–2024 (USD MILLION)
TABLE 316
MIDDLE EAST & AFRICA: PRESSURE-SENSITIVE ADHESIVE TAPES MARKET, BY TECHNOLOGY, 2025–2030 (USD MILLION)
TABLE 317
MIDDLE EAST & AFRICA: PRESSURE-SENSITIVE ADHESIVE TAPES MARKET, BY TECHNOLOGY, 2020–2024 (MILLION SQUARE METER)
TABLE 318
MIDDLE EAST & AFRICA: PRESSURE-SENSITIVE ADHESIVE TAPES MARKET, BY TECHNOLOGY, 2025–2030 (MILLION SQUARE METER)
TABLE 319
MIDDLE EAST & AFRICA: PRESSURE-SENSITIVE ADHESIVE TAPES MARKET, BY END-USE INDUSTRY, 2020–2024 (USD MILLION)
TABLE 320
MIDDLE EAST & AFRICA: PRESSURE-SENSITIVE ADHESIVE TAPES MARKET, BY END-USE INDUSTRY, 2025–2030 (USD MILLION)
TABLE 321
MIDDLE EAST & AFRICA: PRESSURE-SENSITIVE ADHESIVE TAPES MARKET, BY END-USE INDUSTRY, 2020–2024 (MILLION SQUARE METER)
TABLE 322
MIDDLE EAST & AFRICA: PRESSURE-SENSITIVE ADHESIVE TAPES MARKET, BY END-USE INDUSTRY, 2025–2030 (MILLION SQUARE METER)
TABLE 323
MIDDLE EAST & AFRICA: PRESSURE-SENSITIVE ADHESIVE TAPES MARKET, BY COUNTRY, 2020–2024 (USD MILLION)
TABLE 324
MIDDLE EAST & AFRICA: PRESSURE-SENSITIVE ADHESIVE TAPES MARKET, BY COUNTRY, 2025–2030 (USD MILLION)
TABLE 325
MIDDLE EAST & AFRICA: PRESSURE-SENSITIVE ADHESIVE TAPES MARKET, BY COUNTRY, 2020–2024 (MILLION SQUARE METER)
TABLE 326
MIDDLE EAST & AFRICA: PRESSURE-SENSITIVE ADHESIVE TAPES MARKET, BY COUNTRY, 2025–2030 (MILLION SQUARE METER)
TABLE 327
SAUDI ARABIA: PRESSURE-SENSITIVE ADHESIVE TAPES MARKET, BY ADHESIVE TYPE, 2020–2024 (USD MILLION)
TABLE 328
SAUDI ARABIA: PRESSURE-SENSITIVE ADHESIVE TAPES MARKET, BY ADHESIVE TYPE, 2025–2030 (USD MILLION)
TABLE 329
SAUDI ARABIA: PRESSURE-SENSITIVE ADHESIVE TAPES MARKET, BY ADHESIVE TYPE, 2020–2024 (MILLION SQUARE METER)
TABLE 330
SAUDI ARABIA: PRESSURE-SENSITIVE ADHESIVE TAPES MARKET, BY ADHESIVE TYPE, 2025–2030 (MILLION SQUARE METER)
TABLE 331
UAE: PRESSURE-SENSITIVE ADHESIVE TAPES MARKET, BY ADHESIVE TYPE, 2020–2024 (USD MILLION)
TABLE 332
UAE: PRESSURE-SENSITIVE ADHESIVE TAPES MARKET, BY ADHESIVE TYPE, 2025–2030 (USD MILLION)
TABLE 333
UAE: PRESSURE-SENSITIVE ADHESIVE TAPES MARKET, BY ADHESIVE TYPE, 2020–2024 (MILLION SQUARE METER)
TABLE 334
UAE: PRESSURE-SENSITIVE ADHESIVE TAPES MARKET, BY ADHESIVE TYPE, 2025–2030 (MILLION SQUARE METER)
TABLE 335
TURKEY: PRESSURE-SENSITIVE ADHESIVE TAPES MARKET, BY ADHESIVE TYPE, 2020–2024 (USD MILLION)
TABLE 336
TURKEY: PRESSURE-SENSITIVE ADHESIVE TAPES MARKET, BY ADHESIVE TYPE, 2025–2030 (USD MILLION)
TABLE 337
TURKEY: PRESSURE-SENSITIVE ADHESIVE TAPES MARKET, BY ADHESIVE TYPE, 2020–2024 (MILLION SQUARE METER)
TABLE 338
TURKEY: PRESSURE-SENSITIVE ADHESIVE TAPES MARKET, BY ADHESIVE TYPE, 2025–2030 (MILLION SQUARE METER)
TABLE 339
SOUTH AFRICA: PRESSURE-SENSITIVE ADHESIVE TAPES MARKET, BY ADHESIVE TYPE, 2020–2024 (USD MILLION)
TABLE 340
SOUTH AFRICA: PRESSURE-SENSITIVE ADHESIVE TAPES MARKET, BY ADHESIVE TYPE, 2025–2030 (USD MILLION)
TABLE 341
SOUTH AFRICA: PRESSURE-SENSITIVE ADHESIVE TAPES MARKET, BY ADHESIVE TYPE, 2020–2024 (MILLION SQUARE METER)
TABLE 342
SOUTH AFRICA: PRESSURE-SENSITIVE ADHESIVE TAPES MARKET, BY ADHESIVE TYPE, 2025–2030 (MILLION SQUARE METER)
TABLE 343
SOUTH AMERICA: PRESSURE-SENSITIVE ADHESIVE TAPES MARKET, BY TYPE, 2020–2024 (USD MILLION)
TABLE 344
SOUTH AMERICA: PRESSURE-SENSITIVE ADHESIVE TAPES MARKET, BY TYPE, 2025–2030 (USD MILLION)
TABLE 345
SOUTH AMERICA: PRESSURE-SENSITIVE ADHESIVE TAPES MARKET, BY TYPE, 2020–2024 (MILLION SQUARE METER)
TABLE 346
SOUTH AMERICA: PRESSURE-SENSITIVE ADHESIVE TAPES MARKET, BY TYPE, 2025–2030 (MILLION SQUARE METER)
TABLE 347
SOUTH AMERICA: PRESSURE-SENSITIVE ADHESIVE TAPES MARKET, BY ADHESIVE TYPE, 2020–2024 (USD MILLION)
TABLE 348
SOUTH AMERICA: PRESSURE-SENSITIVE ADHESIVE TAPES MARKET, BY ADHESIVE TYPE, 2025–2030 (USD MILLION)
TABLE 349
SOUTH AMERICA: PRESSURE-SENSITIVE ADHESIVE TAPES MARKET, BY ADHESIVE TYPE, 2020–2024 (MILLION SQUARE METER)
TABLE 350
SOUTH AMERICA: PRESSURE-SENSITIVE ADHESIVE TAPES MARKET, BY ADHESIVE TYPE, 2025–2030 (MILLION SQUARE METER)
TABLE 351
SOUTH AMERICA: PRESSURE-SENSITIVE ADHESIVE TAPES MARKET, BY BACKING MATERIAL, 2020–2024 (USD MILLION)
TABLE 352
SOUTH AMERICA: PRESSURE-SENSITIVE ADHESIVE TAPES MARKET, BY BACKING MATERIAL, 2025–2030 (USD MILLION)
TABLE 353
SOUTH AMERICA: PRESSURE-SENSITIVE ADHESIVE TAPES MARKET, BY BACKING MATERIAL, 2020–2024 (MILLION SQUARE METER)
TABLE 354
SOUTH AMERICA: PRESSURE-SENSITIVE ADHESIVE TAPES MARKET, BY BACKING MATERIAL, 2025–2030 (MILLION SQUARE METER)
TABLE 355
SOUTH AMERICA: PRESSURE-SENSITIVE ADHESIVE TAPES MARKET, BY TECHNOLOGY, 2020–2024 (USD MILLION)
TABLE 356
SOUTH AMERICA: PRESSURE-SENSITIVE ADHESIVE TAPES MARKET, BY TECHNOLOGY, 2025–2030 (USD MILLION)
TABLE 357
SOUTH AMERICA: PRESSURE-SENSITIVE ADHESIVE TAPES MARKET, BY TECHNOLOGY, 2020–2024 (MILLION SQUARE METER)
TABLE 358
SOUTH AMERICA: PRESSURE-SENSITIVE ADHESIVE TAPES MARKET, BY TECHNOLOGY, 2025–2030 (MILLION SQUARE METER)
TABLE 359
SOUTH AMERICA: PRESSURE-SENSITIVE ADHESIVE TAPES MARKET, BY END-USE INDUSTRY, 2020–2024 (USD MILLION)
TABLE 360
SOUTH AMERICA: PRESSURE-SENSITIVE ADHESIVE TAPES MARKET, BY END-USE INDUSTRY, 2025–2030 (USD MILLION)
TABLE 361
SOUTH AMERICA: PRESSURE-SENSITIVE ADHESIVE TAPES MARKET, BY END-USE INDUSTRY, 2020–2024 (MILLION SQUARE METER)
TABLE 362
SOUTH AMERICA: PRESSURE-SENSITIVE ADHESIVE TAPES MARKET, BY END-USE INDUSTRY, 2025–2030 (MILLION SQUARE METER)
TABLE 363
SOUTH AMERICA: PRESSURE-SENSITIVE ADHESIVE TAPES MARKET, BY COUNTRY, 2020–2024 (USD MILLION)
TABLE 364
SOUTH AMERICA: PRESSURE-SENSITIVE ADHESIVE TAPES MARKET, BY COUNTRY, 2025–2030 (USD MILLION)
TABLE 365
SOUTH AMERICA: PRESSURE-SENSITIVE ADHESIVE TAPES MARKET, BY COUNTRY, 2020–2024 (MILLION SQUARE METER)
TABLE 366
SOUTH AMERICA: PRESSURE-SENSITIVE ADHESIVE TAPES MARKET, BY COUNTRY, 2025–2030 (MILLION SQUARE METER)
TABLE 367
BRAZIL: PRESSURE-SENSITIVE ADHESIVE TAPES MARKET, BY ADHESIVE TYPE, 2020–2024 (USD MILLION)
TABLE 368
BRAZIL: PRESSURE-SENSITIVE ADHESIVE TAPES MARKET, BY ADHESIVE TYPE, 2025–2030 (USD MILLION)
TABLE 369
BRAZIL: PRESSURE-SENSITIVE ADHESIVE TAPES MARKET, BY ADHESIVE TYPE, 2020–2024 (MILLION SQUARE METER)
TABLE 370
BRAZIL: PRESSURE-SENSITIVE ADHESIVE TAPES MARKET, BY ADHESIVE TYPE, 2025–2030 (MILLION SQUARE METER)
TABLE 371
ARGENTINA: PRESSURE-SENSITIVE ADHESIVE TAPES MARKET, BY ADHESIVE TYPE, 2020–2024 (USD MILLION)
TABLE 372
ARGENTINA: PRESSURE-SENSITIVE ADHESIVE TAPES MARKET, BY ADHESIVE TYPE, 2025–2030 (USD MILLION)
TABLE 373
ARGENTINA: PRESSURE-SENSITIVE ADHESIVE TAPES MARKET, BY ADHESIVE TYPE, 2020–2024 (MILLION SQUARE METER)
TABLE 374
ARGENTINA: PRESSURE-SENSITIVE ADHESIVE TAPES MARKET, BY ADHESIVE TYPE, 2025–2030 (MILLION SQUARE METER)
TABLE 375
CHILE: PRESSURE-SENSITIVE ADHESIVE TAPES MARKET, BY ADHESIVE TYPE, 2020–2024 (USD MILLION)
TABLE 376
CHILE: PRESSURE-SENSITIVE ADHESIVE TAPES MARKET, BY ADHESIVE TYPE, 2025–2030 (USD MILLION)
TABLE 377
CHILE: PRESSURE-SENSITIVE ADHESIVE TAPES MARKET, BY ADHESIVE TYPE, 2020–2024 (MILLION SQUARE METER)
TABLE 378
CHILE: PRESSURE-SENSITIVE ADHESIVE TAPES MARKET, BY ADHESIVE TYPE, 2025–2030 (MILLION SQUARE METER)
TABLE 379
STRATEGIES ADOPTED BY KEY PRESSURE-SENSITIVE ADHESIVE TAPE MANUFACTURERS, JANUARY 2020–JUNE 2025
TABLE 380
PRESSURE-SENSITIVE ADHESIVE TAPES MARKET: DEGREE OF COMPETITION
TABLE 381
PRESSURE-SENSITIVE ADHESIVE TAPES MARKET: REGION FOOTPRINT
TABLE 382
PRESSURE-SENSITIVE ADHESIVE TAPES MARKET: TYPE FOOTPRINT
TABLE 383
PRESSURE-SENSITIVE ADHESIVE TAPES MARKET: ADHESIVE TYPE FOOTPRINT
TABLE 384
PRESSURE-SENSITIVE ADHESIVE TAPES MARKET: BACKING MATERIAL FOOTPRINT
TABLE 385
PRESSURE-SENSITIVE ADHESIVE TAPES MARKET: TECHNOLOGY FOOTPRINT
TABLE 386
PRESSURE-SENSITIVE ADHESIVE TAPES MARKET: END-USE INDUSTRY FOOTPRINT
TABLE 387
PRESSURE-SENSITIVE ADHESIVE TAPES MARKET: KEY STARTUPS/SMES
TABLE 388
PRESSURE-SENSITIVE ADHESIVE TAPES MARKET: COMPETITIVE BENCHMARKING OF KEY STARTUPS/SMES
TABLE 389
PRESSURE-SENSITIVE ADHESIVE TAPES MARKET: PRODUCT LAUNCHES, JANUARY 2020–JUNE 2025
TABLE 390
PRESSURE-SENSITIVE ADHESIVE TAPES MARKET: DEALS, JANUARY 2020–JUNE 2025
TABLE 391
PRESSURE-SENSITIVE ADHESIVE TAPES MARKET: EXPANSIONS, JANUARY 2020–JUNE 2025
TABLE 392
3M COMPANY: COMPANY OVERVIEW
TABLE 393
3M COMPANY: PRODUCTS/SOLUTIONS/SERVICES OFFERED
TABLE 394
3M COMPANY: PRODUCT LAUNCHES
TABLE 395
3M COMPANY: DEALS
TABLE 396
TESA SE: COMPANY OVERVIEW
TABLE 397
TESA SE: PRODUCTS/SOLUTIONS/SERVICES OFFERED
TABLE 398
TESA SE: PRODUCT LAUNCHES
TABLE 399
TESA SE: EXPANSIONS
TABLE 400
NITTO DENKO CORPORATION: COMPANY OVERVIEW
TABLE 401
NITTO DENKO CORPORATION: PRODUCTS/SOLUTIONS/SERVICES OFFERED
TABLE 402
NITTO DENKO CORPORATION: DEALS
TABLE 403
NITTO DENKO CORPORATION: EXPANSIONS
TABLE 404
LINTEC CORPORATION: COMPANY OVERVIEW
TABLE 405
LINTEC CORPORATION: PRODUCTS/SOLUTIONS/SERVICES OFFERED
TABLE 406
INTERTAPE POLYMER GROUP INC.: COMPANY OVERVIEW
TABLE 407
INTERTAPE POLYMER GROUP INC.: PRODUCTS/SOLUTIONS/SERVICES OFFERED
TABLE 408
INTERTAPE POLYMER GROUP INC.: PRODUCT LAUNCHES
TABLE 409
INTERTAPE POLYMER GROUP INC.: EXPANSIONS
TABLE 410
AVERY DENNISON CORPORATION: COMPANY OVERVIEW
TABLE 411
AVERY DENNISON CORPORATION: PRODUCTS/SOLUTIONS/SERVICES OFFERED
TABLE 412
AVERY DENNISON CORPORATION: DEALS
TABLE 413
LOHMANN GMBH & CO. KG: COMPANY OVERVIEW
TABLE 414
LOHMANN GMBH & CO. KG: PRODUCTS/SOLUTIONS/SERVICES OFFERED
TABLE 415
BERRY GLOBAL GROUP, INC.: COMPANY OVERVIEW
TABLE 416
BERRY GLOBAL GROUP, INC.: PRODUCTS/SOLUTIONS/SERVICES OFFERED
TABLE 417
SCAPA GROUP PLC: COMPANY OVERVIEW
TABLE 418
SCAPA GROUP PLC: PRODUCTS/SOLUTIONS/SERVICES OFFERED
TABLE 419
SAINT-GOBAIN S.A.: COMPANY OVERVIEW
TABLE 420
SAINT-GOBAIN S.A.: PRODUCTS/SOLUTIONS/SERVICES OFFERED
TABLE 421
NICHIBAN CO., LTD.: COMPANY OVERVIEW
TABLE 422
SHURTAPE TECHNOLOGIES, LLC: COMPANY OVERVIEW
TABLE 423
ROGERS CORPORATION: COMPANY OVERVIEW
TABLE 424
GERGONNE INDUSTRIE: COMPANY OVERVIEW
TABLE 425
ORAFOL EUROPE GMBH: COMPANY OVERVIEW
TABLE 426
PPI ADHESIVE PRODUCTS (C.E.) S.R.O.: COMPANY OVERVIEW
TABLE 427
AMERICAN BILTRITE INC.: COMPANY OVERVIEW
TABLE 428
TERAOKA SEISAKUSHO CO., LTD.: COMPANY OVERVIEW
TABLE 429
ADVANCE TAPES INTERNATIONAL: COMPANY OVERVIEW
TABLE 430
CCT TAPES: COMPANY OVERVIEW
TABLE 431
BOLEX (SHENZHEN) ADHESIVE PRODUCTS CO., LTD.: COMPANY OVERVIEW
TABLE 432
AJIT INDUSTRIES: COMPANY OVERVIEW
TABLE 433
SUN CHEMICAL (DIC CORPORATION): COMPANY OVERVIEW
TABLE 434
PPM INDUSTRIES SPA: COMPANY OVERVIEW
TABLE 435
LOUIS TAPE: COMPANY OVERVIEW
TABLE 436
EUROPE: ADHESIVE TAPES MARKET, BY COUNTRY, 2020–2024 (MILLION SQUARE METER)
TABLE 437
EUROPE: ADHESIVE TAPES MARKET, BY COUNTRY, 2025–2030 (MILLION SQUARE METER)
TABLE 438
EUROPE: ADHESIVE TAPES MARKET, BY COUNTRY, 2020–2024 (USD MILLION)
TABLE 439
EUROPE: ADHESIVE TAPES MARKET, BY COUNTRY, 2025–2030 (USD MILLION)
TABLE 440
NORTH AMERICA: ADHESIVE TAPES MARKET, BY COUNTRY, 2020–2024 (MILLION SQUARE METER)
TABLE 441
NORTH AMERICA: ADHESIVE TAPES MARKET, BY COUNTRY, 2025–2030 (MILLION SQUARE METER)
TABLE 442
NORTH AMERICA: ADHESIVE TAPES MARKET, BY COUNTRY, 2020–2024 (USD MILLION)
TABLE 443
NORTH AMERICA: ADHESIVE TAPES MARKET, BY COUNTRY, 2025–2030 (USD MILLION)
TABLE 444
ASIA PACIFIC: ADHESIVE TAPES MARKET, BY COUNTRY, 2020–2024 (MILLION SQUARE METER)
TABLE 445
ASIA PACIFIC: ADHESIVE TAPES MARKET, BY COUNTRY, 2025–2030 (MILLION SQUARE METER)
TABLE 446
ASIA PACIFIC: ADHESIVE TAPES MARKET, BY COUNTRY, 2020–2024 (USD MILLION)
TABLE 447
ASIA PACIFIC: ADHESIVE TAPES MARKET, BY COUNTRY, 2025–2030 (USD MILLION)
TABLE 448
MIDDLE EAST & AFRICA: ADHESIVE TAPES MARKET, BY COUNTRY, 2020–2024 (MILLION SQUARE METER)
TABLE 449
MIDDLE EAST & AFRICA: ADHESIVE TAPES MARKET, BY COUNTRY, 2025–2030 (MILLION SQUARE METER)
TABLE 450
MIDDLE EAST & AFRICA: ADHESIVE TAPES MARKET, BY COUNTRY, 2020–2024 (USD MILLION)
TABLE 451
MIDDLE EAST & AFRICA: ADHESIVE TAPES MARKET, BY COUNTRY, 2025–2030 (USD MILLION)
TABLE 452
SOUTH AMERICA: ADHESIVE TAPES MARKET, BY COUNTRY, 2020–2024 (MILLION SQUARE METER)
TABLE 453
SOUTH AMERICA: ADHESIVE TAPES MARKET, BY COUNTRY, 2025–2030 (MILLION SQUARE METER)
TABLE 454
SOUTH AMERICA: ADHESIVE TAPES MARKET, BY COUNTRY, 2020–2024 (USD MILLION)
TABLE 455
SOUTH AMERICA: ADHESIVE TAPES MARKET, BY COUNTRY, 2025–2030 (USD MILLION)
FIGURE 1
PRESSURE-SENSITIVE ADHESIVE TAPES MARKET SEGMENTATION AND REGIONAL SCOPE
FIGURE 2
PRESSURE-SENSITIVE ADHESIVE TAPES MARKET: RESEARCH DESIGN
FIGURE 3
MARKET SIZE ESTIMATION METHODOLOGY: APPROACH 1 (SUPPLY SIDE): COLLECTIVE MARKET SHARE OF KEY PLAYERS
FIGURE 4
MARKET SIZE ESTIMATION METHODOLOGY: APPROACH 2 - BOTTOM-UP (SUPPLY SIDE): COLLECTIVE REVENUE OF ALL PRODUCTS
FIGURE 5
MARKET SIZE ESTIMATION METHODOLOGY: APPROACH 3 – BOTTOM-UP (DEMAND SIDE)
FIGURE 6
MARKET SIZE ESTIMATION METHODOLOGY: APPROACH 4 - TOP-DOWN
FIGURE 7
PRESSURE-SENSITIVE ADHESIVE TAPES MARKET: DATA TRIANGULATION
FIGURE 8
MARKET CAGR PROJECTIONS FROM SUPPLY SIDE
FIGURE 9
MARKET GROWTH PROJECTIONS FROM DEMAND-SIDE DRIVERS AND OPPORTUNITIES
FIGURE 10
SINGLE-SIDED TAPES SEGMENT ACCOUNTED FOR LARGEST MARKET SHARE IN 2024
FIGURE 11
ACRYLIC SEGMENT TO DOMINATE MARKET IN 2025
FIGURE 12
SOLVENT-BASED TECHNOLOGY SEGMENT TO DOMINATE MARKET DURING FORECAST PERIOD
FIGURE 13
PAPER BACKING MATERIAL SEGMENT TO LEAD DURING FORECAST PERIOD
FIGURE 14
MEDICAL & HYGIENE SEGMENT TO DOMINATE MARKET DURING FORECAST PERIOD
FIGURE 15
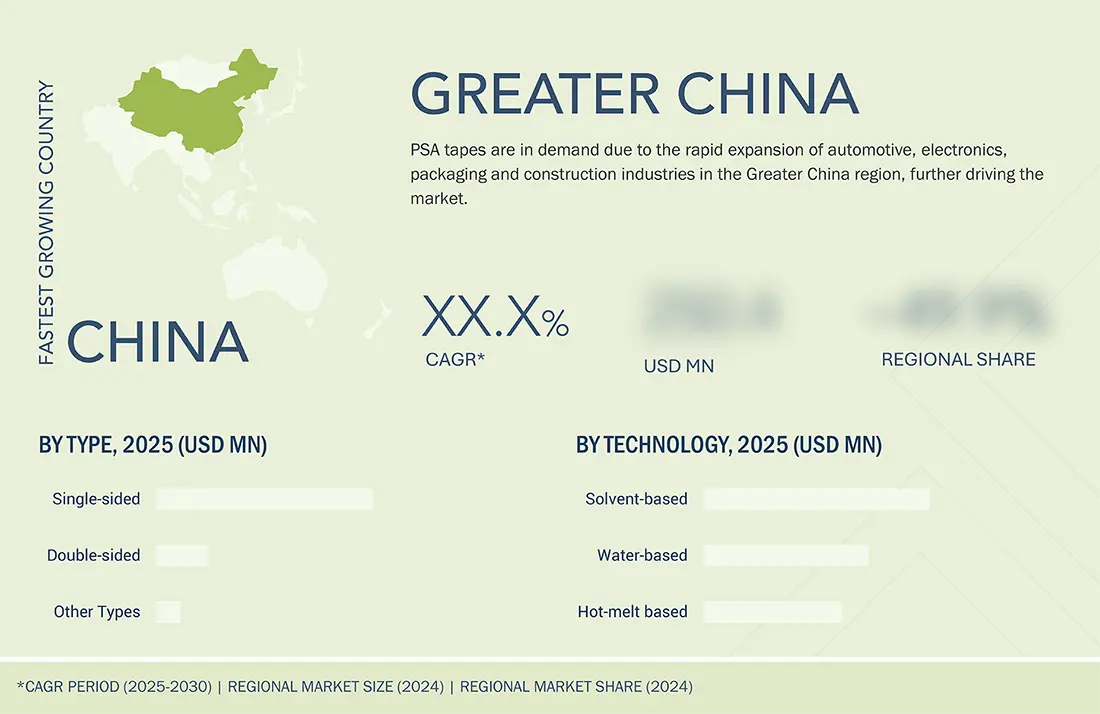
GREATER CHINA ACCOUNTED FOR LARGEST SHARE OF PRESSURE-SENSITIVE ADHESIVE TAPES MARKET IN 2024
FIGURE 16
RAPID URBANIZATION TO CREATE LUCRATIVE OPPORTUNITIES FOR MARKET PLAYERS
FIGURE 17
GREATER CHINA TO BE LARGEST MARKET DURING FORECAST PERIOD
FIGURE 18
PACKAGING SEGMENT ACCOUNTED FOR LARGEST SHARE OF GREATER CHINA PRESSURE-SENSITIVE ADHESIVE TAPES MARKET IN 2024
FIGURE 19
SINGLE-SIDED TAPES SEGMENT DOMINATED MARKET ACROSS ALL REGIONS IN 2024
FIGURE 20
INDIA TO REGISTER HIGHEST GROWTH DURING FORECAST PERIOD
FIGURE 21
PRESSURE-SENSITIVE ADHESIVE TAPES MARKET: DRIVERS, RESTRAINTS, OPPORTUNITIES, AND CHALLENGES
FIGURE 22
PRESSURE-SENSITIVE ADHESIVE TAPES MARKET: PORTER'S FIVE FORCES ANALYSIS
FIGURE 23
INFLUENCE OF STAKEHOLDERS ON BUYING PROCESS FOR TOP THREE END-USE INDUSTRIES
FIGURE 24
KEY BUYING CRITERIA FOR TOP THREE END-USE INDUSTRIES
FIGURE 25
PRESSURE-SENSITIVE ADHESIVE TAPES MARKET: SUPPLY CHAIN ANALYSIS
FIGURE 26
AVERAGE SELLING PRICE OF PRESSURE-SENSITIVE ADHESIVE TAPES OFFERED BY KEY PLAYERS FOR TOP THREE ADHESIVE TYPES, 2024
FIGURE 27
AVERAGE SELLING PRICE TREND OF PRESSURE-SENSITIVE ADHESIVE TAPES, BY REGION, 2022–2030
FIGURE 28
TRENDS/DISRUPTIONS IMPACTING CUSTOMER BUSINESS
FIGURE 29
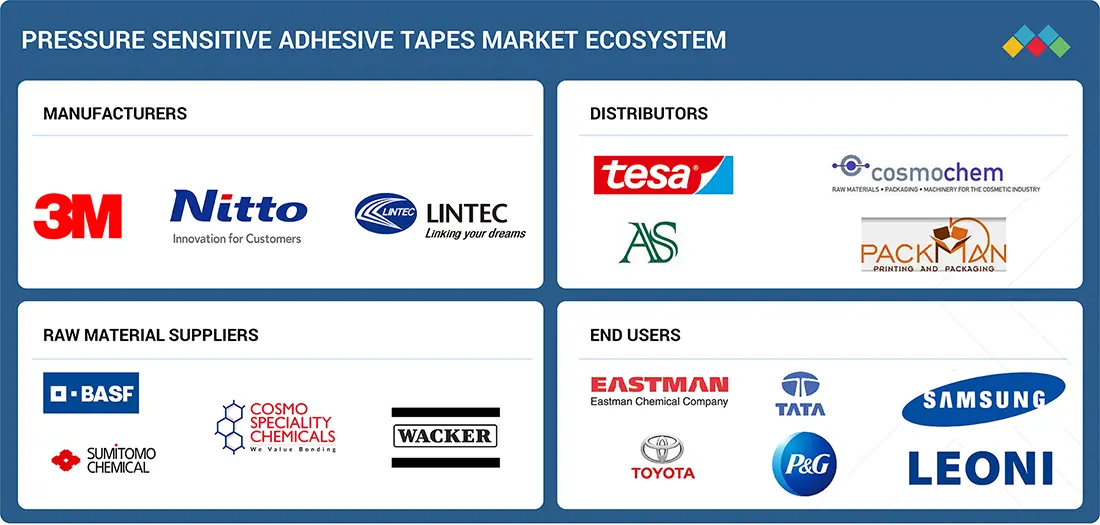
PRESSURE-SENSITIVE ADHESIVE TAPES MARKET: ECOSYSTEM ANALYSIS
FIGURE 30
IMPORT DATA FOR PRESSURE-SENSITIVE ADHESIVE TAPES, BY KEY COUNTRY, 2019–2024 (USD MILLION)
FIGURE 31
EXPORT DATA FOR PRESSURE-SENSITIVE ADHESIVE TAPES, BY KEY COUNTRY, 2019–2024 (USD MILLION)
FIGURE 32
PATENTS REGISTERED FOR PRESSURE-SENSITIVE ADHESIVE TAPES, 2014–2024
FIGURE 33
MAJOR PATENTS RELATED TO PRESSURE-SENSITIVE ADHESIVE TAPES, 2014–2024
FIGURE 34
LEGAL STATUS OF PATENTS FILED RELATED TO PRESSURE-SENSITIVE ADHESIVE TAPES, 2014–2024
FIGURE 35
MAXIMUM PATENTS FILED IN JURISDICTION OF US, 2014–2024
FIGURE 36
IMPACT OF AI/GEN AI ON PRESSURE-SENSITIVE ADHESIVE TAPES MARKET
FIGURE 37
SINGLE-SIDED TAPES SEGMENT TO LEAD MARKET DURING FORECAST PERIOD
FIGURE 38
ACRYLIC SEGMENT TO LEAD MARKET DURING FORECAST PERIOD
FIGURE 39
PAPER SEGMENT TO LEAD MARKET DURING FORECAST PERIOD
FIGURE 40
SOLVENT-BASED TECHNOLOGY TO LEAD MARKET DURING FORECAST PERIOD
FIGURE 41
MEDICAL & HYGIENE SEGMENT TO LEAD MARKET DURING FORECAST PERIOD
FIGURE 42
ASIA PACIFIC TO REGISTER HIGHEST GROWTH BETWEEN 2025 AND 2030
FIGURE 43
ASIA PACIFIC: PRESSURE-SENSITIVE ADHESIVE TAPES MARKET SNAPSHOT
FIGURE 44
NORTH AMERICA: PRESSURE-SENSITIVE ADHESIVE TAPES MARKET SNAPSHOT
FIGURE 45
EUROPE: PRESSURE-SENSITIVE ADHESIVE TAPES MARKET SNAPSHOT
FIGURE 46
PRESSURE-SENSITIVE ADHESIVE TAPES MARKET SHARE ANALYSIS, 2024
FIGURE 47
PRESSURE-SENSITIVE ADHESIVE TAPES MARKET: REVENUE ANALYSIS OF TOP FIVE PLAYERS, 2020–2024 (USD MILLION)
FIGURE 48
PRESSURE-SENSITIVE ADHESIVE TAPES MARKET: COMPANY EVALUATION MATRIX (KEY PLAYERS), 2024
FIGURE 49
PRESSURE-SENSITIVE ADHESIVE TAPES MARKET: COMPANY FOOTPRINT
FIGURE 50
PRESSURE-SENSITIVE ADHESIVE TAPES MARKET: COMPANY EVALUATION MATRIX (STARTUPS/SMES), 2024
FIGURE 51
BRAND/PRODUCT COMPARISON
FIGURE 52
PRESSURE-SENSITIVE ADHESIVE TAPES MARKET: EV/EBITDA OF KEY MANUFACTURERS
FIGURE 53
PRESSURE-SENSITIVE ADHESIVE TAPES MARKET: ENTERPRISE VALUATION (EV) OF KEY PLAYERS
FIGURE 54
3M COMPANY: COMPANY SNAPSHOT
FIGURE 55
TESA SE: COMPANY SNAPSHOT
FIGURE 56
NITTO DENKO CORPORATION: COMPANY SNAPSHOT
FIGURE 57
LINTEC CORPORATION: COMPANY SNAPSHOT
FIGURE 58
AVERY DENNISON CORPORATION: COMPANY SNAPSHOT
FIGURE 59
BERRY GLOBAL GROUP, INC.: COMPANY SNAPSHOT
FIGURE 60
SCAPA GROUP PLC: COMPANY SNAPSHOT
FIGURE 61
SAINT-GOBAIN S.A.: COMPANY SNAPSHOT


 Exclusive indicates content/data unique to MarketsandMarkets and not available with any competitors.


Growth opportunities and latent adjacency in Pressure Sensitive Adhesive Tapes Market