Project Portfolio Management Market by Component, Deployment Mode, Organization Size (SMEs and Large Enterprises), Vertical (Energy & Utilities, Government & Defense, and IT & Telecom) and Region - Global Forecast to 2027
[284 Pages Report] The global Project Portfolio Management Market size is estimated to grow from USD 4.7 billion in 2022 to USD 6.5 billion by 2027, at a Compound Annual Growth Rate (CAGR) of 6.7% during the forecast period.
Project Portfolio Management helps in aligning project goals with business strategy, informing decision making, improving project selection process, minimizing risk, maximizing business impact, optimizing resource utilization across the enterprise, delivering project within time and budget, increasing ROI, boosting productivity with enhanced team collaboration, creating assets and sharing best practices.
To know about the assumptions considered for the study, Request for Free Sample Report
Market Dynamics
Drivers: Gaining 360 degree view into project operations and resource management
Organizations find it increasingly difficult to align projects with their business strategy in a constantly evolving and changing business environment. Project transparency is critical for proper decision-making and improved project performance. Often, organizations tend to lose focus while handling multiple projects for multiple clients. Even successful projects can reflect overspending, which can be caused by numerous factors, such as poor project estimation, inaccurate scheduling, improper resource allocation, and no visibility into project data. According to Project Management Institute (PMI), 94% of high-maturity organizations noticed a tangible impact after implementing the PPM. Hence, the demand for technology-driven PPM solutions is growing as these solutions help organizations gain a 360-degree view of project operations and resource management. This information gathered would help organizations better project estimation and improve various stages of the project life cycle. Moreover, PPM solutions help organizations do effective resource allocation to mitigate the risk of over or under-allocation.
Restraints: Concerns of organizations related to data confidentiality
Data can be recognized as the most important corporate asset, which requires protection from cyber threats. Organizations embracing new advanced digital technologies are making their business data susceptible to risk. No matter how prepared an organization is in dealing with cybercrimes, it will always face a challenge in beating these threats. Every technology promising to modernize business operations is opening doors for hackers and cybercriminals by providing more entry points to IT infrastructure. This is the prime constraint that restricts enterprises from embracing cloud PPM solutions. The low-cost public cloud services are easily accessible to Small and Medium-sized Enterprises (SMEs). However, these services are more prone to cyberattacks and security concerns, whereas small organizations cannot afford a private cloud due to budget constraints. Furthermore, the accessibility of project management applications on mobile devices is more prone to cyberattacks and information leakage. Hence, it can be inferred that organizations from highly regulated industries hesitate to adopt modern PPM solutions because of budget constraints or information security risk.
Opportunities: Reducing project costs and project failure rate by embracing agile methods
Digitalization has created new opportunities for organizations to optimize their relationships with their business customers. In today’s highly competitive business environment, businesses succeed and fail based on how they manage multiple projects with defined budgets and time. Hence, organizations need to mature their PPM practices to reap benefits from the implemented PPM solution. Best-in-class organizations embrace agile methodologies to eliminate unwanted multitasking and reduce resource overload. Moreover, going agile helps organizations calculate individual project values and the RoI on each of them. Project managers can gain real-time insights into the project performance and make necessary changes whenever required. According to a survey by a leading vendor in the PPM market, implementing a modern PPM solution powered with agile methodologies reduces project turnaround time by 37% on average.
Challenges: Selecting right solutions that align with organisation’s business needs
To stay afloat in an increasingly volatile and highly competitive environment, it becomes very challenging for project-intensive organizations to select the right solution out of the pool of options that can address their specific business requirements as there is no one-size-fits-all PPM solution. Moreover, there is no specific way to assess the capabilities or service qualities of a PPM solution. Even after selecting the solution, one major question arises: giving control of business data. Organizations working on complex projects in a regulated environment are very skeptical about their data as data loss may cost the company millions of dollars and could tarnish the organization's brand image. Moreover, if the implemented solution fails to address any of the parameters, it would impact the day-to-day operations of enterprises and affect their workforce productivity, which may result in capital losses. According to the Project and Portfolio Management Report published in 2017 by Planview, 73% of organizations do not have enough resources to meet the demand, and 55% of organizations state that their projects and resources are not well-aligned with business goals.
Based on component, services segment to be the largest contributor to the project portfolio management market growth during the forecast period
Consulting and implementation services help companies choose the most suitable PPM solution, depending on the requirements of their businesses and end users. Consulting and implementation service providers suggest, analyze, and guide their customers through the solution types that fit their business needs, thereby helping save resources and costs. Vendors and cloud service providers empower their clients through in-depth insights to keep technology aligned with their business strategy. Consulting services assist clients in maximizing their RoI by investing in technologies. These factors include requirement analysis, pricing, and quality of service, competition analysis, technology solutions, and client relations.
Organizations hire project experts to gain an enhanced strategic outlook about PPM solution and services, improve the overall performance, and transform their business operations. The organizations across the globe are implementing consulting and implementation services to effectively handle complex projects with ease and at rapid pace.
Based on vertical, Energy & utilities segment is to be a larger dominator to the project portfolio management market during the forecast period.
Implementing the PPM solution allows the Energy & utilities companies to bring real-time collaboration and visibility across project activities and portfolios, thereby helping track project progress and control costs. The growing focus of organizations toward agile project management for achieving short cycles of product development and delivering incremental updates of the product based on the changing needs of the customer is expected to drive the growth of the PPM solution. With the global shortfall of medical equipment in the COVID-19 pandemic, the requirement for advanced PPM solutions for managing repurposing projects across manufacturing companies is expected to rise in the near future. The growing need to make strategic decisions about product development and the allocation of company resources, such as merchandising, assortment planning, advertising, and store labor, boost the demand for the PPM solution .
Based on organization size, the SMEs segment to grow at the highest growth rate during the forecast period
Organizations with employee numbers ranging between 1 and 999 are categorized under SMEs. Despite the different business models and frameworks used by organizations across industries, there is still a lack of a robust single roadmap that is dedicated to SMEs, which combines the applicable concepts of portfolio management and innovation management at the same time, and provide SMEs with an integrated feature to assist them in selecting and managing the best mix of innovative projects inside one business portfolio, using the most optimized methods. SMEs face some specific challenges, such as the requirement of domain-specific personnel and skilled workforce, budget constraints, and limited economies of scale. Moreover, the rapid adoption of digitalization and automation has augmented profits for SMEs and greatly enhanced their business productivity. The intense competitive market scenario has prompted SMEs to invest in PPM solution and services and adopt data-enabled strategies for making informed business decisions. When compared with large enterprises, SMEs face resource crunch and require a better strategic business and planning process to manage project complexities.
To know about the assumptions considered for the study, download the pdf brochure
APAC to grow at the highest CAGR during the forecast period
Most of the countries in APAC region are rapidly investing in solutions such as enterprise mobility and cloud. With the rapid adoption of these solutions, enterprises are looking forward to adopting PPM methodologies to cater to business optimization needs. The BFSI and government sector are the topmost industries that are keenly looking for the adoption of PPM for smoother project and portfolio management. This region is expected to be the revenue generator segment during the forecast period. Some active PPM vendors in this region are Planview, Daptiv, and Clarizen. The growing need among industries to adopt simulation techniques to effectively handle the complex projects would pave the way for the PPM market growth in China. Leading organizations in India prefer PPM to reduce operational costs and manage the overall complex projects across verticals.
China and India in the APAC region, which are major exporters and hotspots for investments by North American and European enterprises, also experienced delays as a result of the COVID-19 lockdowns.
Key Market Players
The project portfolio management market is dominated by companies such as, Oracle (US), Planview (US), Broadcom (US), SAP (Germany), Microsoft (US), Workfront (US), Hexagon (Sweden), ServiceNow (US), Upland Software (US), Micro Focus (UK), Planisware (France), Sciforma (US), Sopheon (US), Cerri (Switzerland), Keyedin Projects (US), One2Team (US), One point Projects (Austria), Miesterplan (Germany), Intelit Smart Group (Brazil), Bestoutcome (UK), Project Objects (Ireland), Workotter (US), Smartsheet (US), Celoxis (India), Wrike (US), Asana (US), Monday.com (Israel), and Cherwell (US).
Get online access to the report on the World's First Market Intelligence Cloud
- Easy to Download Historical Data & Forecast Numbers
- Company Analysis Dashboard for high growth potential opportunities
- Research Analyst Access for customization & queries
- Competitor Analysis with Interactive dashboard
- Latest News, Updates & Trend analysis
Request Sample Scope of the Report
Get online access to the report on the World's First Market Intelligence Cloud
- Easy to Download Historical Data & Forecast Numbers
- Company Analysis Dashboard for high growth potential opportunities
- Research Analyst Access for customization & queries
- Competitor Analysis with Interactive dashboard
- Latest News, Updates & Trend analysis
Report Metrics |
Details |
Market size available for years |
2017-2027 |
Base year considered |
2022 |
Forecast period |
2022-2027 |
Forecast units |
Value (USD Million) |
Segments covered |
Component, organization size, deployment mode, vertical and Region |
Regions covered |
North America, Europe, APAC, MEA and Latin America |
Companies covered |
Oracle (US), Planview (US), Broadcom (US), SAP (Germany), Microsoft (US), Workfront (US), Hexagon (Sweden), ServiceNow (US), Upland Software (US), Micro Focus (UK), Planisware (France), Sciforma (US), Sopheon (US), Cerri (Switzerland), Keyedin Projects (US), One2Team (US), One point Projects (Austria), Miesterplan (Germany), Intelit Smart Group (Brazil), Bestoutcome (UK), Project Objects (Ireland), Workotter (US), Smartsheet (US), Celoxis (India), Wrike (US), Asana (US), Monday.com (Israel), and Cherwell (US). |
This research report categorizes the project portfolio management market to forecast revenue and analyze trends in each of the following submarkets:
Based on the Component:
- Solution
- Services (consulting and implementation services, and training, support, and maintenance services)
Based on the Organization Size:
- Large Enterprises
- SMEs
Based on Deployment mode:
- On-premises
- Cloud
Based on Vertical:
- Energy & Utilities
- Government & Defense
- IT & Telecom
- Banking, Financial Services and Insurance
- Manufacturing
- Healthcare & Lifesciences
- Consumer Goods & Retail
- Others* (transportation and logistics, and marine and shipbuilding)
Based on regions:
-
North America
- US
- Canada
-
Europe
- UK
- Germany
- France
- Spain
- Rest of Europe
-
APAC
- China
- India
- Japan
- Singapore
- Rest of APAC
-
MEA
- Kingdom of Saudi Arabia
- South Africa
- UAE
- Rest of MEA
-
Latin America
- Brazil
- Mexico
- Rest of Latin America
Recent Developments
- In January 2021, Planview has acquired Clarizen and Changepoint. The acquisition will provide Planview customers with the tools and resources they need to better plan and execute their most important initiatives.
- In June 2020, Oracle has launched Project Control, Project Costing, and Project Management APIs for its PPM Cloud solution, along with Application Composer for Project Foundation and Project Resource Management modules.
- In March 2020, SAP added new templates to its project management tool, Ruum, for helping both individuals and businesses plan and prepare in response to COVID-19.
Frequently Asked Questions (FAQ):
What is the projected market value of the project portfolio management market?
The project portfolio management market size is expected to grow from USD 4.7 Billion in 2022 to USD 6.5 Billion by 2027, at a Compound Annual Growth Rate (CAGR) of 6.7% during the forecast period.
Which region has the highest market share in the project portfolio management market?
North America region has the higher market share in the project portfolio management market.
Which are the major vendors in the project portfolio management market?
Oracle (US), Planview (US), Broadcom (US), SAP (Germany), Microsoft (US), Workfront (US), Hexagon (Sweden), ServiceNow (US), Upland Software (US).
What are some of the drivers in the project portfolio management market?
Gaining 360-degree view into project operations and resource management, growing demand for cloud based PPM solutions are the key drivers. .
To speak to our analyst for a discussion on the above findings, click Speak to Analyst
TABLE OF CONTENTS
1 INTRODUCTION (Page No. - 31)
1.1 INTRODUCTION TO COVID–19
1.2 COVID–19 HEALTH ASSESSMENT
FIGURE 1 COVID–19: GLOBAL PROPAGATION
FIGURE 2 COVID–19 PROPAGATION: SELECT COUNTRIES
1.3 COVID–19 ECONOMIC ASSESSMENT
FIGURE 3 REVISED GROSS DOMESTIC PRODUCT FORECASTS FOR SELECT G20 COUNTRIES IN 2020
1.3.1 COVID–19 ECONOMIC IMPACT—SCENARIO ASSESSMENT
FIGURE 4 CRITERIA IMPACTING THE GLOBAL ECONOMY
FIGURE 5 SCENARIOS IN TERMS OF RECOVERY OF GLOBAL ECONOMY
1.4 OBJECTIVES OF THE STUDY
1.5 MARKET DEFINITION
1.5.1 INCLUSIONS AND EXCLUSIONS
1.6 MARKET SCOPE
1.6.1 MARKET SEGMENTATION
1.6.2 REGIONS COVERED
1.6.3 YEARS CONSIDERED
1.7 CURRENCY CONSIDERED
TABLE 1 UNITED STATES DOLLAR EXCHANGE RATE, 2019–2021
1.8 STAKEHOLDERS
1.9 SUMMARY OF CHANGES
2 RESEARCH METHODOLOGY (Page No. - 41)
2.1 RESEARCH DATA
FIGURE 6 PROJECT PORTFOLIO MANAGEMENT MARKET: RESEARCH DESIGN
2.1.1 SECONDARY DATA
2.1.2 PRIMARY DATA
2.1.2.1 Breakup of primary profiles
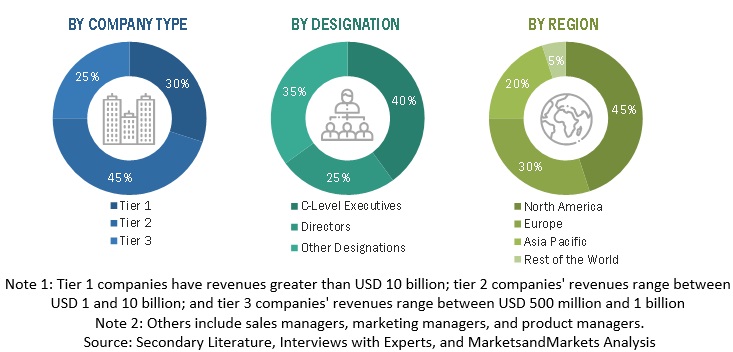
FIGURE 7 BREAKUP OF PRIMARY INTERVIEWS: BY COMPANY TYPE, DESIGNATION, AND REGION
2.1.2.2 Key industry insights
2.2 MARKET BREAKUP AND DATA TRIANGULATION
FIGURE 8 DATA TRIANGULATION
2.3 MARKET SIZE ESTIMATION
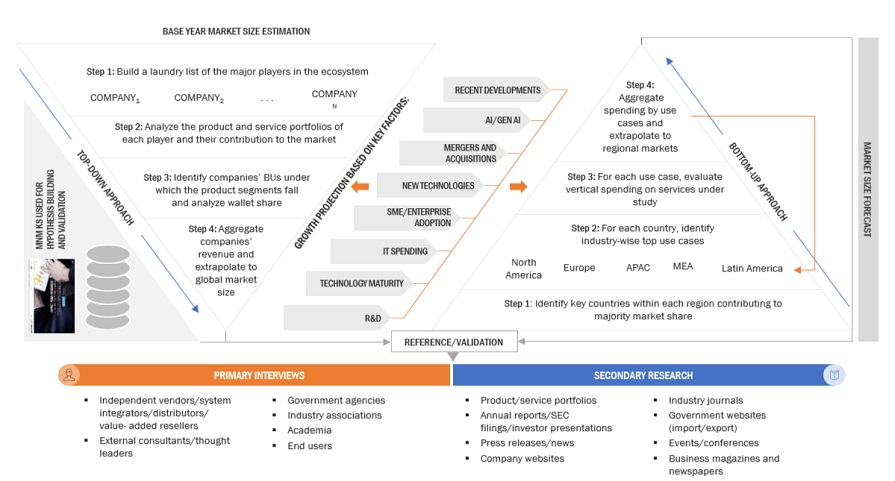
FIGURE 9 PROJECT PORTFOLIO MANAGEMENT MARKET: TOP-DOWN AND BOTTOM-UP APPROACHES
FIGURE 10 MARKET SIZE ESTIMATION METHODOLOGY – APPROACH 1 (SUPPLY-SIDE): REVENUE OF PROJECT PORTFOLIO MANAGEMENT FROM VENDORS
FIGURE 11 MARKET SIZE ESTIMATION METHODOLOGY: BOTTOM-UP APPROACH (SUPPLY-SIDE): COLLECTIVE REVENUE OF PROJECT PORTFOLIO MANAGEMENT VENDORS
FIGURE 12 MARKET SIZE ESTIMATION METHODOLOGY – (SUPPLY-SIDE): ILLUSTRATION OF VENDOR REVENUE ESTIMATION
FIGURE 13 MARKET SIZE ESTIMATION METHODOLOGY – (SUPPLY-SIDE): CAGR PROJECTIONS FROM SUPPLY SIDE
FIGURE 14 MARKET SIZE ESTIMATION METHODOLOGY – APPROACH 2 (DEMAND-SIDE): REVENUE GENERATED FROM PROJECT PORTFOLIO MANAGEMENT COMPONENT
2.4 MARKET FORECAST
TABLE 2 FACTOR ANALYSIS
2.5 ASSUMPTIONS FOR STUDY
2.6 LIMITATIONS OF STUDY
3 EXECUTIVE SUMMARY (Page No. - 53)
FIGURE 15 SOLUTION SEGMENT TO HOLD LARGER MARKET SIZE DURING FORECAST PERIOD (USD MILLION)
FIGURE 16 CONSULTING AND IMPLEMENTATION SERVICES SEGMENT TO HOLD LARGER MARKET SIZE DURING FORECAST PERIOD
FIGURE 17 PROJECT PORTFOLIO MANAGEMENT MARKET: GLOBAL SNAPSHOT
FIGURE 18 LARGE ENTERPRISES TO HOLD LARGER MARKET SIZE DURING FORECAST PERIOD
FIGURE 19 ENERGY & UTILITIES SEGMENT TO HOLD LARGER MARKET SIZE DURING FORECAST PERIOD (USD MILLION)
FIGURE 20 TOP GROWING SEGMENTS IN MARKET
FIGURE 21 NORTH AMERICA TO HOLD LARGEST MARKET SIZE DURING FORECAST PERIOD
4 PREMIUM INSIGHTS (Page No. - 61)
4.1 ATTRACTIVE GROWTH OPPORTUNITIES IN PROJECT PORTFOLIO MANAGEMENT MARKET
FIGURE 22 SOLUTION SEGMENT TO DRIVE GROWTH OF PROJECT PORTFOLIO MARKET
FIGURE 23 DRASTIC GEOGRAPHIC CHANGE AND TECHNOLOGICAL EVOLUTION TO DRIVE MARKET GROWTH
4.2 MARKET, BY ORGANIZATION SIZE (2022 VS. 2027)
FIGURE 24 LARGE ENTERPRISES SEGMENT TO HOLD LARGER MARKET SHARE DURING FORECAST PERIOD
4.3 MARKET, BY DEPLOYMENT MODE (2022 VS. 2027)
FIGURE 25 CLOUD SEGMENT TO HOLD LARGER MARKET SHARE DURING FORECAST PERIOD
4.4 MARKET INVESTMENT SCENARIO
FIGURE 26 ASIA PACIFIC TO EMERGE AS BEST MARKET FOR INVESTMENTS IN NEXT FIVE YEARS
5 MARKET OVERVIEW AND INDUSTRY TRENDS (Page No. - 64)
5.1 INTRODUCTION
5.2 MARKET DYNAMICS
FIGURE 27 DRIVERS, RESTRAINTS, OPPORTUNITIES, AND CHALLENGES: PROJECT PORTFOLIO MANAGEMENT MARKET
5.2.1 DRIVERS
5.2.1.1 Gaining 360-degree view into project operations and resource management
5.2.1.2 Growing demand for cloud-based PPM solutions
5.2.2 RESTRAINTS
5.2.2.1 Concerns of organizations related to data confidentiality
5.2.3 OPPORTUNITIES
5.2.3.1 Reducing project costs and project failure rate by embracing agile methods
5.2.4 CHALLENGES
5.2.4.1 Selecting right solutions that align with organization’s business needs
5.2.4.2 Blending modern PPM solutions with legacy systems
5.3 INDUSTRY TRENDS
5.3.1 USE CASES
5.3.1.1 Use case 1: Schweizer Electronic AG CHOSE Daptiv PPM solution of changepoint to manage portfolio and align it
5.3.1.2 Use case 2: Zhongda Testing implemented Oracle PPM solution to strengthen cost control and boost profitability
5.3.1.3 Use case 3: RBS deployed Planview Enterprise One to speed up delivery process and eliminate infrastructure management
5.3.1.4 Use case 4: Basware reduced revenue leakage by 75% after implementing Planview Enterprise One and Projectplace
5.3.2 EMERGING USE CASES
FIGURE 28 TECHNOLOGY AND ENGINEERING VERTICALS
FIGURE 29 MANUFACTURING AND EDUCATION VERTICALS
FIGURE 30 RETAIL AND RESEARCH AND DEVELOPMENT VERTICALS
5.4 VENDOR FEATURE COMPARISON
TABLE 3 VENDOR FEATURE COMPARISON (1/2)
TABLE 4 VENDOR FEATURE COMPARISON (2/2)
5.5 SUPPLY CHAIN ANALYSIS
FIGURE 31 PROJECT PORTFOLIO MANAGEMENT MARKET: SUPPLY CHAIN ANALYSIS
5.6 PATENT ANALYSIS
FIGURE 32 NUMBER OF PATENTS PUBLISHED
FIGURE 33 TOP FIVE PATENT OWNERS (GLOBAL)
TABLE 5 TOP TEN PATENT OWNERS (US)
5.7 TECHNOLOGY ANALYSIS
5.7.1 ARTIFICIAL INTELLIGENCE
5.7.2 BIG DATA AND ANALYTICS
5.7.3 MACHINE LEARNING
5.7.4 INTERNET OF THINGS
5.8 PORTER’S FIVE FORCES ANALYSIS
FIGURE 34 MARKET: PORTER’S FIVE FORCES ANALYSIS
TABLE 6 MARKET: PORTER’S FIVE FORCES ANALYSIS
5.8.1 THREAT OF NEW ENTRANTS
5.8.2 THREAT OF SUBSTITUTES
5.8.3 BARGAINING POWER OF SUPPLIERS
5.8.4 BARGAINING POWER OF BUYERS
5.8.5 INTENSITY OF COMPETITIVE RIVALRY
5.9 KEY CONFERENCES & EVENTS IN 2022-23
TABLE 7 PROJECT PORTFOLIO MANAGEMENT MARKET: DETAILED LIST OF CONFERENCES & EVENTS
5.10 MARKET: COVID-19 IMPACT
FIGURE 35 MARKET TO GROW AT SLOW PACE DURING 2020–2021 OWING TO COVID-19
5.10.1 COVID-19 DEVELOPMENTS
5.10.2 COVID-19-DRIVEN MARKET DYNAMICS
5.10.2.1 Drivers and opportunities
5.10.2.2 Restraints and challenges
5.11 TARIFF AND REGULATORY LANDSCAPE
5.11.1 REGULATORY BODIES, GOVERNMENT AGENCIES, AND OTHER ORGANIZATIONS
TABLE 8 NORTH AMERICA: LIST OF REGULATORY BODIES, GOVERNMENT AGENCIES, AND OTHER ORGANIZATIONS
TABLE 9 EUROPE: LIST OF REGULATORY BODIES, GOVERNMENT AGENCIES, AND OTHER ORGANIZATIONS
TABLE 10 ASIA-PACIFIC: LIST OF REGULATORY BODIES, GOVERNMENT AGENCIES, AND OTHER ORGANIZATIONS
TABLE 11 REST OF WORLD: LIST OF REGULATORY BODIES, GOVERNMENT AGENCIES, AND OTHER ORGANIZATIONS
5.11.2 REGULATIONS
5.11.2.1 North America
5.11.2.2 Europe
5.11.2.3 Asia Pacific
5.11.2.4 Middle East and South Africa
5.11.2.5 Latin America
6 PROJECT PORTFOLIO MANAGEMENT MARKET, BY COMPONENT (Page No. - 89)
6.1 INTRODUCTION
6.1.1 COMPONENT: MARKET DRIVERS
6.1.2 COMPONENT: COVID-19 IMPACT
FIGURE 36 SERVICES SEGMENT TO GROW AT HIGHER CAGR DURING FORECAST PERIOD
TABLE 12 MARKET, BY COMPONENT, 2017–2021 (USD MILLION)
TABLE 13 MARKET, BY COMPONENT, 2022–2027 (USD MILLION)
6.2 SOLUTION
TABLE 14 SOLUTION: MARKET, BY REGION, 2017–2021 (USD MILLION)
TABLE 15 SOLUTION: MARKET, BY REGION, 2022–2027 (USD MILLION)
6.3 SERVICES
FIGURE 37 TRAINING, SUPPORT, AND MAINTENANCE SEGMENT TO GROW AT HIGHER CAGR DURING FORECAST PERIOD
TABLE 16 SERVICES: MARKET, BY REGION, 2017–2021 (USD MILLION)
TABLE 17 SERVICES: MARKET, BY REGION, 2022–2027 (USD MILLION)
TABLE 18 SERVICES: MARKET, BY TYPE, 2017–2021 (USD MILLION)
TABLE 19 SERVICES: MARKET, BY TYPE, 2022–2027(USD MILLION)
6.3.1 CONSULTING AND IMPLEMENTATION
6.3.2 TRAINING, SUPPORT, AND MAINTENANCE
7 PROJECT PORTFOLIO MANAGEMENT MARKET, BY DEPLOYMENT MODE (Page No. - 95)
7.1 INTRODUCTION
FIGURE 38 CLOUD SEGMENT TO GROW AT HIGHER CAGR DURING FORECAST PERIOD
7.1.1 DEPLOYMENT MODE: MARKET DRIVERS
7.1.2 DEPLOYMENT MODE: COVID-19 IMPACT
TABLE 20 MARKET, BY DEPLOYMENT MODE, 2017–2021 (USD MILLION)
TABLE 21 MARKET, BY DEPLOYMENT MODE, 2022–2027 (USD MILLION)
7.2 ON-PREMISES
TABLE 22 ON-PREMISES: MARKET, BY REGION, 2017–2021 (USD MILLION)
TABLE 23 ON-PREMISES: MARKET, BY REGION, 2022–2027 (USD MILLION)
7.3 CLOUD
TABLE 24 CLOUD: MARKET, BY REGION, 2017–2021 (USD MILLION)
TABLE 25 CLOUD: MARKET, BY REGION, 2022–2027 (USD MILLION)
8 PROJECT PORTFOLIO MANAGEMENT MARKET, BY ORGANIZATION SIZE (Page No. - 100)
8.1 INTRODUCTION
FIGURE 39 SMALL AND MEDIUM-SIZED ENTERPRISES SEGMENT TO GROW AT HIGHER CAGR DURING FORECAST PERIOD
8.1.1 ORGANIZATION SIZE: MARKET DRIVERS
8.1.2 ORGANIZATION SIZE: COVID-19 IMPACT
TABLE 26 MARKET, BY ORGANIZATION SIZE, 2017–2021 (USD MILLION)
TABLE 27 MARKET, BY ORGANIZATION SIZE, 2022–2027 (USD MILLION)
8.2 LARGE ENTERPRISES
TABLE 28 LARGE ENTERPRISES: MARKET, BY REGION, 2017–2021 (USD MILLION)
TABLE 29 LARGE ENTERPRISES: MARKET, BY REGION, 2022–2027 (USD MILLION)
8.3 SMALL AND MEDIUM-SIZED ENTERPRISES
TABLE 30 SMALL AND MEDIUM-SIZED ENTERPRISES: MARKET, BY REGION, 2017–2021 (USD MILLION)
TABLE 31 SMALL AND MEDIUM-SIZED ENTERPRISES: MARKET, BY REGION, 2022–2027 (USD MILLION)
9 PROJECT PORTFOLIO MANAGEMENT MARKET, BY VERTICAL (Page No. - 105)
9.1 INTRODUCTION
FIGURE 40 RETAIL AND CONSUMER GOODS VERTICAL TO GROW AT HIGHEST CAGR DURING FORECAST PERIOD
9.1.1 VERTICAL: MARKET DRIVERS
9.1.2 VERTICAL: COVID-19 IMPACT
TABLE 32 MARKET, BY VERTICAL, 2017–2021 (USD MILLION)
TABLE 33 MARKET, BY VERTICAL, 2022–2027 (USD MILLION)
9.2 ENERGY & UTILITIES
TABLE 34 ENERGY & UTILITIES: MARKET, BY REGION, 2017–2021 (USD MILLION)
TABLE 35 ENERGY & UTILITIES: MARKET, BY REGION, 2022–2027 (USD MILLION)
9.3 GOVERNMENT & DEFENSE
TABLE 36 GOVERNMENT & DEFENSE: MARKET, BY REGION, 2017–2021 (USD MILLION)
TABLE 37 GOVERNMENT & DEFENSE: MARKET, BY REGION, 2022–2027 (USD MILLION)
9.4 IT & TELECOM
TABLE 38 IT & TELECOM: MARKET, BY REGION, 2017–2021 (USD MILLION)
TABLE 39 IT & TELECOM: MARKET, BY REGION, 2022–2027 (USD MILLION)
9.5 BANKING, FINANCIAL SERVICES, AND INSURANCE
TABLE 40 BANKING, FINANCIAL SERVICES, AND INSURANCE: PROJECT PORTFOLIO MANAGEMENT MARKET, BY REGION, 2017–2021 (USD MILLION)
TABLE 41 BANKING, FINANCIAL SERVICES, AND INSURANCE: MARKET, BY REGION, 2022–2027 (USD MILLION)
9.6 MANUFACTURING
TABLE 42 MANUFACTURING: MARKET, BY REGION, 2017–2021 (USD MILLION)
TABLE 43 MANUFACTURING: MARKET, BY REGION, 2022–2027 (USD MILLION)
9.7 HEALTHCARE & LIFE SCIENCES
TABLE 44 HEALTHCARE & LIFE SCIENCES: MARKET, BY REGION, 2017–2021 (USD MILLION)
TABLE 45 HEALTHCARE & LIFE SCIENCES: MARKET, BY REGION, 2022–2027 (USD MILLION)
9.8 CONSUMER GOODS & RETAIL
TABLE 46 CONSUMER GOODS & RETAIL: MARKET, BY REGION, 2017–2021 (USD MILLION)
TABLE 47 CONSUMER GOODS & RETAIL: MARKET, BY REGION, 2022–2027 (USD MILLION)
9.9 OTHER VERTICALS
TABLE 48 OTHER VERTICALS: MARKET, BY REGION, 2017–2021 (USD MILLION)
TABLE 49 OTHER VERTICALS: MARKET, BY REGION, 2022–2027 (USD MILLION)
10 PROJECT PORTFOLIO MANAGEMENT MARKET, BY REGION (Page No. - 117)
10.1 INTRODUCTION
FIGURE 41 ASIA PACIFIC TO GROW AT HIGHEST CAGR DURING FORECAST PERIOD
TABLE 50 MARKET, BY REGION, 2017–2021 (USD MILLION)
TABLE 51 MARKET, BY REGION, 2022–2027 (USD MILLION)
10.2 NORTH AMERICA
10.2.1 NORTH AMERICA: MARKET DRIVERS
10.2.2 NORTH AMERICA: COVID-19 IMPACT
FIGURE 42 NORTH AMERICA: MARKET SNAPSHOT
TABLE 52 NORTH AMERICA: PROJECT PORTFOLIO MANAGEMENT MARKET, BY COMPONENT, 2017–2021 (USD MILLION)
TABLE 53 NORTH AMERICA: MARKET, BY COMPONENT, 2022–2027 (USD MILLION)
TABLE 54 NORTH AMERICA: PROJECT PORTFOLIO MANAGEMENT SOLUTION MARKET, BY COUNTRY, 2017–2021 (USD MILLION)
TABLE 55 NORTH AMERICA: PROJECT PORTFOLIO MANAGEMENT SOLUTION MARKET, BY COUNTRY, 2022–2027 (USD MILLION)
TABLE 56 NORTH AMERICA: PROJECT PORTFOLIO MANAGEMENT SERVICES MARKET, BY COUNTRY, 2017–2021 (USD MILLION)
TABLE 57 NORTH AMERICA: PROJECT PORTFOLIO MANAGEMENT SERVICES MARKET, BY COUNTRY, 2022–2027 (USD MILLION)
TABLE 58 NORTH AMERICA: MARKET, BY SERVICE, 2017–2021 (USD MILLION)
TABLE 59 NORTH AMERICA: MARKET, BY SERVICE, 2022–2027 (USD MILLION)
TABLE 60 NORTH AMERICA: PROJECT PORTFOLIO MANAGEMENT CONSULTING AND IMPLEMENTATION MARKET, BY COUNTRY, 2017–2021 (USD MILLION)
TABLE 61 NORTH AMERICA: PROJECT PORTFOLIO MANAGEMENT CONSULTING AND IMPLEMENTATION MARKET, BY COUNTRY, 2022–2027 (USD MILLION)
TABLE 62 NORTH AMERICA: PROJECT PORTFOLIO MANAGEMENT TRAINING, SUPPORT, AND MAINTENANCE MARKET, BY COUNTRY, 2017–2021 (USD MILLION)
TABLE 63 NORTH AMERICA: PROJECT PORTFOLIO MANAGEMENT TRAINING, SUPPORT, AND MAINTENANCE MARKET, BY COUNTRY, 2022–2027 (USD MILLION)
TABLE 64 NORTH AMERICA: PROJECT PORTFOLIO MANAGEMENT MARKET, BY ORGANIZATION SIZE, 2017–2021 (USD MILLION)
TABLE 65 NORTH AMERICA: MARKET, BY ORGANIZATION SIZE, 2022–2027 (USD MILLION)
TABLE 66 NORTH AMERICA: PROJECT PORTFOLIO MANAGEMENT SMALL AND MEDIUM-SIZED ENTERPRISES MARKET, BY COUNTRY, 2017–2021 (USD MILLION)
TABLE 67 NORTH AMERICA: PROJECT PORTFOLIO MANAGEMENT SMALL AND MEDIUM-SIZED ENTERPRISES MARKET, BY COUNTRY, 2022–2027 (USD MILLION)
TABLE 68 NORTH AMERICA: PROJECT PORTFOLIO MANAGEMENT LARGE ENTERPRISES MARKET, BY COUNTRY, 2017–2021 (USD MILLION)
TABLE 69 NORTH AMERICA: PROJECT PORTFOLIO MANAGEMENT LARGE ENTERPRISES MARKET, BY COUNTRY, 2022–2027 (USD MILLION)
TABLE 70 NORTH AMERICA: MARKET, BY DEPLOYMENT MODE, 2017–2021 (USD MILLION)
TABLE 71 NORTH AMERICA: MARKET, BY DEPLOYMENT MODE, 2022–2027 (USD MILLION)
TABLE 72 NORTH AMERICA: PROJECT PORTFOLIO MANAGEMENT CLOUD MARKET, BY COUNTRY, 2017–2021 (USD MILLION)
TABLE 73 NORTH AMERICA: PROJECT PORTFOLIO MANAGEMENT CLOUD MARKET, BY COUNTRY, 2022–2027 (USD MILLION)
TABLE 74 NORTH AMERICA: PROJECT PORTFOLIO MANAGEMENT ON-PREMISES MARKET, BY COUNTRY, 2017–2021 (USD MILLION)
TABLE 75 NORTH AMERICA: PROJECT PORTFOLIO MANAGEMENT ON-PREMISES MARKET, BY COUNTRY, 2022–2027 (USD MILLION)
TABLE 76 NORTH AMERICA: MARKET, BY VERTICAL, 2017–2021 (USD MILLION)
TABLE 77 NORTH AMERICA: MARKET, BY VERTICAL, 2022–2027 (USD MILLION)
TABLE 78 NORTH AMERICA: MARKET, BY COUNTRY, 2017–2021 (USD MILLION)
TABLE 79 NORTH AMERICA: MARKET, BY COUNTRY, 2022–2027 (USD MILLION)
10.2.3 UNITED STATES
TABLE 80 UNITED STATES: PROJECT PORTFOLIO MANAGEMENT MARKET, BY COMPONENT, 2017–2021 (USD MILLION)
TABLE 81 UNITED STATES: MARKET, BY COMPONENT, 2022–2027 (USD MILLION)
TABLE 82 UNITED STATES: MARKET, BY SERVICE, 2017–2021 (USD MILLION)
TABLE 83 UNITED STATES: MARKET, BY SERVICE, 2022–2027 (USD MILLION)
TABLE 84 UNITED STATES: MARKET, BY DEPLOYMENT MODE, 2017–2021 (USD MILLION)
TABLE 85 UNITED STATES: MARKET, BY DEPLOYMENT MODE, 2022–2027 (USD MILLION)
TABLE 86 UNITED STATES: MARKET, BY ORGANIZATION SIZE, 2017–2021 (USD MILLION)
TABLE 87 UNITED STATES: MARKET, BY ORGANIZATION SIZE, 2022–2027 (USD MILLION)
10.2.4 CANADA
TABLE 88 CANADA: PROJECT PORTFOLIO MANAGEMENT MARKET, BY COMPONENT, 2017–2021 (USD MILLION)
TABLE 89 CANADA: MARKET, BY COMPONENT, 2022–2027 (USD MILLION)
TABLE 90 CANADA: MARKET, BY SERVICE, 2017–2021 (USD MILLION)
TABLE 91 CANADA MARKET, BY SERVICE, 2022–2027 (USD MILLION)
TABLE 92 CANADA: MARKET, BY DEPLOYMENT MODE, 2017–2021 (USD MILLION)
TABLE 93 CANADA: MARKET, BY DEPLOYMENT MODE, 2022–2027 (USD MILLION)
TABLE 94 CANADA: MARKET, BY ORGANIZATION SIZE, 2017–2021 (USD MILLION)
TABLE 95 CANADA: MARKET, BY ORGANIZATION SIZE, 2022–2027 (USD MILLION)
10.3 EUROPE
10.3.1 EUROPE: PROJECT PORTFOLIO MANAGEMENT MARKET DRIVERS
10.3.2 EUROPE: COVID 19 IMPACT
TABLE 96 EUROPE: MARKET, BY COMPONENT, 2017–2021 (USD MILLION)
TABLE 97 EUROPE: MARKET, BY COMPONENT, 2022–2027 (USD MILLION)
TABLE 98 EUROPE: PROJECT PORTFOLIO MANAGEMENT SOLUTION MARKET, BY COUNTRY, 2017–2021 (USD MILLION)
TABLE 99 EUROPE: PROJECT PORTFOLIO MANAGEMENT SOLUTION MARKET, BY COUNTRY, 2022–2027 (USD MILLION)
TABLE 100 EUROPE: PROJECT PORTFOLIO MANAGEMENT SERVICES MARKET, BY COUNTRY, 2017–2021 (USD MILLION)
TABLE 101 EUROPE: PROJECT PORTFOLIO MANAGEMENT SERVICES MARKET, BY COUNTRY, 2022–2027 (USD MILLION)
TABLE 102 EUROPE: MARKET, BY SERVICE, 2017–2021 (USD MILLION)
TABLE 103 EUROPE: MARKET, BY SERVICE, 2022–2027 (USD MILLION)
TABLE 104 EUROPE: PROJECT PORTFOLIO MANAGEMENT CONSULTING AND IMPLEMENTATION MARKET, BY COUNTRY, 2017–2021 (USD MILLION)
TABLE 105 EUROPE: PROJECT PORTFOLIO MANAGEMENT CONSULTING AND IMPLEMENTATION MARKET, BY COUNTRY, 2022–2027 (USD MILLION)
TABLE 106 EUROPE: PROJECT PORTFOLIO MANAGEMENT TRAINING, SUPPORT, AND MAINTENANCE MARKET, BY COUNTRY, 2017–2021 (USD MILLION)
TABLE 107 EUROPE: PROJECT PORTFOLIO MANAGEMENT TRAINING, SUPPORT, AND MAINTENANCE MARKET, BY COUNTRY, 2022–2027 (USD MILLION)
TABLE 108 EUROPE: PROJECT PORTFOLIO MANAGEMENT MARKET, BY ORGANIZATION SIZE, 2017–2021 (USD MILLION)
TABLE 109 EUROPE: MARKET, BY ORGANIZATION SIZE, 2022–2027 (USD MILLION)
TABLE 110 EUROPE: PROJECT PORTFOLIO MANAGEMENT SMALL AND MEDIUM-SIZED ENTERPRISES MARKET, BY COUNTRY, 2017–2021 (USD MILLION)
TABLE 111 EUROPE: PROJECT PORTFOLIO MANAGEMENT SMALL AND MEDIUM-SIZED ENTERPRISES MARKET, BY COUNTRY, 2022–2027 (USD MILLION)
TABLE 112 EUROPE: PROJECT PORTFOLIO MANAGEMENT LARGE ENTERPRISES MARKET, BY COUNTRY, 2017–2021 (USD MILLION)
TABLE 113 EUROPE: PROJECT PORTFOLIO MANAGEMENT LARGE ENTERPRISES MARKET, BY COUNTRY, 2022–2027 (USD MILLION)
TABLE 114 EUROPE: MARKET, BY DEPLOYMENT MODE, 2017–2021 (USD MILLION)
TABLE 115 EUROPE: MARKET, BY DEPLOYMENT MODE, 2022–2027 (USD MILLION)
TABLE 116 EUROPE: PROJECT PORTFOLIO MANAGEMENT CLOUD MARKET, BY COUNTRY, 2017–2021 (USD MILLION)
TABLE 117 EUROPE: PROJECT PORTFOLIO MANAGEMENT CLOUD MARKET, BY COUNTRY, 2022–2027 (USD MILLION)
TABLE 118 EUROPE: PROJECT PORTFOLIO MANAGEMENT ON-PREMISES MARKET, BY COUNTRY, 2017–2021 (USD MILLION)
TABLE 119 EUROPE: PROJECT PORTFOLIO MANAGEMENT ON-PREMISES MARKET, BY COUNTRY, 2022–2027 (USD MILLION)
TABLE 120 EUROPE: MARKET, BY VERTICAL, 2017–2021 (USD MILLION)
TABLE 121 EUROPE: MARKET, BY VERTICAL, 2022–2027 (USD MILLION)
TABLE 122 EUROPE: MARKET, BY COUNTRY, 2017–2021 (USD MILLION)
TABLE 123 EUROPE: MARKET, BY COUNTRY, 2022–2027 (USD MILLION)
10.3.3 UNITED KINGDOM
TABLE 124 UNITED KINGDOM: PROJECT PORTFOLIO MANAGEMENT MARKET, BY COMPONENT, 2017–2021 (USD MILLION)
TABLE 125 UNITED KINGDOM: MARKET, BY COMPONENT, 2022–2027 (USD MILLION)
TABLE 126 UNITED KINGDOM: MARKET, BY SERVICE, 2017–2021 (USD MILLION)
TABLE 127 UNITED KINGDOM: MARKET, BY SERVICE, 2022–2027 (USD MILLION)
TABLE 128 UNITED KINGDOM: MARKET, BY DEPLOYMENT MODE, 2017–2021 (USD MILLION)
TABLE 129 UNITED KINGDOM: MARKET, BY DEPLOYMENT MODE, 2022–2027 (USD MILLION)
TABLE 130 UNITED KINGDOM: MARKET, BY ORGANIZATION SIZE, 2017–2021 (USD MILLION)
TABLE 131 UNITED KINGDOM: MARKET, BY ORGANIZATION SIZE, 2022–2027 (USD MILLION)
10.3.4 GERMANY
TABLE 132 GERMANY: PROJECT PORTFOLIO MANAGEMENT MARKET, BY COMPONENT, 2017–2021 (USD MILLION)
TABLE 133 GERMANY: MARKET, BY COMPONENT, 2022–2027 (USD MILLION)
TABLE 134 GERMANY: MARKET, BY SERVICE, 2017–2021 (USD MILLION)
TABLE 135 GERMANY: MARKET, BY SERVICE, 2022–2027 (USD MILLION)
TABLE 136 GERMANY: MARKET, BY DEPLOYMENT MODE, 2017–2021 (USD MILLION)
TABLE 137 GERMANY: MARKET, BY DEPLOYMENT MODE, 2022–2027 (USD MILLION)
TABLE 138 GERMANY: MARKET, BY ORGANIZATION SIZE, 2017–2021 (USD MILLION)
TABLE 139 GERMANY: MARKET, BY ORGANIZATION SIZE, 2022–2027 (USD MILLION)
10.3.5 FRANCE
TABLE 140 FRANCE: PROJECT PORTFOLIO MANAGEMENT MARKET, BY COMPONENT, 2017–2021 (USD MILLION)
TABLE 141 FRANCE: MARKET, BY COMPONENT, 2022–2027 (USD MILLION)
TABLE 142 FRANCE: MARKET, BY SERVICE, 2017–2021 (USD MILLION)
TABLE 143 FRANCE: MARKET, BY SERVICE, 2022–2027 (USD MILLION)
TABLE 144 FRANCE: MARKET, BY DEPLOYMENT MODE, 2017–2021 (USD MILLION)
TABLE 145 FRANCE: MARKET, BY DEPLOYMENT MODE, 2022–2027 (USD MILLION)
TABLE 146 FRANCE: MARKET, BY ORGANIZATION SIZE, 2017–2021 (USD MILLION)
TABLE 147 FRANCE: MARKET, BY ORGANIZATION SIZE, 2022–2027 (USD MILLION)
10.3.6 SPAIN
TABLE 148 SPAIN: PROJECT PORTFOLIO MANAGEMENT MARKET, BY COMPONENT, 2017–2021 (USD MILLION)
TABLE 149 SPAIN: MARKET, BY COMPONENT, 2022–2027 (USD MILLION)
TABLE 150 SPAIN: MARKET, BY SERVICE, 2017–2021 (USD MILLION)
TABLE 151 SPAIN: MARKET, BY SERVICE, 2022–2027 (USD MILLION)
TABLE 152 SPAIN: MARKET, BY DEPLOYMENT MODE, 2017–2021 (USD MILLION)
TABLE 153 SPAIN: MARKET, BY DEPLOYMENT MODE, 2022–2027 (USD MILLION)
TABLE 154 SPAIN: MARKET, BY ORGANIZATION SIZE, 2017–2021 (USD MILLION)
TABLE 155 SPAIN: MARKET, BY ORGANIZATION SIZE, 2022–2027 (USD MILLION)
10.3.7 REST OF EUROPE
TABLE 156 REST OF EUROPE: PROJECT PORTFOLIO MANAGEMENT MARKET, BY COMPONENT, 2017–2021 (USD MILLION)
TABLE 157 REST OF EUROPE: MARKET, BY COMPONENT, 2022–2027 (USD MILLION)
TABLE 158 REST OF EUROPE: MARKET, BY SERVICE, 2017–2021 (USD MILLION)
TABLE 159 REST OF EUROPE: MARKET, BY SERVICE, 2022–2027 (USD MILLION)
TABLE 160 REST OF EUROPE: MARKET, BY DEPLOYMENT MODE, 2017–2021 (USD MILLION)
TABLE 161 REST OF EUROPE: MARKET, BY DEPLOYMENT MODE, 2022–2027 (USD MILLION)
TABLE 162 REST OF EUROPE: MARKET, BY ORGANIZATION SIZE, 2017–2021 (USD MILLION)
TABLE 163 REST OF EUROPE: MARKET, BY ORGANIZATION SIZE, 2022–2027 (USD MILLION)
10.4 ASIA PACIFIC
10.4.1 APAC: MARKET DRIVERS
10.4.2 APAC: COVID 19 IMPACT
FIGURE 43 ASIA PACIFIC: MARKET SNAPSHOT
TABLE 164 ASIA PACIFIC: PROJECT PORTFOLIO MANAGEMENT MARKET, BY COMPONENT, 2017–2021 (USD MILLION)
TABLE 165 ASIA PACIFIC: MARKET, BY COMPONENT, 2022–2027 (USD MILLION)
TABLE 166 ASIA PACIFIC: PROJECT PORTFOLIO MANAGEMENT SOLUTION MARKET, BY COUNTRY, 2017–2021 (USD MILLION)
TABLE 167 ASIA PACIFIC: PROJECT PORTFOLIO MANAGEMENT SOLUTION MARKET, BY COUNTRY, 2022–2027 (USD MILLION)
TABLE 168 ASIA PACIFIC: PROJECT PORTFOLIO MANAGEMENT SERVICES MARKET, BY COUNTRY, 2017–2021 (USD MILLION)
TABLE 169 ASIA PACIFIC: PROJECT PORTFOLIO MANAGEMENT SERVICES MARKET, BY COUNTRY, 2022–2027 (USD MILLION)
TABLE 170 ASIA PACIFIC: MARKET, BY SERVICE, 2017–2021 (USD MILLION)
TABLE 171 ASIA PACIFIC: MARKET, BY SERVICE, 2022–2027 (USD MILLION)
TABLE 172 ASIA PACIFIC: PROJECT PORTFOLIO MANAGEMENT CONSULTING AND IMPLEMENTATION MARKET, BY COUNTRY, 2017–2021 (USD MILLION)
TABLE 173 ASIA PACIFIC: PROJECT PORTFOLIO MANAGEMENT CONSULTING AND IMPLEMENTATION MARKET, BY COUNTRY, 2022–2027 (USD MILLION)
TABLE 174 ASIA PACIFIC: PROJECT PORTFOLIO MANAGEMENT TRAINING, SUPPORT, AND MAINTENANCE MARKET, BY COUNTRY, 2017–2021 (USD MILLION)
TABLE 175 ASIA PACIFIC: PROJECT PORTFOLIO MANAGEMENT TRAINING, SUPPORT, AND MAINTENANCE MARKET, BY COUNTRY, 2022–2027 (USD MILLION)
TABLE 176 ASIA PACIFIC: PROJECT PORTFOLIO MANAGEMENT MARKET, BY ORGANIZATION SIZE, 2017–2021 (USD MILLION)
TABLE 177 ASIA PACIFIC: MARKET, BY ORGANIZATION SIZE, 2022–2027 (USD MILLION)
TABLE 178 ASIA PACIFIC: PROJECT PORTFOLIO MANAGEMENT SMALL AND MEDIUM-SIZED ENTERPRISES MARKET, BY COUNTRY, 2017–2021 (USD MILLION)
TABLE 179 ASIA PACIFIC: PROJECT PORTFOLIO MANAGEMENT SMALL AND MEDIUM-SIZED ENTERPRISES MARKET, BY COUNTRY, 2022–2027 (USD MILLION)
TABLE 180 ASIA PACIFIC: PROJECT PORTFOLIO MANAGEMENT LARGE ENTERPRISES MARKET, BY COUNTRY, 2017–2021 (USD MILLION)
TABLE 181 ASIA PACIFIC: PROJECT PORTFOLIO MANAGEMENT LARGE ENTERPRISES MARKET, BY COUNTRY, 2022–2027 (USD MILLION)
TABLE 182 ASIA PACIFIC: MARKET, BY DEPLOYMENT MODE, 2017–2021 (USD MILLION)
TABLE 183 ASIA PACIFIC: MARKET, BY DEPLOYMENT MODE, 2022–2027 (USD MILLION)
TABLE 184 ASIA PACIFIC: PROJECT PORTFOLIO MANAGEMENT CLOUD MARKET, BY COUNTRY, 2017–2021 (USD MILLION)
TABLE 185 ASIA PACIFIC: PROJECT PORTFOLIO MANAGEMENT CLOUD MARKET, BY COUNTRY, 2022–2027 (USD MILLION)
TABLE 186 ASIA PACIFIC: PROJECT PORTFOLIO MANAGEMENT ON-PREMISES MARKET, BY COUNTRY, 2017–2021 (USD MILLION)
TABLE 187 ASIA PACIFIC: PROJECT PORTFOLIO MANAGEMENT ON-PREMISES MARKET, BY COUNTRY, 2022–2027 (USD MILLION)
TABLE 188 ASIA PACIFIC: MARKET, BY VERTICAL, 2017–2021 (USD MILLION)
TABLE 189 ASIA PACIFIC: MARKET, BY VERTICAL, 2022–2027 (USD MILLION)
TABLE 190 ASIA PACIFIC: MARKET, BY COUNTRY, 2017–2021 (USD MILLION)
TABLE 191 ASIA PACIFIC: MARKET, BY COUNTRY, 2022–2027 (USD MILLION)
10.4.3 CHINA
TABLE 192 CHINA: PROJECT PORTFOLIO MANAGEMENT MARKET, BY COMPONENT, 2017–2021 (USD MILLION)
TABLE 193 CHINA: MARKET, BY COMPONENT, 2022–2027 (USD MILLION)
TABLE 194 CHINA: MARKET, BY SERVICE, 2017–2021 (USD MILLION)
TABLE 195 CHINA: MARKET, BY SERVICE, 2022–2027 (USD MILLION)
TABLE 196 CHINA: MARKET, BY DEPLOYMENT MODE, 2017–2021 (USD MILLION)
TABLE 197 CHINA: MARKET, BY DEPLOYMENT MODE, 2022–2027 (USD MILLION)
TABLE 198 CHINA: MARKET, BY ORGANIZATION SIZE, 2017–2021 (USD MILLION)
TABLE 199 CHINA: MARKET, BY ORGANIZATION SIZE, 2022–2027 (USD MILLION)
10.4.4 INDIA
TABLE 200 INDIA: PROJECT PORTFOLIO MANAGEMENT MARKET, BY COMPONENT, 2017–2021 (USD MILLION)
TABLE 201 INDIA: MARKET, BY COMPONENT, 2022–2027 (USD MILLION)
TABLE 202 INDIA: MARKET, BY SERVICE, 2017–2021 (USD MILLION)
TABLE 203 INDIA: MARKET, BY SERVICE, 2022–2027 (USD MILLION)
TABLE 204 INDIA: MARKET, BY DEPLOYMENT MODE, 2017–2021 (USD MILLION)
TABLE 205 INDIA: MARKET, BY DEPLOYMENT MODE, 2022–2027 (USD MILLION)
TABLE 206 INDIA: MARKET, BY ORGANIZATION SIZE, 2017–2021 (USD MILLION)
TABLE 207 INDIA: MARKET, BY ORGANIZATION SIZE, 2022–2027 (USD MILLION)
10.4.5 JAPAN
TABLE 208 JAPAN: PROJECT PORTFOLIO MANAGEMENT MARKET, BY COMPONENT, 2017–2021 (USD MILLION)
TABLE 209 JAPAN: MARKET, BY COMPONENT, 2022–2027 (USD MILLION)
TABLE 210 JAPAN: MARKET, BY SERVICE, 2017–2021 (USD MILLION)
TABLE 211 JAPAN: MARKET, BY SERVICE, 2022–2027 (USD MILLION)
TABLE 212 JAPAN: MARKET, BY DEPLOYMENT MODE, 2017–2021 (USD MILLION)
TABLE 213 JAPAN: MARKET, BY DEPLOYMENT MODE, 2022–2027 (USD MILLION)
TABLE 214 JAPAN: MARKET, BY ORGANIZATION SIZE, 2017–2021 (USD MILLION)
TABLE 215 JAPAN: MARKET, BY ORGANIZATION SIZE, 2022–2027 (USD MILLION)
10.4.6 SINGAPORE
TABLE 216 SINGAPORE: PROJECT PORTFOLIO MANAGEMENT MARKET, BY COMPONENT, 2017–2021 (USD MILLION)
TABLE 217 SINGAPORE: MARKET, BY COMPONENT, 2022–2027 (USD MILLION)
TABLE 218 SINGAPORE: MARKET, BY SERVICE, 2017–2021 (USD MILLION)
TABLE 219 SINGAPORE: MARKET, BY SERVICE, 2022–2027 (USD MILLION)
TABLE 220 SINGAPORE: MARKET, BY DEPLOYMENT MODE, 2017–2021 (USD MILLION)
TABLE 221 SINGAPORE: MARKET, BY DEPLOYMENT MODE, 2022–2027 (USD MILLION)
TABLE 222 SINGAPORE: MARKET, BY ORGANIZATION SIZE, 2017–2021 (USD MILLION)
TABLE 223 SINGAPORE: MARKET, BY ORGANIZATION SIZE, 2022–2027 (USD MILLION)
10.4.7 REST OF ASIA PACIFIC
TABLE 224 REST OF ASIA PACIFIC: PROJECT PORTFOLIO MANAGEMENT MARKET, BY COMPONENT, 2017–2021 (USD MILLION)
TABLE 225 REST OF ASIA PACIFIC: MARKET, BY COMPONENT, 2022–2027 (USD MILLION)
TABLE 226 REST OF ASIA PACIFIC: MARKET, BY SERVICE, 2017–2021 (USD MILLION)
TABLE 227 REST OF ASIA PACIFIC: MARKET, BY SERVICE, 2022–2027 (USD MILLION)
TABLE 228 REST OF ASIA PACIFIC: MARKET, BY DEPLOYMENT MODE, 2017–2021 (USD MILLION)
TABLE 229 REST OF ASIA PACIFIC: MARKET, BY DEPLOYMENT MODE, 2022–2027 (USD MILLION)
TABLE 230 REST OF ASIA PACIFIC: MARKET, BY ORGANIZATION SIZE, 2017–2021 (USD MILLION)
TABLE 231 REST OF ASIA PACIFIC: PROJECT PORTFOLIO MANAGEMENT MARKE, BY ORGANIZATION SIZE, 2022–2027 (USD MILLION)
10.5 MIDDLE EAST & AFRICA
10.5.1 MIDDLE EAST & AFRICA: PROJECT PORTFOLIO MANAGEMENT MARKET DRIVERS
10.5.2 MIDDLE EAST & AFRICA: COVID 19 IMPACT
TABLE 232 MIDDLE EAST & AFRICA: MARKET, BY COMPONENT, 2017–2021 (USD MILLION)
TABLE 233 MIDDLE EAST & AFRICA: MARKET, BY COMPONENT, 2022–2027 (USD MILLION)
TABLE 234 MIDDLE EAST & AFRICA: PROJECT PORTFOLIO MANAGEMENT SOLUTION MARKET, BY COUNTRY, 2017–2021 (USD MILLION)
TABLE 235 MIDDLE EAST & AFRICA: PROJECT PORTFOLIO MANAGEMENT SOLUTION MARKET, BY COUNTRY, 2022–2027 (USD MILLION)
TABLE 236 MIDDLE EAST & AFRICA: PROJECT PORTFOLIO MANAGEMENT SERVICES MARKET, BY COUNTRY, 2017–2021 (USD MILLION)
TABLE 237 MIDDLE EAST & AFRICA: PROJECT PORTFOLIO MANAGEMENT SERVICES MARKET, BY COUNTRY, 2022–2027 (USD MILLION)
TABLE 238 MIDDLE EAST & AFRICA: MARKET, BY SERVICE, 2017–2021 (USD MILLION)
TABLE 239 MIDDLE EAST & AFRICA: MARKET, BY SERVICE, 2022–2027 (USD MILLION)
TABLE 240 MIDDLE EAST & AFRICA: PROJECT PORTFOLIO MANAGEMENT CONSULTING AND IMPLEMENTATION MARKET, BY COUNTRY, 2017–2021 (USD MILLION)
TABLE 241 MIDDLE EAST & AFRICA: PROJECT PORTFOLIO MANAGEMENT CONSULTING AND IMPLEMENTATION MARKET, BY COUNTRY, 2022–2027 (USD MILLION)
TABLE 242 MIDDLE EAST & AFRICA: PROJECT PORTFOLIO MANAGEMENT TRAINING, SUPPORT, AND MAINTENANCE MARKET, BY COUNTRY, 2017–2021 (USD MILLION)
TABLE 243 MIDDLE EAST & AFRICA: PROJECT PORTFOLIO MANAGEMENT TRAINING, SUPPORT, AND MAINTENANCE MARKET, BY COUNTRY, 2022–2027 (USD MILLION)
TABLE 244 MIDDLE EAST & AFRICA: PROJECT PORTFOLIO MANAGEMENT MARKET, BY ORGANIZATION SIZE, 2017–2021 (USD MILLION)
TABLE 245 MIDDLE EAST & AFRICA: MARKET, BY ORGANIZATION SIZE, 2022–2027 (USD MILLION)
TABLE 246 MIDDLE EAST & AFRICA: PROJECT PORTFOLIO MANAGEMENT SMALL AND MEDIUM-SIZED ENTERPRISES MARKET, BY COUNTRY, 2017–2021 (USD MILLION)
TABLE 247 MIDDLE EAST & AFRICA: PROJECT PORTFOLIO MANAGEMENT SMALL AND MEDIUM-SIZED ENTERPRISES MARKET, BY COUNTRY, 2022–2027 (USD MILLION)
TABLE 248 MIDDLE EAST & AFRICA: PROJECT PORTFOLIO MANAGEMENT LARGE ENTERPRISES MARKET, BY COUNTRY, 2017–2021 (USD MILLION)
TABLE 249 MIDDLE EAST & AFRICA: PROJECT PORTFOLIO MANAGEMENT LARGE ENTERPRISES MARKET, BY COUNTRY, 2022–2027 (USD MILLION)
TABLE 250 MIDDLE EAST & AFRICA: MARKET, BY DEPLOYMENT MODE, 2017–2021 (USD MILLION)
TABLE 251 MIDDLE EAST & AFRICA: MARKET, BY DEPLOYMENT MODE, 2022–2027 (USD MILLION)
TABLE 252 MIDDLE EAST & AFRICA: PROJECT PORTFOLIO MANAGEMENT CLOUD MARKET, BY COUNTRY, 2017–2021 (USD MILLION)
TABLE 253 MIDDLE EAST & AFRICA: PROJECT PORTFOLIO MANAGEMENT CLOUD MARKET, BY COUNTRY, 2022–2027 (USD MILLION)
TABLE 254 MIDDLE EAST & AFRICA: PROJECT PORTFOLIO MANAGEMENT ON-PREMISES MARKET, BY COUNTRY, 2017–2021 (USD MILLION)
TABLE 255 MIDDLE EAST & AFRICA: PROJECT PORTFOLIO MANAGEMENT ON-PREMISES MARKET, BY COUNTRY, 2022–2027 (USD MILLION)
TABLE 256 MIDDLE EAST & AFRICA: MARKET, BY VERTICAL, 2017–2021 (USD MILLION)
TABLE 257 MIDDLE EAST & AFRICA: MARKET, BY VERTICAL, 2022–2027 (USD MILLION)
TABLE 258 MIDDLE EAST & AFRICA: MARKET, BY COUNTRY, 2017–2021 (USD MILLION)
TABLE 259 MIDDLE EAST & AFRICA: MARKET, BY COUNTRY, 2022–2027 (USD MILLION)
10.5.3 KINGDOM OF SAUDI ARABIA
TABLE 260 KINGDOM OF SAUDI ARABIA: PROJECT PORTFOLIO MANAGEMENT MARKET, BY COMPONENT, 2017–2021 (USD MILLION)
TABLE 261 KINGDOM OF SAUDI ARABIA: MARKET, BY COMPONENT, 2022–2027 (USD MILLION)
TABLE 262 KINGDOM OF SAUDI ARABIA: MARKET, BY SERVICE, 2017–2021 (USD MILLION)
TABLE 263 KINGDOM OF SAUDI ARABIA: MARKET, BY SERVICE, 2022–2027 (USD MILLION)
TABLE 264 KINGDOM OF SAUDI ARABIA: MARKET, BY DEPLOYMENT MODE, 2017–2021 (USD MILLION)
TABLE 265 KINGDOM OF SAUDI ARABIA: MARKET, BY DEPLOYMENT MODE, 2022–2027 (USD MILLION)
TABLE 266 KINGDOM OF SAUDI ARABIA: MARKET, BY ORGANIZATION SIZE, 2017–2021 (USD MILLION)
TABLE 267 KINGDOM OF SAUDI ARABIA: MARKET, BY ORGANIZATION SIZE, 2022–2027 (USD MILLION)
10.5.4 SOUTH AFRICA
TABLE 268 SOUTH AFRICA: PROJECT PORTFOLIO MANAGEMENT MARKET, BY COMPONENT, 2017–2021 (USD MILLION)
TABLE 269 SOUTH AFRICA: MARKET, BY COMPONENT, 2022–2027 (USD MILLION)
TABLE 270 SOUTH AFRICA: MARKET, BY SERVICE, 2017–2021 (USD MILLION)
TABLE 271 SOUTH AFRICA: MARKET, BY SERVICE, 2022–2027 (USD MILLION)
TABLE 272 SOUTH AFRICA: MARKET, BY DEPLOYMENT MODE, 2017–2021 (USD MILLION)
TABLE 273 SOUTH AFRICA: MARKET, BY DEPLOYMENT MODE, 2022–2027 (USD MILLION)
TABLE 274 SOUTH AFRICA: MARKET, BY ORGANIZATION SIZE, 2017–2021 (USD MILLION)
TABLE 275 SOUTH AFRICA: MARKET, BY ORGANIZATION SIZE, 2022–2027 (USD MILLION)
10.5.5 UNITED ARAB EMIRATES
TABLE 276 UNITED ARAB EMIRATES: PROJECT PORTFOLIO MANAGEMENT MARKET, BY COMPONENT, 2017–2021 (USD MILLION)
TABLE 277 UNITED ARAB EMIRATES: MARKET, BY COMPONENT, 2022–2027 (USD MILLION)
TABLE 278 UNITED ARAB EMIRATES: MARKET, BY SERVICE, 2017–2021 (USD MILLION)
TABLE 279 UNITED ARAB EMIRATES: MARKET, BY SERVICE, 2022–2027 (USD MILLION)
TABLE 280 UNITED ARAB EMIRATES: MARKET, BY DEPLOYMENT MODE, 2017–2021 (USD MILLION)
TABLE 281 UNITED ARAB EMIRATES: MARKET, BY DEPLOYMENT MODE, 2022–2027 (USD MILLION)
TABLE 282 UNITED ARAB EMIRATES: MARKET, BY ORGANIZATION SIZE, 2017–2021 (USD MILLION)
TABLE 283 UNITED ARAB EMIRATES: MARKET, BY ORGANIZATION SIZE, 2022–2027 (USD MILLION)
10.5.6 REST OF MIDDLE EAST & AFRICA
TABLE 284 REST OF MIDDLE EAST & AFRICA: PROJECT PORTFOLIO MANAGEMENT MARKET, BY COMPONENT, 2017–2021 (USD MILLION)
TABLE 285 REST OF MIDDLE EAST & AFRICA: MARKET, BY COMPONENT, 2022–2027 (USD MILLION)
TABLE 286 REST OF MIDDLE EAST & AFRICA: MARKET, BY SERVICE, 2017–2021 (USD MILLION)
TABLE 287 REST OF MIDDLE EAST & AFRICA: MARKET, BY SERVICE, 2022–2027 (USD MILLION)
TABLE 288 REST OF MIDDLE EAST & AFRICA: MARKET, BY DEPLOYMENT MODE, 2017–2021 (USD MILLION)
TABLE 289 REST OF MIDDLE EAST & AFRICA: MARKET, BY DEPLOYMENT MODE, 2022–2027 (USD MILLION)
TABLE 290 REST OF MIDDLE EAST & AFRICA: MARKET, BY ORGANIZATION SIZE, 2017–2021 (USD MILLION)
TABLE 291 REST OF MIDDLE EAST & AFRICA: MARKET, BY ORGANIZATION SIZE, 2022–2027 (USD MILLION)
10.6 LATIN AMERICA
10.6.1 LATIN AMERICA: PROJECT PORTFOLIO MANAGEMENT MARKET DRIVERS
10.6.2 LATIN AMERICA: COVID 19 IMPACT
TABLE 292 LATIN AMERICA: MARKET, BY COMPONENT, 2017–2021 (USD MILLION)
TABLE 293 LATIN AMERICA: MARKET, BY COMPONENT, 2022–2027 (USD MILLION)
TABLE 294 LATIN AMERICA: PROJECT PORTFOLIO MANAGEMENT SOLUTION MARKET, BY COUNTRY, 2017–2021 (USD MILLION)
TABLE 295 LATIN AMERICA: PROJECT PORTFOLIO MANAGEMENT SOLUTION MARKET, BY COUNTRY, 2022–2027 (USD MILLION)
TABLE 296 LATIN AMERICA: PROJECT PORTFOLIO MANAGEMENT SERVICES MARKET, BY COUNTRY, 2017–2021 (USD MILLION)
TABLE 297 LATIN AMERICA: PROJECT PORTFOLIO MANAGEMENT SERVICES MARKET, BY COUNTRY, 2022–2027 (USD MILLION)
TABLE 298 LATIN AMERICA: MARKET, BY SERVICE, 2017–2021 (USD MILLION)
TABLE 299 LATIN AMERICA: MARKET, BY SERVICE, 2022–2027 (USD MILLION)
TABLE 300 LATIN AMERICA: PROJECT PORTFOLIO MANAGEMENT CONSULTING AND IMPLEMENTATION MARKET, BY COUNTRY, 2017–2021 (USD MILLION)
TABLE 301 LATIN AMERICA: PROJECT PORTFOLIO MANAGEMENT CONSULTING AND IMPLEMENTATION MARKET, BY COUNTRY, 2022–2027 (USD MILLION)
TABLE 302 LATIN AMERICA: PROJECT PORTFOLIO MANAGEMENT TRAINING, SUPPORT, AND MAINTENANCE MARKET, BY COUNTRY, 2017–2021 (USD MILLION)
TABLE 303 LATIN AMERICA: PROJECT PORTFOLIO MANAGEMENT TRAINING, SUPPORT, AND MAINTENANCE MARKET, BY COUNTRY, 2022–2027 (USD MILLION)
TABLE 304 LATIN AMERICA: PROJECT PORTFOLIO MANAGEMENT MARKET, BY ORGANIZATION SIZE, 2017–2021 (USD MILLION)
TABLE 305 LATIN AMERICA: MARKET, BY ORGANIZATION SIZE, 2022–2027 (USD MILLION)
TABLE 306 LATIN AMERICA: PROJECT PORTFOLIO MANAGEMENT SMALL AND MEDIUM-SIZED ENTERPRISES MARKET, BY COUNTRY, 2017–2021 (USD MILLION)
TABLE 307 LATIN AMERICA: PROJECT PORTFOLIO MANAGEMENT SMALL AND MEDIUM-SIZED ENTERPRISES MARKET, BY COUNTRY, 2022–2027 (USD MILLION)
TABLE 308 LATIN AMERICA: PROJECT PORTFOLIO MANAGEMENT LARGE ENTERPRISES MARKET, BY COUNTRY, 2017–2021 (USD MILLION)
TABLE 309 LATIN AMERICA: PROJECT PORTFOLIO MANAGEMENT LARGE ENTERPRISES MARKET, BY COUNTRY, 2022–2027 (USD MILLION)
TABLE 310 LATIN AMERICA: MARKET, BY DEPLOYMENT MODE, 2017–2021 (USD MILLION)
TABLE 311 LATIN AMERICA: MARKET, BY DEPLOYMENT MODE, 2022–2027 (USD MILLION)
TABLE 312 LATIN AMERICA: PROJECT PORTFOLIO MANAGEMENT CLOUD MARKET, BY COUNTRY, 2017–2021 (USD MILLION)
TABLE 313 LATIN AMERICA: PROJECT PORTFOLIO MANAGEMENT CLOUD MARKET, BY COUNTRY, 2022–2027 (USD MILLION)
TABLE 314 LATIN AMERICA: PROJECT PORTFOLIO MANAGEMENT ON-PREMISES MARKET, BY COUNTRY, 2017–2021 (USD MILLION)
TABLE 315 LATIN AMERICA: PROJECT PORTFOLIO MANAGEMENT ON-PREMISES MARKET, BY COUNTRY, 2022–2027 (USD MILLION)
TABLE 316 LATIN AMERICA: MARKET, BY VERTICAL, 2017–2021 (USD MILLION)
TABLE 317 LATIN AMERICA: MARKET, BY VERTICAL, 2022–2027 (USD MILLION)
TABLE 318 LATIN AMERICA: MARKET, BY COUNTRY, 2017–2021 (USD MILLION)
TABLE 319 LATIN AMERICA: MARKET, BY COUNTRY, 2022–2027 (USD MILLION)
10.6.3 BRAZIL
TABLE 320 BRAZIL: PROJECT PORTFOLIO MANAGEMENT MARKET, BY COMPONENT, 2017–2021 (USD MILLION)
TABLE 321 BRAZIL: MARKET, BY COMPONENT, 2022–2027 (USD MILLION)
TABLE 322 BRAZIL: MARKET, BY SERVICE, 2017–2021 (USD MILLION)
TABLE 323 BRAZIL: MARKET, BY SERVICE, 2022–2027 (USD MILLION)
TABLE 324 BRAZIL: MARKET, BY DEPLOYMENT MODE, 2017–2021 (USD MILLION)
TABLE 325 BRAZIL: MARKET, BY DEPLOYMENT MODE, 2022–2027 (USD MILLION)
TABLE 326 BRAZIL: MARKET, BY ORGANIZATION SIZE, 2017–2021 (USD MILLION)
TABLE 327 BRAZIL: MARKET, BY ORGANIZATION SIZE, 2022–2027 (USD MILLION)
10.6.4 MEXICO
TABLE 328 MEXICO: PROJECT PORTFOLIO MANAGEMENT MARKET, BY COMPONENT, 2017–2021 (USD MILLION)
TABLE 329 MEXICO: MARKET, BY COMPONENT, 2022–2027 (USD MILLION)
TABLE 330 MEXICO: MARKET, BY SERVICE, 2017–2021 (USD MILLION)
TABLE 331 MEXICO: MARKET, BY SERVICE, 2022–2027 (USD MILLION)
TABLE 332 MEXICO: MARKET, BY DEPLOYMENT MODE, 2017–2021 (USD MILLION)
TABLE 333 MEXICO: MARKET, BY DEPLOYMENT MODE, 2022–2027 (USD MILLION)
TABLE 334 MEXICO: MARKET, BY ORGANIZATION SIZE, 2017–2021 (USD MILLION)
TABLE 335 MEXICO: MARKET, BY ORGANIZATION SIZE, 2022–2027 (USD MILLION)
10.6.5 REST OF LATIN AMERICA
TABLE 336 REST OF LATIN AMERICA: PROJECT PORTFOLIO MANAGEMENT MARKET, BY COMPONENT, 2017–2021 (USD MILLION)
TABLE 337 REST OF LATIN AMERICA: MARKET, BY COMPONENT, 2022–2027 (USD MILLION)
TABLE 338 REST OF LATIN AMERICA: MARKET, BY SERVICE, 2017–2021 (USD MILLION)
TABLE 339 REST OF LATIN AMERICA: MARKET, BY SERVICE, 2022–2027 (USD MILLION)
TABLE 340 REST OF LATIN AMERICA: MARKET, BY DEPLOYMENT MODE, 2017–2021 (USD MILLION)
TABLE 341 REST OF LATIN AMERICA: MARKET, BY DEPLOYMENT MODE, 2022–2027 (USD MILLION)
TABLE 342 REST OF LATIN AMERICA: MARKET, BY ORGANIZATION SIZE, 2017–2021 (USD MILLION)
TABLE 343 REST OF LATIN AMERICA: MARKET, BY ORGANIZATION SIZE, 2022–2027 (USD MILLION)
11 COMPETITIVE LANDSCAPE (Page No. - 208)
11.1 INTRODUCTION
FIGURE 44 MARKET EVALUATION FRAMEWORK
11.2 KEY PLAYER STRATEGIES/RIGHT TO WIN
11.2.1 OVERVIEW OF STRATEGIES ADOPTED BY KEY PROJECT PORTFOLIO MANAGEMENT VENDORS
11.3 MARKET RANKING
FIGURE 45 MARKET RANKING IN 2021
11.4 MARKET SHARE OF TOP VENDORS
TABLE 344 PROJECT PORTFOLIO MANAGEMENT: DEGREE OF COMPETITION
FIGURE 46 PROJECT PORTFOLIO MANAGEMENT MARKET: VENDOR SHARE ANALYSIS
11.5 HISTORICAL REVENUE ANALYSIS OF TOP VENDORS
FIGURE 47 HISTORICAL REVENUE ANALYSIS
11.6 COMPANY EVALUATION QUADRANT
FIGURE 48 COMPANY EVALUATION MATRIX: CRITERIA WEIGHTAGE
11.6.1 STAR
11.6.2 EMERGING LEADER
11.6.3 PERVASIVE
11.6.4 PARTICIPANT
FIGURE 49 PROJECT PORTFOLIO MANAGEMENT MARKET (GLOBAL): COMPANY EVALUATION QUADRANT
11.7 COMPETITIVE SCENARIO
TABLE 345 MARKET: NEW LAUNCHES, 2019–2022
TABLE 346 MARKET: DEALS, 2019–2022
TABLE 347 MARKET: OTHERS, 2019–2020
12 COMPANY PROFILES (Page No. - 220)
12.1 INTRODUCTION
12.2 KYE PLAYERS
(Business Overview, Solutions, Products & Services, Recent Developments, MnM View)*
12.2.1 ORACLE
TABLE 348 ORACLE: BUSINESS OVERVIEW
FIGURE 50 ORACLE: COMPANY SNAPSHOT
TABLE 349 ORACLE: SOLUTIONS OFFERED
TABLE 350 ORACLE: SERVICES OFFERED
TABLE 351 ORACLE: PROJECT PORTFOLIO MANAGEMENT: SERVICE LAUNCHES
TABLE 352 ORACLE: PROJECT PORTFOLIO MANAGEMENT: DEALS
TABLE 353 ORACLE: PROJECT PORTFOLIO MANAGEMENT: OTHERS
12.2.2 PLANVIEW
TABLE 354 PLANVIEW: BUSINESS OVERVIEW
TABLE 355 PLANVIEW: SOLUTIONS OFFERED
TABLE 356 PLANVIEW: PROJECT PORTFOLIO MANAGEMENT: PRODUCT LAUNCHES
TABLE 357 PLANVIEW: PROJECT PORTFOLIO MANAGEMENT: DEALS
12.2.3 BROADCOM
TABLE 358 BROADCOM: BUSINESS OVERVIEW
FIGURE 51 BROADCOM: SNAPSHOT
TABLE 359 BROADCOM: SOLUTIONS OFFERED
TABLE 360 BROADCOM: PROJECT PORTFOLIO MANAGEMENT: PRODUCT LAUNCHES
TABLE 361 BROADCOM: PROJECT PORTFOLIO MANAGEMENT: DEALS
12.2.4 SAP
TABLE 362 SAP: BUSINESS OVERVIEW
FIGURE 52 SAP: SNAPSHOT
TABLE 363 SAP: SOLUTIONS OFFERED
TABLE 364 SAP: PROJECT PORTFOLIO MANAGEMENT: PRODUCT LAUNCHES
TABLE 365 SAP: PROJECT PORTFOLIO MANAGEMENT: DEALS
TABLE 366 SAP: PROJECT PORTFOLIO MANAGEMENT: OTHERS
12.2.5 MICROSOFT
TABLE 367 MICROSOFT: BUSINESS OVERVIEW
FIGURE 53 MICROSOFT: SNAPSHOT
TABLE 368 MICROSOFT: SOLUTIONS OFFERED
TABLE 369 MICROSOFT: PROJECT PORTFOLIO MANAGEMENT: OTHERS
12.2.6 WORKFRONT
TABLE 370 WORKFRONT: BUSINESS OVERVIEW
TABLE 371 WORKFRONT: SOLUTIONS OFFERED
TABLE 372 WORKFRONT: PROJECT PORTFOLIO MANAGEMENT: DEALS
TABLE 373 WORKFRONT: PROJECT PORTFOLIO MANAGEMENT: OTHERS
12.2.7 HEXAGON
TABLE 374 HEXAGON: BUSINESS OVERVIEW
FIGURE 54 HEXAGON: SNAPSHOT
TABLE 375 HEXAGON: SOLUTIONS OFFERED
TABLE 376 HEXAGON: SERVICES OFFERED
TABLE 377 HEXAGON: PROJECT PORTFOLIO MANAGEMENT: PRODUCT LAUNCHES
TABLE 378 HEXAGON: PROJECT PORTFOLIO MANAGEMENT: DEALS
12.2.8 SERVICENOW
TABLE 379 SERVICENOW: BUSINESS OVERVIEW
FIGURE 55 SERVICENOW: SNAPSHOT
TABLE 380 SERVICENOW: SOLUTIONS OFFERED
TABLE 381 SERVICENOW: PROJECT PORTFOLIO MANAGEMENT: PRODUCT LAUNCHES
TABLE 382 SERVICENOW: PROJECT PORTFOLIO MANAGEMENT: DEALS
TABLE 383 SERVICENOW: PROJECT PORTFOLIO MANAGEMENT: OTHERS
12.2.9 UPLAND SOFTWARE
TABLE 384 UPLAND SOFTWARE: BUSINESS OVERVIEW
FIGURE 56 UPLAND SOFTWARE: SNAPSHOT
TABLE 385 UPLAND SOFTWARE: SOLUTIONS OFFERED
TABLE 386 UPLAND SOFTWARE: PROJECT PORTFOLIO MANAGEMENT: PRODUCT LAUNCHES
TABLE 387 UPLAND SOFTWARE: PROJECT PORTFOLIO MANAGEMENT: DEALS
*Details on Business Overview, Solutions, Products & Services, Recent Developments, MnM View might not be captured in case of unlisted companies.
12.2.10 MICRO FOCUS
12.2.11 PLANISWARE
12.2.12 SCIFORMA
12.2.13 SOPHEON
12.2.14 CERRI
12.2.15 KEYEDIN PROJECTS
12.2.16 ONE2TEAM
12.2.17 ONEPOINT PROJECTS
12.2.18 MEISTERPLAN
12.2.19 INTELIT SMART GROUP
12.2.20 BESTOUTCOME
12.2.21 PROJECT OBJECTS
12.2.22 WORKOTTER
12.2.23 SMARTSHEET
12.2.24 CELOXIS
12.2.25 WRIKE
12.2.26 ASANA
12.2.27 MONDAY.COM
12.2.28 CHERWELL
13 ADJACENT & RELATED MARKETS (Page No. - 263)
13.1 INTRODUCTION
13.2 LIMITATIONS
13.3 PROJECT PORTFOLIO MANAGEMENT ECOSYSTEM AND INTERCONNECTED MARKETS
13.4 CLOUD PROJECT PORTFOLIO MANAGEMENT MARKET
13.4.1 MARKET DEFINITION
13.4.2 MARKET OVERVIEW
TABLE 388 PROJECT MANAGEMENT: CLOUD MARKET SIZE, BY REGION, 2015–2022 (USD MILLION)
TABLE 389 PORTFOLIO MANAGEMENT: CLOUD MARKET SIZE, BY REGION, 2015–2022 (USD MILLION)
TABLE 390 DEMAND MANAGEMENT: CLOUD MARKET SIZE, BY REGION, 2015–2022 (USD MILLION)
TABLE 391 RESOURCE MANAGEMENT: CLOUD MARKET SIZE, BY REGION, 2015–2022 (USD MILLION)
TABLE 392 FINANCIAL MANAGEMENT: CLOUD MARKET SIZE, BY REGION, 2015–2022 (USD MILLION)
TABLE 393 OTHER APPLICATION: CLOUD MARKET SIZE, BY REGION, 2015–2022 (USD MILLION)
TABLE 394 BANKING, FINANCIAL SERVICES, AND INSURANCE: CLOUD MARKET SIZE, BY REGION, 2015–2022 (USD MILLION)
TABLE 395 HEALTHCARE AND LIFE SCIENCES: CLOUD MARKET SIZE, BY REGION, 2015–2022 (USD MILLION)
TABLE 396 TELECOMMUNICATION AND ITES: CLOUD MARKET SIZE, BY REGION, 2015–2022 (USD MILLION)
TABLE 397 MANUFACTURING: CLOUD MARKET SIZE, BY REGION, 2015–2022 (USD MILLION)
TABLE 398 GOVERNMENT AND PUBLIC SECTOR: CLOUD PROJECT PORTFOLIO MANAGEMENT MARKET SIZE, BY REGION, 2015–2022 (USD MILLION)
TABLE 399 RETAIL AND CONSUMER GOODS: CLOUD MARKET SIZE, BY REGION, 2015–2022 (USD MILLION)
TABLE 400 OTHERS: CLOUD MARKET SIZE, BY REGION, 2015–2022 (USD MILLION)
TABLE 401 NORTH AMERICA: CLOUD MARKET SIZE, BY APPLICATION, 2015–2022 (USD MILLION)
TABLE 402 NORTH AMERICA: CLOUD MARKET SIZE, BY VERTICAL, 2015–2022 (USD MILLION)
TABLE 403 NORTH AMERICA: CLOUD MARKET SIZE, BY COUNTRY, 2015–2022 (USD MILLION)
TABLE 404 UNITED STATES: CLOUD MARKET SIZE, BY APPLICATION, 2015–2022 (USD MILLION)
TABLE 405 UNITED STATES: CLOUD MARKET SIZE, BY VERTICAL, 2015–2022 (USD MILLION)
13.5 APAC MARKET
13.5.1 MARKET DEFINITION
13.5.2 MARKET SCOPE
TABLE 406 APAC PROJECT PORTFOLIO MANAGEMENT MARKET SIZE, BY SERVICE, 2015–2022 (USD MILLION)
TABLE 407 INTEGRATION AND DEPLOYMENT: APAC MARKET SIZE, BY COUNTRY, 2015–2022 (USD MILLION)
TABLE 408 APAC MARKET SIZE, BY APPLICATION, 2015–2022 (USD MILLION)
TABLE 409 PROJECT MANAGEMENT: APAC MARKET SIZE, BY COUNTRY, 2015–2022 (USD MILLION)
TABLE 410 APAC MARKET SIZE, BY DEPLOYMENT TYPE, 2015–2022 (USD MILLION)
TABLE 411 APAC MARKET SIZE, BY VERTICAL, 2015–2022 (USD MILLION)
TABLE 412 CHINA: APAC MARKET SIZE, BY TYPE, 2015–2022 (USD MILLION)
TABLE 413 CHINA: APAC MARKET SIZE, BY APPLICATION, 2015–2022 (USD MILLION)
TABLE 414 CHINA: APAC MARKET SIZE, BY DEPLOYMENT TYPE, 2015–2022(USD MILLION)
14 APPENDIX (Page No. - 275)
14.1 DISCUSSION GUIDE
14.2 KNOWLEDGE STORE: MARKETSANDMARKETS’ SUBSCRIPTION PORTAL
14.3 AVAILABLE CUSTOMIZATIONS
14.3.1 SOUTH KOREA PROJECT PORTFOLIO MANAGEMENT MARKET DATA TABLES
TABLE 415 SOUTH KOREA: MARKET, BY COMPONENT, 2017–2021 (USD MILLION)
TABLE 416 SOUTH KOREA: MARKET, BY COMPONENT, 2022–2027 (USD MILLION)
TABLE 417 SOUTH KOREA: MARKET, BY DEPLOYMENT MODE, 2017–2021 (USD MILLION)
TABLE 418 SOUTH KOREA: MARKET, BY DEPLOYMENT MODE, 2022–2027 (USD MILLION)
TABLE 419 SOUTH KOREA: MARKET, BY ORGANIZATION SIZE, 2017–2021 (USD MILLION)
TABLE 420 SOUTH KOREA: PROJECT PORTFOLIO MANAGEMENT MARKE, BY ORGANIZATION SIZE, 2022–2027 (USD MILLION)
14.4 RELATED REPORTS
14.5 AUTHOR DETAILS
The study involved 4 major activities to estimate the current market size of Project Portfolio Management market. Exhaustive secondary research was done to collect information on the market, the peer market, and the parent market. The next step was to validate these findings, assumptions, and sizing with industry experts across the value chain through primary research. Both top-down and bottom-up approaches were employed to estimate the complete market size. After that, the market breakup and data triangulation procedures were used to estimate the market size of the segments and subsegments.
Secondary Research
The market size of companies offering project portfolio management solutions was derived on the basis of the secondary data available through paid and unpaid sources and by analyzing the product portfolios of major companies in the ecosystem and rating the companies based on their solution capabilities and business strategies. In the secondary research process, various sources were referred to for identifying and collecting information for the study. Secondary sources included annual reports, press releases, and investor presentations of companies and product data sheets; white papers; journals; certified publications; and articles from recognized authors, government websites, directories, and databases. Secondary research was used to obtain key information about the industry’s supply chain, the total pool of key players, market classification and segmentation according to industry trends to the bottom-most level, regional markets, and key developments from both market and technology oriented perspectives; all of which were further validated by primary sources.
Primary Research
In the primary research process, various primary sources from both the supply and demand sides were interviewed to obtain qualitative and quantitative information on the market. The primary sources from the supply side included various industry experts, including Chief Experience Officers (CXOs); Vice Presidents (VPs); directors from business development, marketing, and product development/innovation teams; related key executives from PPM vendors, industry associations, and independent consultants; and key opinion leaders.
Primary interviews were conducted to gather insights, such as market statistics, latest trends disrupting the market, new use cases implemented, data of revenue collected from products and services, market breakups, market size estimations, market forecasts, and data triangulation. Primary research also helped in understanding various trends related to technology and region. Demand-side stakeholders, such as Chief Information Officers (CIOs), Chief Technology Officers (CTOs), Chief Security Officers (CSOs), the installation teams of end users using PPM solution, and digital initiatives project teams, were interviewed to understand the buyer’s perspective on suppliers, products, service providers, and their current use of PPM solution, which would affect the overall PPM market.
The following figure depicts the breakup of the primary profiles:
To know about the assumptions considered for the study, download the pdf brochure
Market Size Estimation
The top-down and bottom-up approaches were used to estimate and validate the size of the project portfolio management market and various other dependent subsegments. The research methodology used to estimate the market size included the following:
- Key players in the market were identified through secondary research, and their revenue contributions in respective countries were determined through primary and secondary research.
- This entire procedure included the study of the annual and financial reports of top market players and extensive interviews for key insights from industry leaders, such as Chief Executive Officers (CEOs), VPs, directors, and marketing executives.
- All percentage splits and breakups were determined using secondary sources and verified through primary sources.
Data Triangulation
After arriving at the overall market size—using the market size estimation processes as explained above—the market was split into several segments and subsegments. To complete the overall market engineering process and arrive at the exact statistics of each market segment and subsegment, the data triangulation and market breakup procedures were employed, wherever applicable. The data was triangulated by studying several factors and trends from both, the demand and supply sides, in the project portfolio management market.
Report Objectives
- To describe and forecast the global project portfolio management market based on component, deployment mode, organization size, vertical and region
- To forecast the market size of regional segments: North America, Europe, Asia Pacific (APAC), Middle East and Africa (MEA), and Latin America
- To strategically analyze the market’s subsegments with respect to individual growth trends, prospects, and contributions to the total market
- To provide detailed information related to major factors (drivers, restraints, opportunities, and challenges) influencing the growth of the market
- To analyze opportunities in the market for stakeholders and provide details of the competitive landscape for major players
- To comprehensively analyze the core competencies of key players
- To track and analyze COVID-19 impact and competitive developments, such as mergers and acquisitions, new product developments, and partnerships and collaborations, in the market.
PPM Market:
PPM Market is also known as Project Portfolio Management Market. The PPM Market has a significant impact on businesses of all sizes and industries. PPM software tools and services are designed to help organizations manage their project portfolios more effectively, which can lead to a range of benefits as follows
- Improved Decision Making: PPM software tools provide a centralized view of project data and enable organizations to analyze and prioritize projects based on their strategic objectives. This helps businesses to make more informed decisions about which projects to pursue and how to allocate resources.
- Increased Productivity: PPM software tools can help businesses to optimize their resource allocation, which can increase productivity and improve project outcomes. By ensuring that resources are allocated effectively, businesses can complete projects more quickly and with fewer errors.
- Better Risk Management: PPM software tools enable businesses to track progress and manage risks more effectively. This helps businesses to identify potential issues early on and to take corrective action before they become bigger problems.
- Enhanced Collaboration: PPM software tools enable team members to collaborate more effectively, which can improve communication and increase efficiency. By providing a centralized view of project data, PPM software tools can help team members to work more closely together and to share information more easily.
- Increased Agility: PPM software tools are evolving to support agile and DevOps practices, which are becoming more popular in software development and IT operations. By enabling businesses to manage their agile and DevOps projects more effectively, PPM software tools can help businesses to be more agile and responsive to changing market conditions.
Overall, the PPM market is having a significant impact on businesses of all sizes and industries. By providing a centralized view of project data and enabling businesses to manage their project portfolios more effectively, PPM software tools are helping businesses to improve decision making, increase productivity, and enhance collaboration.
Futuristic growth use-cases of PPM Market:
- Artificial Intelligence (AI) and Machine Learning: The use of AI and machine learning algorithms in PPM software tools can help organizations to make more informed decisions about project portfolios. By analyzing historical data and identifying patterns, AI and machine learning algorithms can help businesses to optimize their project portfolios and allocate resources more effectively.
- Internet of Things (IoT): The IoT is expected to have a significant impact on the PPM market. By integrating IoT devices with PPM software tools, businesses can track project progress in real-time and make data-driven decisions about resource allocation.
- Blockchain: Blockchain technology can help businesses to track project data and ensure that it is secure and tamper-proof. By integrating blockchain technology with PPM software tools, businesses can improve data integrity and reduce the risk of fraud.
- Virtual and Augmented Reality: Virtual and augmented reality technologies can help businesses to visualize project data and make better decisions about resource allocation. By creating immersive environments that simulate project scenarios, businesses can test different project portfolio strategies and identify the most effective approach.
- Cloud-Based PPM: Cloud-based PPM solutions are becoming more popular, as businesses look for more flexible and scalable solutions. Cloud-based PPM solutions can be accessed from anywhere, at any time, which can improve collaboration and increase productivity.
Overall, the PPM market is expected to continue to grow and evolve, as businesses look for better ways to manage their project portfolios and achieve their strategic objectives. By adopting new technologies and trends, businesses can improve decision making, increase productivity, and enhance collaboration.
Some of the top companies in PPM Market are Microsoft Corporation, Oracle Corporation, SAP SE, Planview Inc., Broadcom, Workfront, Clarizen, Inc., Planisware S.A., Sciforma Corporation Wrike, Inc.
Industries Getting Impacted in the future by PPM Market:
- IT: The IT industry is one of the largest users of PPM solutions is expected to continue to adopt new PPM technologies and tools. IT departments can use PPM solutions to manage complex projects, allocate resources effectively, and improve collaboration.
- Healthcare: The healthcare industry is also expected to benefit from PPM solutions, as hospitals and clinics look for ways to optimize patient care and reduce costs. PPM solutions can help healthcare organizations to manage resources effectively, track patient outcomes, and improve patient satisfaction.
- Construction: The construction industry is another industry that is expected to be impacted by the PPM market. Construction companies can use PPM solutions to manage complex projects, track budgets, and allocate resources effectively. PPM solutions can also help construction companies to improve collaboration and reduce the risk of delays or cost overruns.
- Financial Services: The financial services industry is also expected to benefit from PPM solutions, as banks and financial institutions look for ways to manage risk and improve efficiency. PPM solutions can help financial institutions to manage complex projects, track budgets, and allocate resources effectively.
- Manufacturing: The manufacturing industry is another industry that is expected to be impacted by the PPM market. Manufacturing companies can use PPM solutions to manage complex projects, track budgets, and allocate resources effectively. PPM solutions can also help manufacturing companies to improve collaboration and reduce the risk of delays or quality issues.
Available Customizations
With the given market data, MarketsandMarkets offers customizations as per the company’s specific needs and on best effort basis for profiling of additional market players.
Growth opportunities and latent adjacency in Project Portfolio Management Market