Recloser Market

Recloser Market by Phase (Three-phase, Single-phase, and Triple Single-phase), Control Type (Electronic and Hydraulic), Voltage Rating (Up to 15 kV, 16-27 kV, and 28-38 kV), Insulation Medium (Oil, air, and epoxy) Region - Global Forecast to 2030

Report Code: EP 3580 Mar, 2024, by marketsandmarkets.com

[288 Pages Report] The global recloser market is estimated at USD 1.1 billion in 2024, with a projected growth to USD 1.5 billion by 2030, exhibiting a Compound Annual Growth Rate (CAGR) of 5.0%. The global recloser market is poised for significant growth, driven by a confluence of factors that necessitate grid modernization, improved reliability, and a growing emphasis on sustainability. Aging grid infrastructure across the globe necessitates upgrades to prevent outages and ensure reliable power delivery. Reclosers, with their automated fault isolation capabilities, offer a cost-effective solution for enhancing protection in specific sections of the grid.  This, coupled with the ongoing focus on grid modernization initiatives worldwide, is expected to fuel the demand for reclosers in the coming years. The increasing penetration of renewable energy sources like wind and solar farms presents both opportunities and challenges for grid operators. Reclosers can play a crucial role in managing the inherent variability of renewable generation by automatically isolating faults and preventing cascading outages.

Furthermore, the evolution of smart grids with advanced communication capabilities necessitates reclosers with similar functionalities. The ability to integrate seamlessly with these automation systems allows for remote monitoring, control, and data analysis, further enhancing grid reliability and efficiency. Environmental considerations regarding the use of mineral oil in traditional oil-insulated reclosers (OIL reclosers) are influencing the market. This has led to the rise of epoxy reclosers which utilize environmentally friendly insulating materials like epoxy resin instead of oil. As environmental regulations evolve and the focus on sustainability intensifies, SDRs are expected to see significant adoption, shaping the future growth trajectory of the recloser market. The future of reclosers lies in continuous innovation and catering to diverse grid needs. Advancements in arc quenching technology for Air-Insulated Reclosers (AIR reclosers) could disrupt the market by offering a completely eco-friendly solution. Additionally, the rise of single-phase reclosers for targeted fault isolation and triple single-phase reclosers for specific applications demonstrates the market's diversification towards specialized solutions. Manufacturers are also focusing on developing cost-effective versions of advanced recloser technologies, making them more accessible to utilities with budgetary constraints.

The global recloser market is on the cusp of exciting growth, driven by the need for grid modernization, the integration of renewable energy sources, and the increasing adoption of sustainable technologies. By focusing on innovation, cost-effectiveness, and catering to diverse market needs, the recloser market is well-positioned to play a vital role in building a more reliable, efficient, and environmentally conscious global power grid of the future.

Recloser Market

To know about the assumptions considered for the study, Request for Free Sample Report

Recloser Market Opportunities

To know about the assumptions considered for the study, download the pdf brochure

Recloser Market Dynamics

Driver: Strategic focus on grid modernization

The global push towards grid modernization is acting as a powerful driver for the growth of the recloser market. A significant portion of the world's power grid infrastructure is aging and deteriorating. Reclosers offer a compelling solution for utilities grappling with grid modernization challenges. Reclosers automatically detect and isolate faults on the power line, minimizing outage durations for unaffected customers on healthy phases of the grid. This not only improves overall reliability but also reduces outage-related costs for utilities. Unlike traditional circuit breakers that require manual intervention, reclosers offer targeted fault protection. They can be strategically placed within the distribution network to isolate faults in specific sections, minimizing the impact on a wider area. Compared to more extensive grid upgrades, deploying reclosers is a relatively cost-effective way to enhance protection and improve reliability in targeted areas of the grid. Reclosers can manage the inherent variability of renewable energy sources by automatically isolating faults caused by sudden changes in power generation. This helps maintain grid stability and facilitates the integration of renewables. The strategic focus on grid modernization presents a significant growth driver for the recloser market. As utilities seek cost-effective solutions to improve grid reliability and integrate renewable energy sources, reclosers are poised to play a crucial role in shaping the future of the power grid.

Restraints: Substantial upfront cost associated with reclosers

While the advantages of reclosers in grid modernization are undeniable, a significant challenge hindering their wider adoption is the substantial upfront cost associated with them. The initial cost of purchasing recloser units themselves can be a significant hurdle, especially for advanced models with features like communication capabilities. The cost of installing reclosers, including labor, materials, and any necessary modifications to the existing grid infrastructure, can add to the overall upfront expense. Utility personnel might require training to operate and maintain these automated devices, adding to the initial investment. The substantial upfront cost associated with reclosers can be a deterrent for utilities, particularly those in developing regions with limited budgets. Utilities with budgetary constraints might prioritize lower-cost solutions or defer deployment of reclosers altogether. While the substantial upfront cost associated with reclosers presents a hurdle, the development of cost-effective solutions, innovative financing models, and a clear understanding of long-term benefits will be crucial in overcoming this restraint and propelling the growth of the recloser market.

Opportunities: Rapid economic development and population growth in emerging markets

Rapid economic development and population growth in emerging economies present a significant opportunity for the recloser market. As economies develop and living standards rise, the demand for electricity soars. This surge in demand puts immense pressure on aging and often inadequate grid infrastructure in these regions. Reclosers, with their ability to enhance grid reliability and protect against outages, become a relevant solution. Many emerging economies are actively investing in infrastructure development, including their power grids. This creates an opportunity for the deployment of new technologies like reclosers to build a more robust and reliable power infrastructure from the ground up. Emerging economies are increasingly looking towards renewable energy sources like solar and wind to meet their growing energy needs. Reclosers play a crucial role here by managing the inherent variability of renewable generation and ensuring overall grid stability. The recloser market has the potential to flourish in emerging economies. By offering a cost-effective solution for grid modernization, improved reliability, and renewable energy integration, reclosers can play a vital role in powering the growth and development of these regions.

Challenges: Lack of standardized cybersecurity protocols

The increasing integration of reclosers with smart grid systems unlocks a plethora of benefits, from remote monitoring to data-driven grid management. However, this integration also exposes a critical challenge: the lack of standardized cybersecurity protocols for reclosers. Traditional reclosers operated as standalone devices. However, the integration of communication modules allows them to connect with supervisory control and data acquisition (SCADA) systems within smart grids. This connectivity introduces potential cybersecurity vulnerabilities. The lack of standardized cybersecurity protocols can hinder the growth of the recloser market in several ways. Utilities might be hesitant to deploy reclosers due to cybersecurity concerns. The potential risks associated with a compromised recloser could outweigh the perceived benefits, slowing down market adoption. Manufacturers might be reluctant to invest in advanced features like communication capabilities if there's no clear standard for securing these functionalities. This could stifle innovation in the recloser market. As regulators become increasingly aware of cybersecurity threats, they might impose stricter regulations on the deployment of reclosers, potentially creating additional hurdles for the market.

Recloser Market Ecosystem

The market for recloser is marked by the participation of leading companies that are firmly established, financially robust, and possess substantial expertise in the production of switchgear and related components. These companies hold a significant market presence and provide a wide array of product offerings. They harness advanced technologies and maintain extensive global sales and marketing networks. Among the notable players in this market are Eaton (Ireland), ABB (Switzerland), Siemens (Germany), and Schneider Electric (France), NOJA Power Switchgear Pty Ltd (Australia), General Electric (US), Hubbell (US), S&C Electric company (US), Tavrida Electric (US), and Arteche Group (Spain).

Recloser Market Ecosystem

Three-phase segment, by phase, to have the largest market share during forecast period

While single-phase reclosers address specific needs in distribution networks, three-phase reclosers are the workhorses when it comes to protecting entire three-phase circuits. Unlike single-phase reclosers that address faults on individual phases, three-phase reclosers are designed to provide comprehensive protection for all three phases of a power line simultaneously. They continuously monitor the current flowing through each phase using sensors.  In the event of a fault, all three phases trip and open automatically. By isolating all three phases simultaneously, three-phase reclosers minimize the impact of faults on the entire circuit, potentially preventing cascading outages and reducing overall downtime for customers. They contribute to a more reliable power supply by preventing faults in one phase from escalating and affecting the entire circuit. By isolating faults quickly, three-phase reclosers help safeguard downstream equipment from damage caused by sustained overcurrents. As the need for robust grid protection grows, three-phase reclosers are poised to remain a vital component of a secure and efficient power grid of the future.

Epoxy segment, by insulation medium, to emerge as largest segment of recloser market.

In the ever-evolving landscape of recloser technology, epoxy reclosers are emerging as champions of sustainability. Unlike their traditional oil-insulated counterparts, epoxy reclosers utilize a solid epoxy resin as the insulating medium instead of mineral oil. This shift offers significant environmental advantages and is shaping the future of the recloser market. Traditional OIL reclosers, while effective in fault protection, raise environmental concerns. Leaks or improper disposal of mineral oil can pose a threat to soil and water resources. Additionally, the production and transportation of oil contribute to the overall carbon footprint of the power grid. Epoxy reclosers address these concerns by utilizing a solid epoxy resin for insulation. This eliminates the risk of oil leaks and simplifies disposal at the end of the recloser's life cycle. Furthermore, epoxy resin production generally has a lower environmental impact compared to mineral oil. These reclosers are the preferred choice for protecting grids in areas with strict environmental regulations or near ecologically sensitive locations. The compact design and fire safety benefits make epoxy reclosers well-suited for deployment in urban environments with space constraints. While OIL reclosers will likely remain in operation for some time, the future of the recloser market points towards a growing preference for epoxy resin technology. Their environmental benefits, combined with strong performance characteristics, make them a compelling choice for utilities and a key driver towards a more sustainable and environmentally conscious power grid. As regulations evolve and the focus on sustainability intensifies, epoxy reclosers are poised to become the standard bearer in the recloser market of the future.

Electronic segment, by control type, to grow at highest CAGR from 2024 to 2030.

Electronic control reclosers utilize sophisticated electronic circuitry and software to manage the entire fault protection process, offering several advantages over traditional mechanical controls. Electronic controls can record detailed data about fault events, such as fault current magnitude, duration, and phase involved. This data can be crucial for analyzing the root cause of faults, improving future maintenance practices, and preventing similar occurrences. Advanced models can integrate with communication networks, enabling remote monitoring and control. This allows utilities to monitor recloser performance in real-time, receive fault notifications, and even adjust settings remotely. Sophisticated algorithms within the electronic control unit can analyze fault conditions and initiate tripping actions faster than mechanical systems, potentially minimizing outage durations. Electronic controls can be programmed to coordinate protection with other reclosers and protective devices on the grid, ensuring a more efficient and targeted response to faults. This minimizes the impact of faults on unaffected sections of the grid. As communication capabilities become more prevalent, robust cybersecurity measures will be essential to safeguard electronic control systems from potential cyberattacks. Electronic controls will play a crucial role in integrating reclosers seamlessly with smart grid systems, enabling advanced fault analysis, predictive maintenance, and grid optimization strategies.

The Asia Pacific recloser market is poised to achieve the highest CAGR throughout the forecast period.

The Asia Pacific region is poised to be a dominant force in the global recloser market, driven by a confluence of factors that necessitate grid modernization, population growth, and increasing demand for electricity. Many countries in Asia Pacific are experiencing rapid economic growth and urbanization. This necessitates significant investments in infrastructure development, including power grids. However, many existing grids in the region are aging and deteriorating, creating a demand for reliable and cost-effective solutions like reclosers to enhance protection and improve reliability. The Asia Pacific region is witnessing a surge in renewable energy deployment, particularly solar and wind farms. Reclosers play a crucial role in integrating these variable renewable sources into the grid. Their ability to automatically isolate faults caused by sudden changes in power generation helps maintain grid stability and ensure reliable power delivery. Budgetary constraints are a reality for many utilities in the region. Reclosers offer a cost-effective solution for targeted grid improvements compared to extensive grid overhauls. This makes them an attractive option for utilities to enhance reliability in specific sections of the grid while maximizing the impact of limited resources. China is expected to remain the largest market for reclosers in the region due to its massive aging grid infrastructure and ongoing modernization efforts. India is another significant player with a growing focus on grid modernization and renewable energy integration. The demand for single-phase reclosers for overhead lines is expected to be high in this market. Countries like Australia and South Korea already have relatively well-developed grids. However, the focus here might shift towards advanced recloser technologies with features like communication capabilities for enhanced grid management. By catering to diverse regional needs through a combination of established and advanced recloser technologies, manufacturers can play a vital role in supporting the development of a more reliable, efficient, and sustainable power grid across the Asia Pacific region.

Asia Pacific Recloser Market Size, and Share

Key Market Players

Schneider Electric (France), Eaton (Ireland), Siemens (Germany), NOJA Power Switchgear Pty Ltd (Australia), ABB (Switzerland), General Electric (US), Hubbell (US), S&C Electric company (US), Tavrida Electric (US), ENTEC Electric & Electronic (South Korea), G&W Electric (US), and Arteche Group (Spain)

Get online access to the report on the World's First Market Intelligence Cloud

  • Easy to Download Historical Data & Forecast Numbers
  • Company Analysis Dashboard for high growth potential opportunities
  • Research Analyst Access for customization & queries
  • Competitor Analysis with Interactive dashboard
  • Latest News, Updates & Trend analysis
Request Sample

Scope of the Report

Report Metric

Details

Market Size available for years

2020–2030

Base year considered

2023

Forecast period

2024–2030

Forecast units

Value (USD Million)

Segments covered

By Phase, By Control type, By Voltage Rating, By Insulation Medium

Geographies covered

Asia Pacific, North America, Europe, Middle East and Africa, and South America 

Companies covered

Schneider Electric (France), Eaton (Ireland), ABB (Switzerland), Siemens (Germany), NOJA Power Switchgear Pty Ltd (Australia), General Electric (US), Hubbell (US), S&C Electric company (US), Tavrida Electric (US), ENTEC Electric & Electronic (South Korea), G&W Electric (US), Arteche Group (Spain), ILJIN ELECTRIC (South Korea), Hughes Power Systems (Sweden), Ghorit Electrical Co., Ltd. (China), Shinsung Industrial Electric co., Ltd. (South Korea), Schweitzer Engineering Laboratories, Inc. (US)

The recloser market is classified in this research report based on phase, control type, voltage rating, insulation medium, and region.

Based on phase:
  • Three-phase
  • Single-phase
  • Triple Single-phase
Based on control type:
  • Electronic
  • Hydraulic
Based on voltage rating:
  • Up to 15 kV
  • 16-27 kV
  • 28-38 kV
Based on insulation medium:
  • Oil
  • Air
  • Epoxy
Based on regions:
  • North America
  • Asia Pacific
  • South America
  • Europe
  • Middle East and Africa

Recent Developments

  • In November 2023, ABB invested in opening a new multipurpose building, which will incorporate sustainable features such as recycled concrete and energy-efficient systems.
  • In August 2023, Eaton partnered with AMP Energy, a clean energy developer, to provide the Xeni Gwet'in First Nation with a modernized power distribution system. The partnership aims at addressing challenges related to grid access in Xeni Gwet'in First Nation.
  • In February 2023, Enedis and Schneider Electric launched a project around a new generation of MV/LV substation equipment as an alternative to the use of SF6 (sulfur hexafluoride) gas. This gas, used in MV electrical equipment for its high insulating and dielectric properties, is extremely useful for medium- and high-voltage electrical distribution.

Frequently Asked Questions (FAQ):

To speak to our analyst for a discussion on the above findings, click Speak to Analyst

TABLE OF CONTENTS
 
1 INTRODUCTION (Page No. - 34)
    1.1 STUDY OBJECTIVES 
    1.2 MARKET DEFINITION 
    1.3 INCLUSIONS AND EXCLUSIONS 
           1.3.1 RECLOSER MARKET, BY PHASE
           1.3.2 RECLOSER MARKET, BY CONTROL TYPE
           1.3.3 RECLOSER MARKET, BY VOLTAGE RATING
           1.3.4 RECLOSER MARKET, BY INSULATION MEDIUM
           1.3.5 RECLOSER MARKET, BY REGION
    1.4 MARKET SCOPE 
           1.4.1 MARKET SEGMENTATION
           1.4.2 REGIONAL SCOPE
           1.4.3 YEARS CONSIDERED
    1.5 CURRENCY CONSIDERED 
    1.6 UNITS CONSIDERED 
    1.7 LIMITATIONS 
    1.8 STAKEHOLDERS 
    1.9 SUMMARY OF CHANGES 
 
2 RESEARCH METHODOLOGY (Page No. - 41)
    2.1 RESEARCH DATA 
           FIGURE 1 RECLOSER MARKET: RESEARCH DESIGN
    2.2 MARKET BREAKDOWN AND DATA TRIANGULATION 
           FIGURE 2 DATA TRIANGULATION
           2.2.1 SECONDARY DATA
                    2.2.1.1 Key data from secondary sources
                    2.2.1.2 List of major secondary sources
           2.2.2 PRIMARY DATA
                    2.2.2.1 Breakdown of primaries
                               FIGURE 3 KEY INDUSTRY INSIGHTS
                               FIGURE 4 BREAKDOWN OF PRIMARY INTERVIEWS: BY COMPANY TYPE, DESIGNATION,  AND REGION
                               FIGURE 5 MAIN METRICS CONSIDERED TO ANALYZE AND ASSESS DEMAND FOR RECLOSERS
                    2.2.2.2 List of key participants in primary interviews
    2.3 MARKET SIZE ESTIMATION 
           2.3.1 BOTTOM-UP APPROACH
                    FIGURE 6 MARKET SIZE ESTIMATION METHODOLOGY: BOTTOM-UP APPROACH
           2.3.2 TOP-DOWN APPROACH
                    FIGURE 7 MARKET SIZE ESTIMATION METHODOLOGY: TOP-DOWN APPROACH
           2.3.3 DEMAND-SIDE ANALYSIS
                    2.3.3.1 Regional analysis
                    2.3.3.2 Country-wise analysis
                    2.3.3.3 Demand-side assumptions
                    2.3.3.4 Demand-side calculations
           2.3.4 SUPPLY-SIDE ANALYSIS
                    FIGURE 8 KEY STEPS CONSIDERED TO ASSESS SUPPLY OF RECLOSERS
                    FIGURE 9 RECLOSER MARKET: SUPPLY-SIDE ANALYSIS
                    2.3.4.1 Supply-side assumptions
                    2.3.4.2 Supply-side calculations
           2.3.5 FORECAST
                    2.3.5.1 Impact of recession on recloser market
                    2.3.5.2 Research assumptions
 
3 EXECUTIVE SUMMARY (Page No. - 52)
    TABLE 1 RECLOSER MARKET SNAPSHOT 
    FIGURE 10 ASIA PACIFIC DOMINATED RECLOSER MARKET IN 2023 
    FIGURE 11 THREE-PHASE SEGMENT TO HOLD LARGEST SHARE OF RECLOSER MARKET  IN 2030 
    FIGURE 12 ELECTRONIC RECLOSERS TO LEAD MARKET THROUGHOUT FORECAST PERIOD 
    FIGURE 13 EPOXY SEGMENT TO EXHIBIT HIGHEST CAGR IN RECLOSER MARKET  FROM 2024 TO 2030 
    FIGURE 14 UP TO 15 KV SEGMENT TO COMMAND RECLOSER MARKET BETWEEN  2024 AND 2030 
 
4 PREMIUM INSIGHTS (Page No. - 57)
    4.1 ATTRACTIVE OPPORTUNITIES FOR KEY PLAYERS IN RECLOSER MARKET 
           FIGURE 15 EXPANSION OF TRANSMISSION AND DISTRIBUTION NETWORKS TO DRIVE MARKET BETWEEN 2024 AND 2030
    4.2 RECLOSER MARKET, BY REGION 
           FIGURE 16 ASIA PACIFIC TO BE FASTEST-GROWING MARKET DURING FORECAST PERIOD
    4.3 RECLOSER MARKET IN ASIA PACIFIC, BY CONTROL TYPE  AND COUNTRY, 2023 
           FIGURE 17 ELECTRONIC SEGMENT AND CHINA ACCOUNTED FOR LARGEST SHARES  OF RECLOSER MARKET IN 2023
    4.4 RECLOSER MARKET, BY PHASE 
           FIGURE 18 THREE-PHASE RECLOSERS TO ACCOUNT FOR MAJORITY OF MARKET SHARE  IN 2030
    4.5 RECLOSER MARKET, BY CONTROL TYPE 
           FIGURE 19 ELECTRONIC SEGMENT TO ACCOUNT FOR LARGER MARKET SHARE THAN HYDRAULIC SEGMENT IN 2030
    4.6 RECLOSER MARKET, BY VOLTAGE RATING 
           FIGURE 20 RECLOSERS WITH VOLTAGE RATINGS OF UP TO 15 KV TO DOMINATE MARKET  IN 2030
    4.7 RECLOSER MARKET, BY INSULATION MEDIUM 
           FIGURE 21 EPOXY SEGMENT TO CAPTURE LARGEST MARKET SHARE IN 2030
 
5 MARKET OVERVIEW (Page No. - 62)
    5.1 INTRODUCTION 
    5.2 MARKET DYNAMICS 
           FIGURE 22 DRIVERS, RESTRAINTS, OPPORTUNITIES, AND CHALLENGES:  RECLOSER MARKET
           5.2.1 DRIVERS
                    5.2.1.1 Strategic focus on grid modernization
                               FIGURE 23 GLOBAL INVESTMENTS IN POWER GRIDS, 2015–2022
                    5.2.1.2 Emphasis on integrating renewable energy sources into power grids
                               FIGURE 24 GLOBAL RENEWABLE ELECTRICITY CAPACITY EXPANSION, 2005–2028
                    5.2.1.3 Expansion of transmission and distribution infrastructure
                               FIGURE 25 INVESTMENTS IN T&D GRIDS, BY COUNTRY, 2018–2022
           5.2.2 RESTRAINTS
                    5.2.2.1 Substantial upfront cost associated with reclosers
                    5.2.2.2 Standardization and interoperability issues related to reclosers
                    5.2.2.3 Fluctuating copper material prices
                               FIGURE 26 AVERAGE COPPER PRICE PER ANNUM, 2017–2023 (USD/KG)
           5.2.3 OPPORTUNITIES
                    5.2.3.1 Rapid economic development and population growth in emerging markets
                               FIGURE 27 ENERGY INVESTMENTS IN EMERGING MARKETS, BY SOURCE TYPE,  2019 VS. 2022
                    5.2.3.2 Government-run performance-based incentive schemes for power distribution network operators
                    5.2.3.3 Introduction of reclosers with advanced functionalities
           5.2.4 CHALLENGES
                    5.2.4.1 Lack of standardized cybersecurity protocols
                    5.2.4.2 Intense competition among market players and potential threat of substitutes
    5.3 TRENDS/DISRUPTIONS IMPACTING CUSTOMER BUSINESS 
           5.3.1 TRENDS INFLUENCING CUSTOMER BUSINESS
                    FIGURE 28 TRENDS IMPACTING CUSTOMER BUSINESS
    5.4 ECOSYSTEM ANALYSIS 
           FIGURE 29 KEY PLAYERS IN ECOSYSTEM
           TABLE 2 ROLE OF PARTICIPANTS IN ECOSYSTEM
    5.5 INVESTMENT AND FUNDING SCENARIO 
           FIGURE 30 FUNDING RAISED BY TOP PLAYERS IN RECLOSER MARKET, 2020–2024
           TABLE 3 ABB: FUNDING DETAILS
           TABLE 4 EATON CORPORATION: FUNDING DETAILS
           TABLE 5 SIEMENS: FUNDING DETAILS
           TABLE 6 NOJA POWER: FUNDING DETAILS
    5.6 SUPPLY CHAIN ANALYSIS 
           FIGURE 31 RECLOSER MARKET: SUPPLY CHAIN ANALYSIS
           5.6.1 RAW MATERIAL PROVIDERS/SUPPLIERS
           5.6.2 COMPONENT MANUFACTURERS
           5.6.3 RECLOSER MANUFACTURERS/ASSEMBLERS
           5.6.4 DISTRIBUTORS
           5.6.5 END USERS
           5.6.6 POST-SALES SERVICE PROVIDERS
    5.7 TECHNOLOGY TRENDS 
           5.7.1 ARTIFICIAL INTELLIGENCE (AI)-BASED AUTOMATIC CIRCUIT RECLOSERS
           5.7.2 INTERNET OF THINGS (IOT)-CONNECTED AUTOMATIC CIRCUIT RECLOSERS
    5.8 PRICING ANALYSIS 
           5.8.1 INDICATIVE PRICING ANALYSIS, BY VOLTAGE RATING
                    TABLE 7 INDICATIVE PRICES OF RECLOSERS, BY VOLTAGE RATING, 2023
           5.8.2 AVERAGE SELLING PRICE TREND, BY REGION
                    FIGURE 32 AVERAGE SELLING PRICE TREND, BY REGION, 2020–2023
    5.9 KEY CONFERENCES AND EVENTS, 2024–2025 
           TABLE 8 RECLOSER MARKET: DETAILED LIST OF CONFERENCES AND EVENTS
    5.10 TARIFF AND REGULATORY LANDSCAPE 
           5.10.1 TARIFF ANALYSIS
                    5.10.1.1 Country-wise tariff for HS code 853690-compliant products
                               TABLE 9 IMPORT TARIFFS FOR HS 853690-COMPLIANT LOW-VOLTAGE PROTECTION  EQUIPMENT, 2022
                    5.10.1.2 Country-wise tariff for HS code 8535-compliant products
                               TABLE 10 IMPORT TARIFFS FOR HS 8535-COMPLIANT HIGH-VOLTAGE PROTECTION  EQUIPMENT, 2022
           5.10.2 REGULATORY BODIES, GOVERNMENT AGENCIES,  AND OTHER ORGANIZATIONS
                    TABLE 11 NORTH AMERICA: LIST OF REGULATORY BODIES, GOVERNMENT AGENCIES,  AND OTHER ORGANIZATIONS
                    TABLE 12 EUROPE: LIST OF REGULATORY BODIES, GOVERNMENT AGENCIES,  AND OTHER ORGANIZATIONS
                    TABLE 13 ASIA PACIFIC: LIST OF REGULATORY BODIES, GOVERNMENT AGENCIES,  AND OTHER ORGANIZATIONS
                    TABLE 14 ROW: LIST OF REGULATORY BODIES, GOVERNMENT AGENCIES, AND OTHER ORGANIZATIONS
           5.10.3 CODES AND REGULATIONS RELATED TO RECLOSER MARKET
                    TABLE 15 RECLOSER MARKET: CODES AND REGULATIONS
    5.11 TRADE ANALYSIS 
           5.11.1 TRADE ANALYSIS FOR ELECTRICAL APPARATUS USED IN SWITCHING OR PROTECTING ELECTRICAL CIRCUITS EXCEEDING 1,000 VOLTS
           5.11.2 IMPORT DATA
                    TABLE 16 IMPORT SCENARIO FOR HS CODE 8535-COMPLIANT PRODUCTS, BY COUNTRY,  2020–2022 (USD THOUSAND)
                    FIGURE 33 IMPORT DATA FOR HS CODE 8535-COMPLIANT PRODUCTS FOR TOP 5 COUNTRIES, 2018–2022 (USD THOUSAND)
           5.11.3 EXPORT DATA
                    TABLE 17 EXPORT SCENARIO FOR HS CODE 8535-COMPLIANT PRODUCTS, BY COUNTRY, 2020–2022 (USD)
                    FIGURE 34 EXPORT DATA FOR HS CODE 8535-COMPLIANT PRODUCTS FOR TOP 5 COUNTRIES, 2018–2022 (USD THOUSAND)
           5.11.4 TRADE ANALYSIS FOR ELECTRICAL APPARATUS USED IN SWITCHING OR PROTECTING ELECTRICAL CIRCUITS NOT EXCEEDING 1,000 VOLTS
           5.11.5 IMPORT DATA
                    TABLE 18 IMPORT SCENARIO FOR HS CODE 853690-COMPLIANT PRODUCTS, BY COUNTRY,  2020–2022 (USD)
                    FIGURE 35 IMPORT DATA FOR HS CODE 853690-COMPLIANT PRODUCTS FOR TOP 5 COUNTRIES, 2018–2022 (USD THOUSAND)
           5.11.6 EXPORT DATA
                    TABLE 19 EXPORT SCENARIO FOR HS CODE 853690-COMPLIANT PRODUCTS, BY COUNTRY,  2020–2022 (USD)
                    FIGURE 36 EXPORT DATA FOR HS CODE 853690-COMPLIANT PRODUCTS FOR TOP 5 COUNTRIES, 2018–2022 (USD THOUSAND)
    5.12 PATENT ANALYSIS 
                    FIGURE 37 RECLOSER MARKET: INNOVATIONS AND PATENT REGISTRATIONS, 2013–2023
                    TABLE 20 RECLOSER MARKET: INNOVATIONS AND PATENT REGISTRATIONS,  DECEMBER 2020–DECEMBER 2023
    5.13 PORTER’S FIVE FORCES ANALYSIS 
                    FIGURE 38 PORTER’S FIVE FORCES ANALYSIS FOR RECLOSER MARKET
                    TABLE 21 RECLOSER MARKET: PORTER’S FIVE FORCES ANALYSIS
           5.13.1 THREAT OF SUBSTITUTES
                    TABLE 22 RECLOSER MARKET: COMPARISON OF SUBSTITUTES
           5.13.2 BARGAINING POWER OF SUPPLIERS
           5.13.3 BARGAINING POWER OF BUYERS
           5.13.4 THREAT OF NEW ENTRANTS
           5.13.5 INTENSITY OF COMPETITIVE RIVALRY
    5.14 KEY STAKEHOLDERS AND BUYING CRITERIA 
           5.14.1 KEY STAKEHOLDERS IN BUYING PROCESS
                    FIGURE 39 INFLUENCE OF KEY STAKEHOLDERS ON BUYING PROCESS FOR  TOP 3 END USERS
                    TABLE 23 INFLUENCE OF KEY STAKEHOLDERS ON BUYING PROCESS FOR TOP 3 END USERS
    5.15 BUYING CRITERIA 
                    FIGURE 40 KEY BUYING CRITERIA FOR TOP 3 END USERS
                    TABLE 24 KEY BUYING CRITERIA FOR TOP 3 END USERS
    5.16 CASE STUDY ANALYSIS 
           5.16.1 G&W ELECTRIC OFFERS PADMOUNT VIPER-ST RECLOSER TO UTILITY TO ENSURE COMPLIANCE WITH SAFETY STANDARDS
                    5.16.1.1 Problem statement
                    5.16.1.2 Solution
           5.16.2 BANDERA ELECTRIC COOPERATIVE IMPLEMENTS TRIPSAVER II CUTOUT-MOUNTED RECLOSERS FOR RELIABLE FAULT INTERRUPTION AND EFFECTIVE GRID MANAGEMENT
                    5.16.2.1 Problem statement
                    5.16.2.2 Solution
           5.16.3 G&W ELECTRIC VIPER DEPLOYS RECLOSER IN PV ARRAY AT STATE COLLEGE
                    5.16.3.1 Problem statement
                    5.16.3.2 Solution
 
6 RECLOSER MARKET, BY PHASE (Page No. - 107)
    6.1 INTRODUCTION 
           FIGURE 41 RECLOSER MARKET, BY PHASE, 2023
           TABLE 25 RECLOSER MARKET, BY PHASE, 2020–2023 (USD MILLION)
           TABLE 26 RECLOSER MARKET, BY PHASE, 2024–2030 (USD MILLION)
    6.2 THREE-PHASE 
           6.2.1 GROWING NEED FOR RELIABLE POWER SUPPLY IN RESIDENTIAL, COMMERCIAL, AND INDUSTRIAL SECTORS TO ACCELERATE SEGMENTAL GROWTH
                    TABLE 27 THREE-PHASE: RECLOSER MARKET, BY REGION, 2020–2023 (USD MILLION)
                    TABLE 28 THREE-PHASE: RECLOSER MARKET, BY REGION, 2024–2030 (USD MILLION)
    6.3 SINGLE-PHASE 
           6.3.1 INCREASING INVESTMENT IN T&D PROJECTS TO DRIVE MARKET
                    TABLE 29 SINGLE-PHASE: RECLOSER MARKET, BY REGION, 2020–2023 (USD MILLION)
                    TABLE 30 SINGLE-PHASE: RECLOSER MARKET, BY REGION, 2024–2030 (USD MILLION)
    6.4 TRIPLE SINGLE-PHASE 
           6.4.1 BETTER NETWORK RELIABILITY AND OVERCURRENT PROTECTION TO BOOST ADOPTION
                    TABLE 31 TRIPLE SINGLE-PHASE: RECLOSER MARKET, BY REGION, 2020–2023 (USD MILLION)
                    TABLE 32 TRIPLE SINGLE-PHASE: RECLOSER MARKET, BY REGION, 2024–2030 (USD MILLION)
 
7 RECLOSER MARKET, BY CONTROL TYPE (Page No. - 113)
    7.1 INTRODUCTION 
           FIGURE 42 RECLOSER MARKET, BY CONTROL TYPE, 2023
           TABLE 33 RECLOSER MARKET, BY CONTROL TYPE, 2020–2023 (USD MILLION)
           TABLE 34 RECLOSER MARKET, BY CONTROL TYPE, 2024–2030 (USD MILLION)
    7.2 ELECTRONIC 
           7.2.1 INCREASING INVESTMENT IN SMART GRIDS TO BOOST DEMAND
                    TABLE 35 ELECTRONIC: RECLOSER MARKET, BY REGION, 2020–2023 (USD MILLION)
                    TABLE 36 ELECTRONIC: RECLOSER MARKET, BY REGION, 2024–2030 (USD MILLION)
    7.3 HYDRAULIC 
           7.3.1 GROWING NEED FOR RELIABLE BACKUP SOLUTIONS IN POWER DISTRIBUTION NETWORKS TO DRIVE MARKET
                    TABLE 37 HYDRAULIC: RECLOSER MARKET, BY REGION, 2020–2023 (USD MILLION)
                    TABLE 38 HYDRAULIC: RECLOSER MARKET, BY REGION, 2024–2030 (USD MILLION)
 
8 RECLOSER MARKET, BY VOLTAGE RATING (Page No. - 118)
    8.1 INTRODUCTION 
           FIGURE 43 RECLOSER MARKET, BY VOLTAGE RATING, 2023
           TABLE 39 RECLOSER MARKET, BY VOLTAGE RATING, 2020–2023 (USD MILLION)
           TABLE 40 RECLOSER MARKET, BY VOLTAGE RATING, 2024–2030 (USD MILLION)
           TABLE 41 RECLOSER MARKET, BY VOLTAGE RATING, 2020–2023 (THOUSAND UNITS)
           TABLE 42 RECLOSER MARKET, BY VOLTAGE RATING, 2024–2030 (THOUSAND UNITS)
    8.2 UP TO 15 KV 
           8.2.1 GROWING DEMAND FROM DEVELOPING COUNTRIES OWING TO AFFORDABLE PRICES TO BOOST SEGMENTAL GROWTH
                    TABLE 43 UP TO 15 KV: RECLOSER MARKET, BY REGION, 2020–2023 (USD MILLION)
                    TABLE 44 UP TO 15 KV: RECLOSER MARKET, BY REGION, 2024–2030 (USD MILLION)
                    TABLE 45 UP TO 15 KV: RECLOSER MARKET, BY REGION, 2020–2023 (THOUSAND UNITS)
                    TABLE 46 UP TO 15 KV: RECLOSER MARKET, BY REGION, 2024–2030 (THOUSAND UNITS)
    8.3 16–27 KV 
           8.3.1 SURGING DEMAND FOR RELIABLE POWER SUPPLY FROM INDUSTRIAL AND COMMERCIAL SECTORS TO FUEL SEGMENTAL GROWTH
                    TABLE 47 16–27 KV: RECLOSER MARKET, BY REGION, 2020–2023 (USD MILLION)
                    TABLE 48 16–27 KV: RECLOSER MARKET, BY REGION, 2024–2030 (USD MILLION)
                    TABLE 49 16–27 KV: RECLOSER MARKET, BY REGION, 2020–2023 (THOUSAND UNITS)
                    TABLE 50 16–27 KV: RECLOSER MARKET, BY REGION, 2024–2030 (THOUSAND UNITS)
    8.4 28–38 KV 
           8.4.1 INCREASING USE OF RENEWABLE ENERGY SOURCES TO ACCELERATE MARKET GROWTH
                    TABLE 51 28–38 KV: RECLOSER MARKET, BY REGION, 2020–2023 (USD MILLION)
                    TABLE 52 28–38 KV: RECLOSER MARKET, BY REGION, 2024–2030 (USD MILLION)
                    TABLE 53 28–38 KV: RECLOSER MARKET, BY REGION, 2020–2023 (THOUSAND UNITS)
                    TABLE 54 28–38 KV: RECLOSER MARKET, BY REGION, 2024–2030 (THOUSAND UNITS)
 
9 RECLOSER MARKET, BY INSULATION MEDIUM (Page No. - 126)
    9.1 INTRODUCTION 
           FIGURE 44 RECLOSER MARKET, BY INSULATION MEDIUM, 2023
           TABLE 55 RECLOSER MARKET, BY INSULATION MEDIUM, 2020–2023 (USD MILLION)
           TABLE 56 RECLOSER MARKET, BY INSULATION MEDIUM, 2024–2030 (USD MILLION)
    9.2 OIL 
           9.2.1 STRINGENT ENVIRONMENTAL REGULATIONS TO LIMIT ADOPTION
                    TABLE 57 OIL: RECLOSER MARKET, BY REGION, 2020–2023 (USD MILLION)
                    TABLE 58 OIL: RECLOSER MARKET, BY REGION, 2024–2030 (USD MILLION)
    9.3 AIR 
           9.3.1 SIMPLER DESIGN AND MINIMAL MAINTENANCE TO BOOST DEMAND
                    TABLE 59 AIR: RECLOSER MARKET, BY REGION, 2020–2023 (USD MILLION)
                    TABLE 60 AIR: RECLOSER MARKET, BY REGION, 2024–2030 (USD MILLION)
    9.4 EPOXY 
           9.4.1 ECO-FRIENDLY DESIGN AND ABILITY TO WITHSTAND HIGH VOLTAGE STRESS TO FUEL MARKET GROWTH
                    TABLE 61 EPOXY: RECLOSER MARKET, BY REGION, 2020–2023 (USD MILLION)
                    TABLE 62 EPOXY: RECLOSER MARKET, BY REGION, 2024–2030 (USD MILLION)
 
10 RECLOSER MARKET, BY REGION (Page No. - 131)
     10.1 INTRODUCTION 
               FIGURE 45 ASIA PACIFIC TO RECORD HIGHEST CAGR IN RECLOSER MARKET DURING FORECAST PERIOD
               FIGURE 46 RECLOSER MARKET SHARE (IN TERMS OF VALUE), BY REGION, 2023
               TABLE 63 RECLOSER MARKET, BY REGION, 2020–2023 (USD MILLION)
               TABLE 64 RECLOSER MARKET, BY REGION, 2024–2030 (USD MILLION)
     10.2 ASIA PACIFIC 
             10.2.1 RECESSION IMPACT ON MARKET IN ASIA PACIFIC
                       FIGURE 47 ASIA PACIFIC: RECLOSER MARKET SNAPSHOT
                       TABLE 65 ASIA PACIFIC: RECLOSER MARKET, BY PHASE, 2020–2023 (USD MILLION)
                       TABLE 66 ASIA PACIFIC: RECLOSER MARKET, BY PHASE, 2024–2030 (USD MILLION)
                       TABLE 67 ASIA PACIFIC: RECLOSER MARKET, BY CONTROL TYPE, 2020–2023 (USD MILLION)
                       TABLE 68 ASIA PACIFIC: RECLOSER MARKET, BY CONTROL TYPE, 2024–2030 (USD MILLION)
                       TABLE 69 ASIA PACIFIC: RECLOSER MARKET, BY INSULATION MEDIUM, 2020–2023 (USD MILLION)
                       TABLE 70 ASIA PACIFIC: RECLOSER MARKET, BY INSULATION MEDIUM, 2024–2030 (USD MILLION)
                       TABLE 71 ASIA PACIFIC: RECLOSER MARKET, BY VOLTAGE RATING, 2020–2023 (USD MILLION)
                       TABLE 72 ASIA PACIFIC: RECLOSER MARKET, BY VOLTAGE RATING, 2024–2030 (USD MILLION)
                       TABLE 73 ASIA PACIFIC: RECLOSER MARKET, BY COUNTRY, 2020–2023 (USD MILLION)
                       TABLE 74 ASIA PACIFIC: RECLOSER MARKET, BY COUNTRY, 2024–2030 (USD MILLION)
                       10.2.1.1 China
                                   10.2.1.1.1 Rising investment in clean energy and grid modernization projects to fuel market growth
                                                        TABLE 75 CHINA: RECLOSER MARKET, BY PHASE, 2020–2023 (USD MILLION)
                                                        TABLE 76 CHINA: RECLOSER MARKET, BY PHASE, 2024–2030 (USD MILLION)
                                                        TABLE 77 CHINA: RECLOSER MARKET, BY CONTROL TYPE, 2020–2023 (USD MILLION)
                                                        TABLE 78 CHINA: RECLOSER MARKET, BY CONTROL TYPE, 2024–2030 (USD MILLION)
                       10.2.1.2 Australia
                                   10.2.1.2.1 Growing focus on improving network reliability and resilience to drive market
                                                        TABLE 79 AUSTRALIA: RECLOSER MARKET, BY PHASE, 2020–2023 (USD MILLION)
                                                        TABLE 80 AUSTRALIA: RECLOSER MARKET, BY PHASE, 2024–2030 (USD MILLION)
                                                        TABLE 81 AUSTRALIA: RECLOSER MARKET, BY CONTROL TYPE, 2020–2023 (USD MILLION)
                                                        TABLE 82 AUSTRALIA: RECLOSER MARKET, BY CONTROL TYPE, 2024–2030 (USD MILLION)
                       10.2.1.3 India
                                   10.2.1.3.1 Government initiatives in electrification projects to stimulate market growth
                                                        TABLE 83 INDIA: RECLOSER MARKET, BY PHASE, 2020–2023 (USD MILLION)
                                                        TABLE 84 INDIA: RECLOSER MARKET, BY PHASE, 2024–2030 (USD MILLION)
                                                        TABLE 85 INDIA: RECLOSER MARKET, BY CONTROL TYPE, 2020–2023 (USD MILLION)
                                                        TABLE 86 INDIA: RECLOSER MARKET, BY CONTROL TYPE, 2024–2030 (USD MILLION)
                       10.2.1.4 South Korea
                                   10.2.1.4.1 Rapid transition toward renewable energy sources to accelerate demand
                                                        TABLE 87 SOUTH KOREA: RECLOSER MARKET, BY PHASE, 2020–2023 (USD MILLION)
                                                        TABLE 88 SOUTH KOREA: RECLOSER MARKET, BY PHASE, 2024–2030 (USD MILLION)
                                                        TABLE 89 SOUTH KOREA: RECLOSER MARKET, BY CONTROL TYPE, 2020–2023 (USD MILLION)
                                                        TABLE 90 SOUTH KOREA: RECLOSER MARKET, BY CONTROL TYPE, 2024–2030 (USD MILLION)
                       10.2.1.5 Rest of Asia Pacific
                                   TABLE 91 REST OF ASIA PACIFIC: RECLOSER MARKET, BY PHASE, 2020–2023 (USD MILLION)
                                   TABLE 92 REST OF ASIA PACIFIC: RECLOSER MARKET, BY PHASE, 2024–2030 (USD MILLION)
                                   TABLE 93 REST OF ASIA PACIFIC: RECLOSER MARKET, BY CONTROL TYPE,  2020–2023 (USD MILLION)
                                   TABLE 94 REST OF ASIA PACIFIC: RECLOSER MARKET, BY CONTROL TYPE,  2024–2030 (USD MILLION)
     10.3 NORTH AMERICA 
             10.3.1 RECESSION IMPACT ON MARKET IN NORTH AMERICA
                       FIGURE 48 NORTH AMERICA: RECLOSER MARKET SNAPSHOT
                       TABLE 95 NORTH AMERICA: RECLOSER MARKET, BY PHASE, 2020–2023 (USD MILLION)
                       TABLE 96 NORTH AMERICA: RECLOSER MARKET, BY PHASE, 2024–2030 (USD MILLION)
                       TABLE 97 NORTH AMERICA: RECLOSER MARKET, BY CONTROL TYPE, 2020–2023 (USD MILLION)
                       TABLE 98 NORTH AMERICA: RECLOSER MARKET, BY CONTROL TYPE, 2024–2030 (USD MILLION)
                       TABLE 99 NORTH AMERICA: RECLOSER MARKET, BY INSULATION MEDIUM,  2020–2023 (USD MILLION)
                       TABLE 100 NORTH AMERICA: RECLOSER MARKET, BY INSULATION MEDIUM,  2024–2030 (USD MILLION)
                       TABLE 101 NORTH AMERICA: RECLOSER MARKET, BY VOLTAGE RATING, 2020–2023 (USD MILLION)
                       TABLE 102 NORTH AMERICA: RECLOSER MARKET, BY VOLTAGE RATING, 2024–2030 (USD MILLION)
                       TABLE 103 NORTH AMERICA: RECLOSER MARKET, BY COUNTRY, 2020–2023 (USD MILLION)
                       TABLE 104 NORTH AMERICA: RECLOSER MARKET, BY COUNTRY, 2024–2030 (USD MILLION)
                       10.3.1.1 US
                                   10.3.1.1.1 Pressing need to shift from aging coal-fired power plants to gas-fired flexible power plants to boost demand
                                                        TABLE 105 US: RECLOSER MARKET, BY PHASE, 2020–2023 (USD MILLION)
                                                        TABLE 106 US: RECLOSER MARKET, BY PHASE, 2024–2030 (USD MILLION)
                                                        TABLE 107 US: RECLOSER MARKET, BY CONTROL TYPE, 2020–2023 (USD MILLION)
                                                        TABLE 108 US: RECLOSER MARKET, BY CONTROL TYPE, 2024–2030 (USD MILLION)
                       10.3.1.2 Canada
                                   10.3.1.2.1 Strong focus on increasing proportion of renewables in energy mix to boost demand
                                                        TABLE 109 CANADA: RECLOSER MARKET, BY PHASE, 2020–2023 (USD MILLION)
                                                        TABLE 110 CANADA: RECLOSER MARKET, BY PHASE, 2024–2030 (USD MILLION)
                                                        TABLE 111 CANADA: RECLOSER MARKET, BY CONTROL TYPE, 2020–2023 (USD MILLION)
                                                        TABLE 112 CANADA: RECLOSER MARKET, BY CONTROL TYPE, 2024–2030 (USD MILLION)
                       10.3.1.3 Mexico
                                   10.3.1.3.1 Increasing investment in power infrastructure development to foster market growth
                                                        TABLE 113 MEXICO: RECLOSER MARKET, BY PHASE, 2020–2023 (USD MILLION)
                                                        TABLE 114 MEXICO: RECLOSER MARKET, BY PHASE, 2024–2030 (USD MILLION)
                                                        TABLE 115 MEXICO: RECLOSER MARKET, BY CONTROL TYPE, 2020–2023 (USD MILLION)
                                                        TABLE 116 MEXICO: RECLOSER MARKET, BY CONTROL TYPE, 2024–2030 (USD MILLION)
     10.4 EUROPE 
             10.4.1 RECESSION IMPACT ON MARKET IN EUROPE
                       TABLE 117 EUROPE: RECLOSER MARKET, BY PHASE, 2020–2023 (USD MILLION)
                       TABLE 118 EUROPE: RECLOSER MARKET, BY PHASE, 2024–2030 (USD MILLION)
                       TABLE 119 EUROPE: RECLOSER MARKET, BY CONTROL TYPE, 2020–2023 (USD MILLION)
                       TABLE 120 EUROPE: RECLOSER MARKET, BY CONTROL TYPE, 2024–2030 (USD MILLION)
                       TABLE 121 EUROPE: RECLOSER MARKET, BY INSULATION MEDIUM, 2020–2023 (USD MILLION)
                       TABLE 122 EUROPE: RECLOSER MARKET, BY INSULATION MEDIUM, 2024–2030 (USD MILLION)
                       TABLE 123 EUROPE: RECLOSER MARKET, BY VOLTAGE RATING, 2020–2023 (USD MILLION)
                       TABLE 124 EUROPE: RECLOSER MARKET, BY VOLTAGE RATING, 2024–2030 (USD MILLION)
                       TABLE 125 EUROPE: RECLOSER MARKET, BY COUNTRY, 2020–2023 (USD MILLION)
                       TABLE 126 EUROPE: RECLOSER MARKET, BY COUNTRY, 2024–2030 (USD MILLION)
                       10.4.1.1 Germany
                                   10.4.1.1.1 Significant focus on expanding grid infrastructure and power transmission network to drive market
                                                        TABLE 127 GERMANY: RECLOSER MARKET, BY PHASE, 2020–2023 (USD MILLION)
                                                        TABLE 128 GERMANY: RECLOSER MARKET, BY PHASE, 2024–2030 (USD MILLION)
                                                        TABLE 129 GERMANY: RECLOSER MARKET, BY CONTROL TYPE, 2020–2023 (USD MILLION)
                                                        TABLE 130 GERMANY: RECLOSER MARKET, BY CONTROL TYPE, 2024–2030 (USD MILLION)
                       10.4.1.2 UK
                                   10.4.1.2.1 Increasing focus on power generation using renewable sources to propel market
                                                        TABLE 131 UK: RECLOSER MARKET, BY PHASE, 2020–2023 (USD MILLION)
                                                        TABLE 132 UK: RECLOSER MARKET, BY PHASE, 2024–2030 (USD MILLION)
                                                        TABLE 133 UK: RECLOSER MARKET, BY CONTROL TYPE, 2020–2023 (USD MILLION)
                                                        TABLE 134 UK: RECLOSER MARKET, BY CONTROL TYPE, 2024–2030 (USD MILLION)
                       10.4.1.3 Italy
                                   10.4.1.3.1 Shift from natural gas toward renewable energy to stimulate market growth
                                                        TABLE 135 ITALY: RECLOSER MARKET, BY PHASE, 2020–2023 (USD MILLION)
                                                        TABLE 136 ITALY: RECLOSER MARKET, BY PHASE, 2024–2030 (USD MILLION)
                                                        TABLE 137 ITALY: RECLOSER MARKET, BY CONTROL TYPE, 2020–2023 (USD MILLION)
                                                        TABLE 138 ITALY: RECLOSER MARKET, BY CONTROL TYPE, 2024–2030 (USD MILLION)
                       10.4.1.4 France
                                   10.4.1.4.1 Government initiatives to replace aging infrastructure with smart grid technology to provide growth opportunities
                                                        TABLE 139 FRANCE: RECLOSER MARKET, BY PHASE, 2020–2023 (USD MILLION)
                                                        TABLE 140 FRANCE: RECLOSER MARKET, BY PHASE, 2024–2030 (USD MILLION)
                                                        TABLE 141 FRANCE: RECLOSER MARKET, BY CONTROL TYPE, 2020–2023 (USD MILLION)
                                                        TABLE 142 FRANCE: RECLOSER MARKET, BY CONTROL TYPE, 2024–2030 (USD MILLION)
                       10.4.1.5 Spain
                                   10.4.1.5.1 Development of electricity transmission networks to fuel demand
                                                        TABLE 143 SPAIN: RECLOSER MARKET, BY PHASE, 2020–2023 (USD MILLION)
                                                        TABLE 144 SPAIN: RECLOSER MARKET, BY PHASE, 2024–2030 (USD MILLION)
                                                        TABLE 145 SPAIN: RECLOSER MARKET, BY CONTROL TYPE, 2020–2023 (USD MILLION)
                                                        TABLE 146 SPAIN: RECLOSER MARKET, BY CONTROL TYPE, 2024–2030 (USD MILLION)
                       10.4.1.6 Rest of Europe
                                   TABLE 147 REST OF EUROPE: RECLOSER MARKET, BY PHASE, 2020–2023 (USD MILLION)
                                   TABLE 148 REST OF EUROPE: RECLOSER MARKET, BY PHASE, 2024–2030 (USD MILLION)
                                   TABLE 149 REST OF EUROPE: RECLOSER MARKET, BY CONTROL TYPE, 2020–2023 (USD MILLION)
                                   TABLE 150 REST OF EUROPE: RECLOSER MARKET, BY CONTROL TYPE, 2024–2030 (USD MILLION)
     10.5 MIDDLE EAST & AFRICA 
             10.5.1 RECESSION IMPACT ON MARKET IN MIDDLE EAST & AFRICA
                       TABLE 151 MIDDLE EAST & AFRICA: RECLOSER MARKET, BY PHASE, 2020–2023 (USD MILLION)
                       TABLE 152 MIDDLE EAST & AFRICA: RECLOSER MARKET, BY PHASE, 2024–2030 (USD MILLION)
                       TABLE 153 MIDDLE EAST & AFRICA: RECLOSER MARKET, BY CONTROL TYPE,  2020–2023 (USD MILLION)
                       TABLE 154 MIDDLE EAST & AFRICA: RECLOSER MARKET, BY CONTROL TYPE,  2024–2030 (USD MILLION)
                       TABLE 155 MIDDLE EAST & AFRICA: RECLOSER MARKET, BY INSULATION MEDIUM,  2020–2023 (USD MILLION)
                       TABLE 156 MIDDLE EAST & AFRICA: RECLOSER MARKET, BY INSULATION MEDIUM,  2024–2030 (USD MILLION)
                       TABLE 157 MIDDLE EAST & AFRICA: RECLOSER MARKET, BY VOLTAGE RATING,  2020–2023 (USD MILLION)
                       TABLE 158 MIDDLE EAST & AFRICA: RECLOSER MARKET, BY VOLTAGE RATING,  2024–2030 (USD MILLION)
                       TABLE 159 MIDDLE EAST & AFRICA: RECLOSER MARKET, BY COUNTRY, 2020–2023 (USD MILLION)
                       TABLE 160 MIDDLE EAST & AFRICA: RECLOSER MARKET, BY COUNTRY, 2024–2030 (USD MILLION)
                       10.5.1.1 GCC countries
                                   TABLE 161 GCC COUNTRIES: RECLOSER MARKET, BY PHASE, 2020–2023 (USD MILLION)
                                   TABLE 162 GCC COUNTRIES: RECLOSER MARKET, BY PHASE, 2024–2030 (USD MILLION)
                                   TABLE 163 GCC COUNTRIES: RECLOSER MARKET, BY CONTROL TYPE, 2020–2023 (USD MILLION)
                                   TABLE 164 GCC COUNTRIES: RECLOSER MARKET, BY CONTROL TYPE, 2024–2030 (USD MILLION)
                                   TABLE 165 GCC COUNTRIES: RECLOSER MARKET, BY COUNTRY, 2020–2023 (USD MILLION)
                                   TABLE 166 GCC COUNTRIES: RECLOSER MARKET, BY COUNTRY, 2024–2030 (USD MILLION)
                       10.5.1.2 Saudi Arabia
                                   10.5.1.2.1 Government policies aiming to reduce carbon emissions to drive market
                                                        TABLE 167 SAUDI ARABIA: RECLOSER MARKET, BY PHASE, 2020–2023 (USD MILLION)
                                                        TABLE 168 SAUDI ARABIA: RECLOSER MARKET, BY PHASE, 2024–2030 (USD MILLION)
                                                        TABLE 169 SAUDI ARABIA: RECLOSER MARKET, BY CONTROL TYPE, 2020–2023 (USD MILLION)
                                                        TABLE 170 SAUDI ARABIA: RECLOSER MARKET, BY CONTROL TYPE, 2024–2030 (USD MILLION)
                       10.5.1.3 UAE
                                   10.5.1.3.1 Rapid economic development and increasing demand for power to fuel market growth
                                                        TABLE 171 UAE: RECLOSER MARKET, BY PHASE, 2020–2023 (USD MILLION)
                                                        TABLE 172 UAE: RECLOSER MARKET, BY PHASE, 2024–2030 (USD MILLION)
                                                        TABLE 173 UAE: RECLOSER MARKET, BY CONTROL TYPE, 2020–2023 (USD MILLION)
                                                        TABLE 174 UAE: RECLOSER MARKET, BY CONTROL TYPE, 2024–2030 (USD MILLION)
                       10.5.1.4 Rest of GCC countries
                                   TABLE 175 REST OF GCC COUNTRIES: RECLOSER MARKET, BY PHASE, 2020–2023 (USD MILLION)
                                   TABLE 176 REST OF GCC COUNTRIES: RECLOSER MARKET, BY PHASE, 2024–2030 (USD MILLION)
                                   TABLE 177 REST OF GCC COUNTRIES: RECLOSER MARKET, BY CONTROL TYPE,  2020–2023 (USD MILLION)
                                   TABLE 178 REST OF GCC COUNTRIES: RECLOSER MARKET, BY CONTROL TYPE,  2024–2030 (USD MILLION)
                       10.5.1.5 South Africa
                                   10.5.1.5.1 Grid modernization initiative to fuel market growth
                                                        TABLE 179 SOUTH AFRICA: RECLOSER MARKET, BY PHASE, 2020–2023 (USD MILLION)
                                                        TABLE 180 SOUTH AFRICA: RECLOSER MARKET, BY PHASE, 2024–2030 (USD MILLION)
                                                        TABLE 181 SOUTH AFRICA: RECLOSER MARKET, BY CONTROL TYPE, 2020–2023 (USD MILLION)
                                                        TABLE 182 SOUTH AFRICA: RECLOSER MARKET, BY CONTROL TYPE, 2024–2030 (USD MILLION)
                       10.5.1.6 Nigeria
                                   10.5.1.6.1 Growing demand for renewable energy to drive market
                                                        TABLE 183 NIGERIA: RECLOSER MARKET, BY PHASE, 2020–2023 (USD MILLION)
                                                        TABLE 184 NIGERIA: RECLOSER MARKET, BY PHASE, 2024–2030 (USD MILLION)
                                                        TABLE 185 NIGERIA: RECLOSER MARKET, BY CONTROL TYPE, 2020–2023 (USD MILLION)
                                                        TABLE 186 NIGERIA: RECLOSER MARKET, BY CONTROL TYPE, 2024–2030 (USD MILLION)
                       10.5.1.7 Rest of Middle East & Africa
                                   TABLE 187 REST OF MIDDLE EAST & AFRICA: RECLOSER MARKET, BY PHASE,  2020–2023 (USD MILLION)
                                   TABLE 188 REST OF MIDDLE EAST & AFRICA: RECLOSER MARKET, BY PHASE,  2024–2030 (USD MILLION)
                                   TABLE 189 REST OF MIDDLE EAST & AFRICA: RECLOSER MARKET, BY CONTROL TYPE,  2020–2023 (USD MILLION)
                                   TABLE 190 REST OF MIDDLE EAST & AFRICA: RECLOSER MARKET, BY CONTROL TYPE,  2024–2030 (USD MILLION)
     10.6 SOUTH AMERICA 
             10.6.1 RECESSION IMPACT ON MARKET IN SOUTH AMERICA
                       TABLE 191 SOUTH AMERICA: RECLOSER MARKET, BY PHASE, 2020–2023 (USD MILLION)
                       TABLE 192 SOUTH AMERICA: RECLOSER MARKET, BY PHASE, 2024–2030 (USD MILLION)
                       TABLE 193 SOUTH AMERICA: RECLOSER MARKET, BY CONTROL TYPE, 2020–2023 (USD MILLION)
                       TABLE 194 SOUTH AMERICA: RECLOSER MARKET, BY CONTROL TYPE, 2024–2030 (USD MILLION)
                       TABLE 195 SOUTH AMERICA: RECLOSER MARKET, BY INSULATION MEDIUM,  2020–2023 (USD MILLION)
                       TABLE 196 SOUTH AMERICA: RECLOSER MARKET, BY INSULATION MEDIUM,  2024–2030 (USD MILLION)
                       TABLE 197 SOUTH AMERICA: RECLOSER MARKET, BY VOLTAGE RATING,  2020–2023 (USD MILLION)
                       TABLE 198 SOUTH AMERICA: RECLOSER MARKET SIZE, BY VOLTAGE RATING,  2024–2030 (USD MILLION)
                       TABLE 199 SOUTH AMERICA: RECLOSER MARKET, BY COUNTRY, 2020–2023 (USD MILLION)
                       TABLE 200 SOUTH AMERICA: RECLOSER MARKET SIZE, BY COUNTRY, 2024–2030 (USD MILLION)
                       10.6.1.1 Brazil
                                   10.6.1.1.1 Increasing electrification initiatives to boost demand
                                                        TABLE 201 BRAZIL: RECLOSER MARKET, BY PHASE, 2020–2023 (USD MILLION)
                                                        TABLE 202 BRAZIL: RECLOSER MARKET, BY PHASE, 2024–2030 (USD MILLION)
                                                        TABLE 203 BRAZIL: RECLOSER MARKET, BY CONTROL TYPE, 2020–2023 (USD MILLION)
                                                        TABLE 204 BRAZIL: RECLOSER MARKET, BY CONTROL TYPE, 2024–2030 (USD MILLION)
                       10.6.1.2 Argentina
                                   10.6.1.2.1 Thriving industrial sector to boost demand
                                                        TABLE 205 ARGENTINA: RECLOSER MARKET, BY PHASE, 2020–2023 (USD MILLION)
                                                        TABLE 206 ARGENTINA: RECLOSER MARKET, BY PHASE, 2024–2030 (USD MILLION)
                                                        TABLE 207 ARGENTINA: RECLOSER MARKET, BY CONTROL TYPE, 2020–2023 (USD MILLION)
                                                        TABLE 208 ARGENTINA: RECLOSER MARKET, BY CONTROL TYPE, 2024–2030 (USD MILLION)
                       10.6.1.3 Chile
                                   10.6.1.3.1 Advancements in power infrastructure to drive market
                                                        TABLE 209 CHILE: RECLOSER MARKET, BY PHASE, 2020–2023 (USD MILLION)
                                                        TABLE 210 CHILE: RECLOSER MARKET, BY PHASE, 2024–2030 (USD MILLION)
                                                        TABLE 211 CHILE: RECLOSER MARKET, BY CONTROL TYPE, 2020–2023 (USD MILLION)
                                                        TABLE 212 CHILE: RECLOSER MARKET, BY CONTROL TYPE, 2024–2030 (USD MILLION)
                       10.6.1.4 Rest of South America
                                   TABLE 213 REST OF SOUTH AMERICA: RECLOSER MARKET, BY PHASE, 2020–2023 (USD MILLION)
                                   TABLE 214 REST OF SOUTH AMERICA: RECLOSER MARKET, BY PHASE, 2024–2030 (USD MILLION)
                                   TABLE 215 REST OF SOUTH AMERICA: RECLOSER MARKET, BY CONTROL TYPE,  2020–2023 (USD MILLION)
                                   TABLE 216 REST OF SOUTH AMERICA: RECLOSER MARKET, BY CONTROL TYPE,  2024–2030 (USD MILLION)
 
11 COMPETITIVE LANDSCAPE (Page No. - 193)
     11.1 OVERVIEW 
     11.2 MAJOR STRATEGIES ADOPTED BY KEY PLAYERS, 2020–2024 
               TABLE 217 OVERVIEW OF KEY STRATEGIES ADOPTED BY TOP PLAYERS, APRIL 2020–FEBRUARY 2024
     11.3 MARKET SHARE ANALYSIS OF TOP 5 PLAYERS, 2023 
               TABLE 218 RECLOSER MARKET: DEGREE OF COMPETITION, 2023
               FIGURE 49 RECLOSER MARKET SHARE ANALYSIS, 2023
     11.4 REVENUE ANALYSIS OF TOP 4 MARKET PLAYERS, 2018–2022 
               FIGURE 50 FIVE-YEAR REVENUE ANALYSIS OF TOP PLAYERS IN RECLOSER MARKET,  2018–2022
     11.5 COMPANY EVALUATION MATRIX: KEY PLAYERS, 2023 
             11.5.1 STARS
             11.5.2 PERVASIVE PLAYERS
             11.5.3 EMERGING LEADERS
             11.5.4 PARTICIPANTS
                       FIGURE 51 RECLOSER MARKET: COMPANY EVALUATION MATRIX (KEY PLAYERS), 2023
     11.6 COMPANY FOOTPRINT: KEY PLAYERS 
               FIGURE 52 RECLOSER MARKET: COMPANY FOOTPRINT
             11.6.1 PHASE FOOTPRINT
                       TABLE 219 COMPANY FOOTPRINT: BY PHASE
             11.6.2 CONTROL TYPE FOOTPRINT
                       TABLE 220 COMPANY FOOTPRINT: BY CONTROL TYPE
             11.6.3 INSULATION MEDIUM FOOTPRINT
                       TABLE 221 COMPANY FOOTPRINT: BY INSULATION MEDIUM
             11.6.4 VOLTAGE RATING FOOTPRINT
                       TABLE 222 COMPANY FOOTPRINT: BY VOLTAGE RATING
             11.6.5 REGION FOOTPRINT
                       TABLE 223 COMPANY FOOTPRINT: BY REGION
     11.7 COMPANY EVALUATION MATRIX: STARTUPS/SMES, 2023 
             11.7.1 PROGRESSIVE COMPANIES
             11.7.2 RESPONSIVE COMPANIES
             11.7.3 DYNAMIC COMPANIES
             11.7.4 STARTING BLOCKS
                       FIGURE 53 RECLOSER MARKET: COMPANY EVALUATION MATRIX (STARTUPS/SMES), 2023
             11.7.5 COMPETITIVE BENCHMARKING, STARTUPS/SMES, 2023
                       11.7.5.1 Detailed list of startups/SMEs
                                   TABLE 224 RECLOSER MARKET: LIST OF KEY STARTUPS/SMES
             11.7.6 COMPETITIVE BENCHMARKING OF KEY STARTUPS/SMES
                       TABLE 225 RECLOSER MARKET: COMPETITIVE BENCHMARKING OF KEY PLAYERS  (STARTUPS/SMES)
     11.8 COMPANY VALUATION AND FINANCIAL METRICS 
               FIGURE 54 EV/EBITDA OF KEY VENDORS
               FIGURE 55 COMPANY VALUATION OF KEY VENDORS
             11.8.1 BRAND/PRODUCT COMPARISON
                       FIGURE 56 BRAND/PRODUCT COMPARISON OF KEY VENDORS
     11.9 COMPETITIVE SCENARIO AND TRENDS 
             11.9.1 PRODUCT LAUNCHES
                       TABLE 226 RECLOSER MARKET: PRODUCT LAUNCHES, APRIL 2020–FEBRUARY 2024
             11.9.2 DEALS
                       TABLE 227 RECLOSER MARKET: DEALS, APRIL 2020–FEBRUARY 2024
             11.9.3 EXPANSIONS
                       TABLE 228 RECLOSER MARKET: EXPANSIONS, APRIL 2020–FEBRUARY 2024
             11.9.4 OTHERS
                       TABLE 229 RECLOSER MARKET: OTHERS, APRIL 2020–FEBRUARY 2024
 
12 COMPANY PROFILES (Page No. - 220)
(Business Overview, Products Offered, Recent Developments, MnM View Right to win, Strategic choices made, Weaknesses and competitive threats) *
     12.1 KEY PLAYERS 
             12.1.1 ABB
                       TABLE 230 ABB: COMPANY OVERVIEW
                       FIGURE 57 ABB: COMPANY SNAPSHOT
                       TABLE 231 ABB: PRODUCTS/SERVICES/SOLUTIONS OFFERED
                       TABLE 232 ABB: DEALS
                       TABLE 233 ABB: OTHERS
             12.1.2 EATON CORPORATION
                       TABLE 234 EATON CORPORATION: COMPANY OVERVIEW
                       FIGURE 58 EATON CORPORATION: COMPANY SNAPSHOT
                       TABLE 235 EATON CORPORATION: PRODUCTS/SERVICES/SOLUTIONS OFFERED
                       TABLE 236 EATON CORPORATION: PRODUCT LAUNCHES
                       TABLE 237 EATON CORPORATION: DEALS
                       TABLE 238 EATON CORPORATION: OTHERS
             12.1.3 SCHNEIDER ELECTRIC
                       TABLE 239 SCHNEIDER ELECTRIC: COMPANY OVERVIEW
                       FIGURE 59 SCHNEIDER ELECTRIC: COMPANY SNAPSHOT
                       TABLE 240 SCHNEIDER ELECTRIC: PRODUCTS/SERVICES/SOLUTIONS OFFERED
                       TABLE 241 SCHNEIDER ELECTRIC: DEALS
                       TABLE 242 SCHNEIDER ELECTRIC: OTHERS
             12.1.4 SIEMENS
                       TABLE 243 SIEMENS: COMPANY OVERVIEW
                       FIGURE 60 SIEMENS: COMPANY SNAPSHOT
                       TABLE 244 SIEMENS: PRODUCTS/SERVICES/SOLUTIONS OFFERED
                       TABLE 245 SIEMENS: DEALS
                       TABLE 246 SIEMENS: OTHERS
             12.1.5 NOJA POWER SWITCHGEAR PTY LTD
                       TABLE 247 NOJA POWER SWITCHGEAR PTY LTD: COMPANY OVERVIEW
                       TABLE 248 NOJA POWER SWITCHGEAR PTY LTD: PRODUCTS/SERVICES/SOLUTIONS OFFERED
                       TABLE 249 NOJA POWER SWITCHGEAR PTY LTD: PRODUCT LAUNCHES
                       TABLE 250 NOJA POWER SWITCHGEAR PTY LTD: OTHERS
             12.1.6 GENERAL ELECTRIC
                       TABLE 251 GENERAL ELECTRIC: COMPANY OVERVIEW
                       FIGURE 61 GENERAL ELECTRIC: COMPANY SNAPSHOT
                       TABLE 252 GENERAL ELECTRIC: PRODUCTS/SERVICES/SOLUTIONS OFFERED
                       TABLE 253 GENERAL ELECTRIC: OTHERS
                       TABLE 254 GENERAL ELECTRIC: DEALS
             12.1.7 HUBBELL
                       TABLE 255 HUBBELL: COMPANY OVERVIEW
                       FIGURE 62 HUBBELL: COMPANY SNAPSHOT
                       TABLE 256 HUBBELL: PRODUCTS/SERVICES/SOLUTIONS OFFERED
             12.1.8 S&C ELECTRIC COMPANY
                       TABLE 257 S&C ELECTRIC COMPANY: COMPANY OVERVIEW
                       TABLE 258 S&C ELECTRIC COMPANY: PRODUCTS/SERVICES/SOLUTIONS OFFERED
                       TABLE 259 S&C ELECTRIC COMPANY: DEALS
                       TABLE 260 S&C ELECTRIC COMPANY: OTHERS
             12.1.9 TAVRIDA ELECTRIC
                       TABLE 261 TAVRIDA ELECTRIC: COMPANY OVERVIEW
                       TABLE 262 TAVRIDA ELECTRIC: PRODUCTS/SERVICES/SOLUTIONS OFFERED
                       TABLE 263 TAVRIDA ELECTRIC: OTHERS
             12.1.10 ENTEC ELECTRIC & ELECTRONIC
                                   TABLE 264 ENTEC ELECTRIC & ELECTRONIC: COMPANY OVERVIEW
                                   TABLE 265 ENTEC ELECTRIC & ELECTRONIC: PRODUCTS/SERVICES/SOLUTIONS OFFERED
             12.1.11 G&W ELECTRIC
                                   TABLE 266 G&W ELECTRIC: COMPANY OVERVIEW
                                   TABLE 267 G&W ELECTRIC: PRODUCTS/SERVICES/SOLUTIONS OFFERED
                                   TABLE 268 G&W ELECTRIC: PRODUCT LAUNCHES
                                   TABLE 269 G&W ELECTRIC: DEALS
             12.1.12 ARTECHE GROUP
                                   TABLE 270 ARTECHE GROUP: COMPANY OVERVIEW
                                   FIGURE 63 ARTECHE GROUP: COMPANY SNAPSHOT
                                   TABLE 271 ARTECHE GROUP: PRODUCTS/SERVICES/SOLUTIONS OFFERED
                                   TABLE 272 ARTECHE GROUP: DEALS
             12.1.13 GHORIT ELECTRICAL CO., LTD.
                                   TABLE 273 GHORIT ELECTRICAL CO., LTD.: COMPANY OVERVIEW
                                   TABLE 274 GHORIT ELECTRICAL CO., LTD.: PRODUCTS/SERVICES/SOLUTIONS OFFERED
             12.1.14 ILJIN ELECTRIC
                                   TABLE 275 ILJIN ELECTRIC: COMPANY OVERVIEW
                                   TABLE 276 ILJIN ELECTRIC: PRODUCTS/SERVICES/SOLUTIONS OFFERED
             12.1.15 HUGHES POWER SYSTEM
                                   TABLE 277 HUGHES POWER SYSTEM: COMPANY OVERVIEW
                                   TABLE 278 HUGHES POWER SYSTEM: PRODUCTS/SERVICES/SOLUTIONS OFFERED
             12.1.16 WASION HOLDINGS INTERNATIONAL
                                   TABLE 279 WASION HOLDINGS INTERNATIONAL: COMPANY OVERVIEW
                                   FIGURE 64 WASION HOLDINGS INTERNATIONAL: COMPANY SNAPSHOT
                                   TABLE 280 WASION HOLDINGS INTERNATIONAL: PRODUCTS/SERVICES/SOLUTIONS OFFERED
                                   TABLE 281 WASION HOLDINGS INTERNATIONAL: OTHERS
     12.2 OTHER PLAYERS 
             12.2.1 BEIJING SOJO ELECTRIC CO., LTD.
             12.2.2 NIKUM ENERGY CONTROL (INDIA) LTD.
             12.2.3 SHINSUNG INDUSTRIAL ELECTRIC CO., LTD.
             12.2.4 HUAYI ELECTRIC CO., LTD.
             12.2.5 SCHWEITZER ENGINEERING LABORATORIES, INC.
             12.2.6 ACTOM
             12.2.7 GEYA ELECTRICAL EQUIPMENT SUPPLY
             12.2.8 WENZHOU ROCKWILL ELECTRIC CO., LTD.
             12.2.9 EFACEC
             12.2.10 STELMEC
*Details on Business Overview, Products Offered, Recent Developments, MnM View, Right to win, Strategic choices made, Weaknesses and competitive threats might not be captured in case of unlisted companies.
 
13 APPENDIX (Page No. - 280)
     13.1 INSIGHTS FROM INDUSTRY EXPERTS 
     13.2 DISCUSSION GUIDE 
     13.3 KNOWLEDGESTORE: MARKETSANDMARKETS’  SUBSCRIPTION PORTAL 
     13.4 CUSTOMIZATION OPTIONS 
     13.5 RELATED REPORTS 
     13.6 AUTHOR DETAILS 

This study encompassed significant efforts in determining the present size of the recloser market. It commenced with a thorough secondary research process to gather data related to the market, similar markets, and the overarching industry. Subsequently, these findings, assumptions, and market size calculations were rigorously validated by consulting industry experts across the entire supply chain through primary research. The total market size was assessed by conducting an analysis specific to each country. Following that, the market was further dissected, and the data was cross-referenced to estimate the size of various segments and sub-segments within the market.

Secondary Research

In this research study, a wide range of secondary sources were utilized, including directories, databases, and reputable references such as Hoover's, Bloomberg BusinessWeek, Factiva, World Bank, the US Department of Energy (DOE), and the International Energy Agency (IEA). These sources played a crucial role in gathering valuable data for a comprehensive analysis of the global recloser market, covering technical, market-oriented, and commercial aspects. Additional secondary sources included annual reports, press releases, investor presentations, whitepapers, authoritative publications, articles authored by well-respected experts, information from industry associations, trade directories, and various database resources.

Primary Research

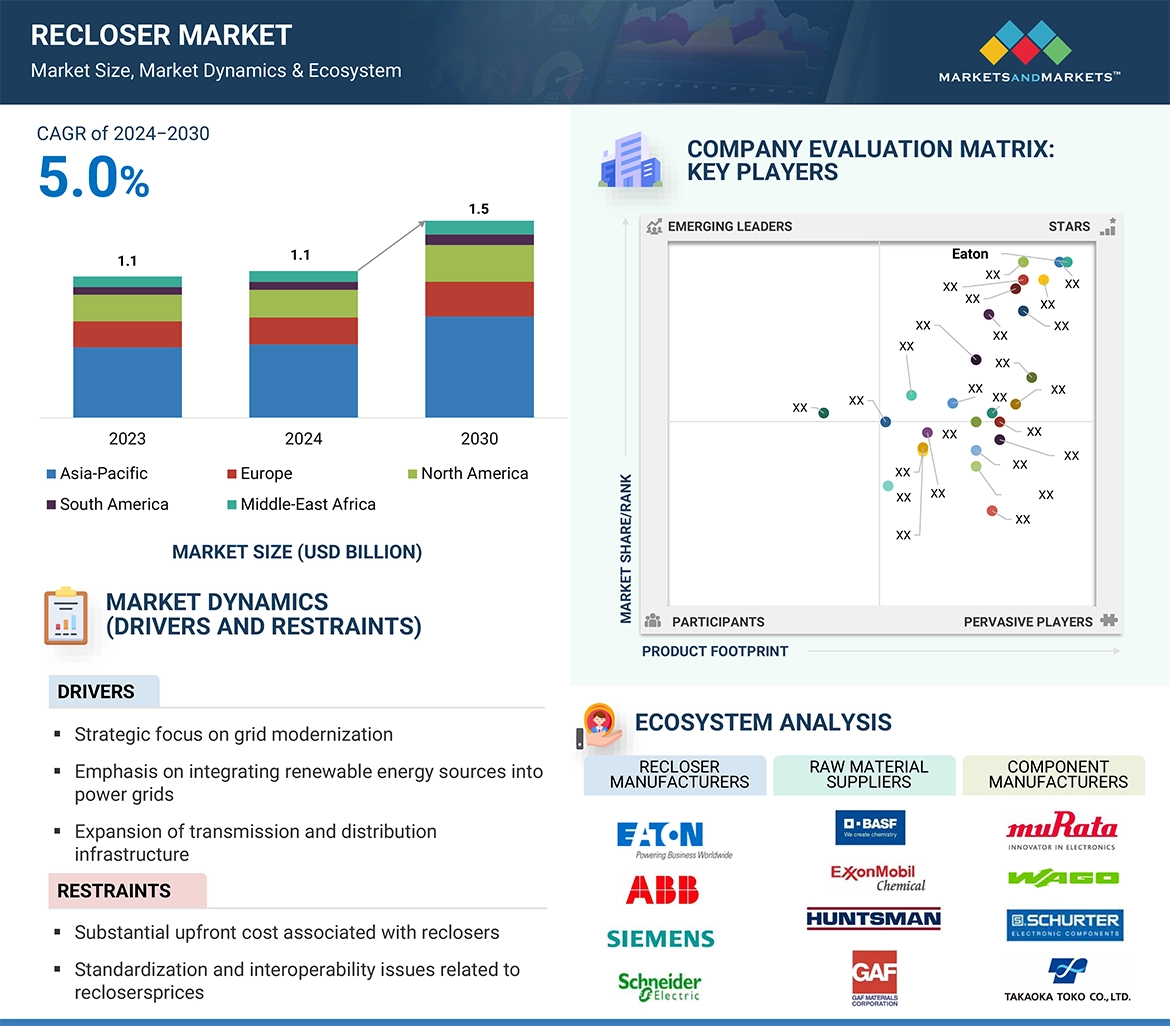
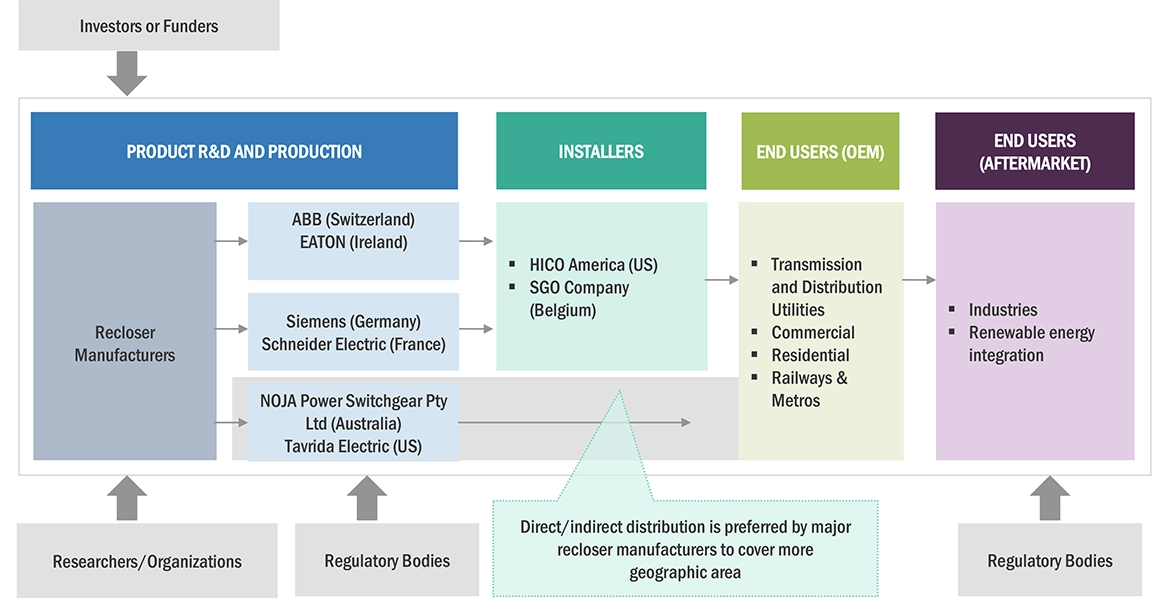
The recloser market involves a range of stakeholders, including component manufacturers, product manufacturers/assemblers, distributors, and end users within the supply chain. The demand for this market is primarily driven by end users such as transmission and distribution utilities, commercial and residential sectors, and industries. Additionally, the increasing demand from railways and metros contributes to market growth. On the supply side, there is a notable trend of heightened demand for contracts from the industrial sector and a significant presence of mergers and acquisitions among major players.

To gather qualitative and quantitative insights, various primary sources from both the supply and demand sides of the market were interviewed. The following breakdown presents the primary respondents involved in the research study.

Recloser  Market Size, and Share

To know about the assumptions considered for the study, download the pdf brochure

Market Size Estimation

The estimation and validation of the recloser market size have been conducted using a bottom-up approach. This approach was rigorously employed to ascertain the dimensions of multiple subsegments within the market. The research process comprises the following key stages.

  • In this method, the production statistics for each type of recloser have been examined at both the country and regional levels.
  • Thorough secondary and primary research has been conducted to gain a comprehensive understanding of the global market landscape for various segments of reclosers.
  • Numerous primary interviews have been undertaken with key experts in the field of recloser development, encompassing important OEMs and Tier I suppliers.
  • When calculating and forecasting the market size, qualitative factors such as market drivers, limitations, opportunities, and challenges have been taken into account.

Global Recloser Market Size: Bottom-Up Approach

Recloser  Market Bottom Up Approach

To know about the assumptions considered for the study, Request for Free Sample Report

Data Triangulation

The process of determining the overall market size involved the methodologies described earlier, followed by segmenting the market into multiple segments and subsegments. To finalize the comprehensive market analysis and obtain precise statistics for each market segment and subsegment, data triangulation and market segmentation techniques were applied, as appropriate. Data triangulation was accomplished by examining various factors and trends from both the demand and supply perspectives within the ecosystem of the recloser market.

Market Definition

In the power distribution industry, a recloser can be defined as an automatic circuit interrupting device specifically designed for medium voltage applications.  Unlike traditional circuit breakers requiring manual intervention, reclosers are equipped with sensors that detect faults on the power line. Upon detecting a fault, they automatically interrupt the current flow using an arc quenching mechanism, typically oil or a vacuum.  However, a key distinction sets reclosers apart: they incorporate an automatic reclosing sequence. This attempts to re-energize the line after a pre-programmed timeframe, aiming to clear temporary faults while isolating persistent ones. This automated process minimizes outage durations for unaffected customers on healthy phases of the line. Reclosers are strategically placed within medium voltage distribution networks, typically ranging from 15 kV to 38 kV. Their deployment can be found on distribution feeders, overhead lines, and even within substations where they work in conjunction with other switchgear for comprehensive protection.

Key Stakeholders

  • Government and research organizations
  • State and national regulatory authorities
  • Organizations, forums, alliances, and associations
  • Institutional investors
  • Investors/shareholders
  • Environmental research institutes
  • Integrated device manufacturers (IDMs)
  • Recloser raw material and component manufacturers
  • Recloser manufacturers, dealers, and suppliers
  • Power utilities and other end users
  • Consulting companies in the energy and power domain
  • Investment banks

Objectives of the Study

  • To describe and forecast the recloser market, in terms of value, by phase, control type, voltage rating, insulation medium, and region
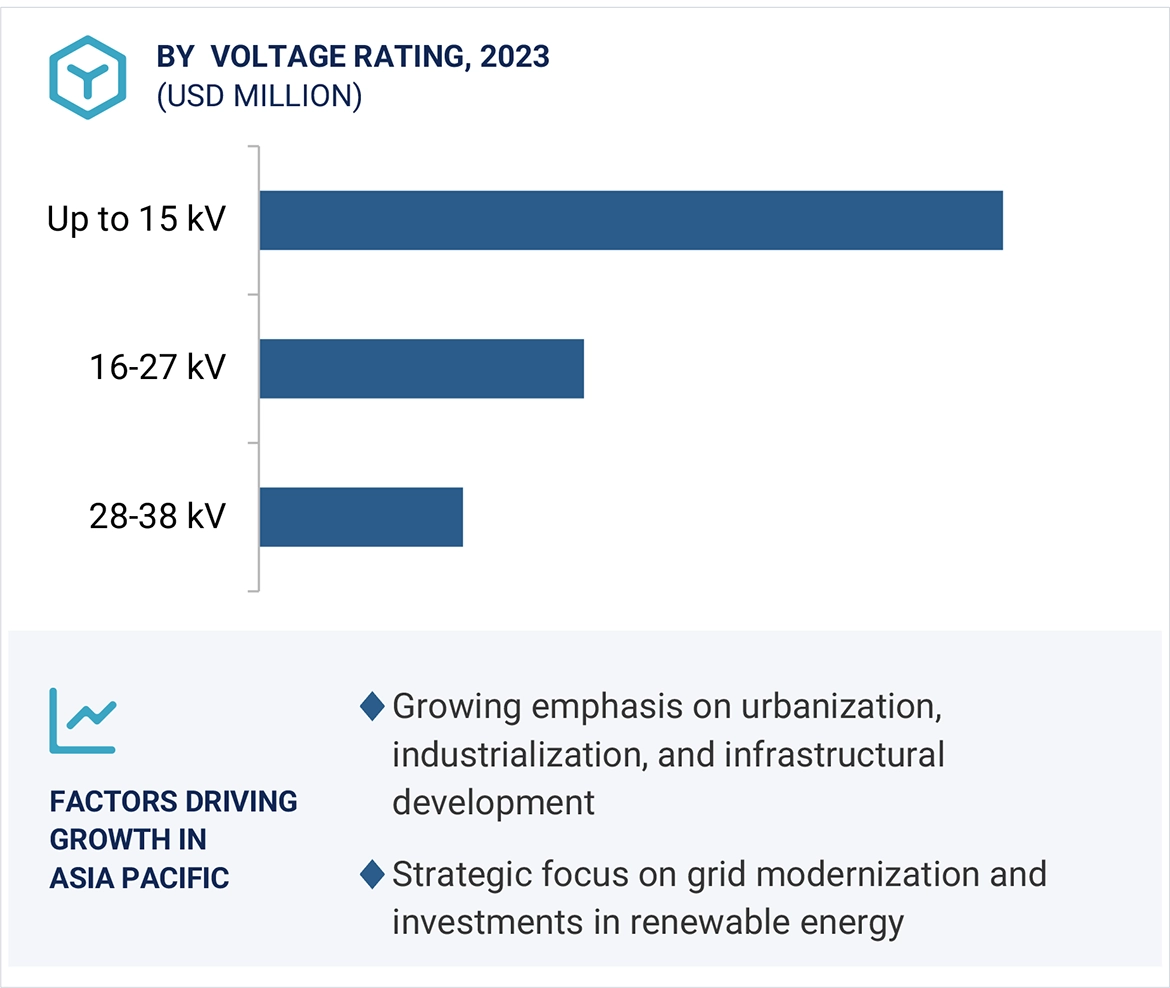
  • To forecast the recloser market, in terms of volume, by voltage rating
  • To forecast the market for various segments, in terms of value, with regard to five regions: North America, South America, Europe, Asia Pacific, and the Middle East & Africa, along with their key countries
  • To provide detailed information about the key factors, such as drivers, restraints, opportunities, and challenges, influencing the market’s growth
  • To strategically analyze the subsegments with respect to individual growth trends, prospects, and contributions of each segment to the overall market size
  • To study the complete supply chain and allied industry segments and perform a supply chain analysis of the recloser landscape
  • To strategically analyze the regulatory landscape, tariff, standards, patents, Porter’s five forces, import and export scenarios, trade values, and case studies pertaining to the market under study
  • To analyze the opportunities in the market for various stakeholders by identifying the high-growth segments of the recloser market
  • To profile the key players and comprehensively analyze their market position in terms of ranking and core competencies1, along with detailing the competitive landscape for the market leaders
  • To analyze competitive developments such as agreements, partnerships, product launches, acquisitions, contracts, expansions, and investments in the recloser market

Available Customization

With the given market data, MarketsandMarkets offers customizations based on the company’s specific needs. The following customization options are available for the report:

Product Analysis

  • Product Matrix, which provides a detailed comparison of the product portfolio of each company

Company Information

  • Detailed analyses and profiling of additional market players (up to 5)
Custom Market Research Services

We will customize the research for you, in case the report listed above does not meet with your exact requirements. Our custom research will comprehensively cover the business information you require to help you arrive at strategic and profitable business decisions.

Request Customization

Instant Answers with GPT - Ask Now!

Ask real questions. Get complete answers !
Report Code
EP 3580
Published ON
Mar, 2024
Choose License Type
BUY NOW
  • SHARE
X
Request Customization
Speak to Analyst
Speak to Analyst
OR FACE-TO-FACE MEETING
PERSONALIZE THIS RESEARCH
  • Triangulate with your Own Data
  • Get Data as per your Format and Definition
  • Gain a Deeper Dive on a Specific Application, Geography, Customer or Competitor
  • Any level of Personalization
REQUEST A FREE CUSTOMIZATION
LET US HELP YOU!
  • What are the Known and Unknown Adjacencies Impacting the Recloser Market
  • What will your New Revenue Sources be?
  • Who will be your Top Customer; what will make them switch?
  • Defend your Market Share or Win Competitors
  • Get a Scorecard for Target Partners
CUSTOMIZED WORKSHOP REQUEST
+1-888-600-6441
  • Call Us
  • +1-888-600-6441 (Corporate office hours)
  • +1-888-600-6441 (US/Can toll free)
  • +44-800-368-9399 (UK office hours)
CONNECT WITH US
ABOUT TRUST ONLINE
©2024 MarketsandMarkets Research Private Ltd. All rights reserved
DMCA.com Protection Status Website Feedback