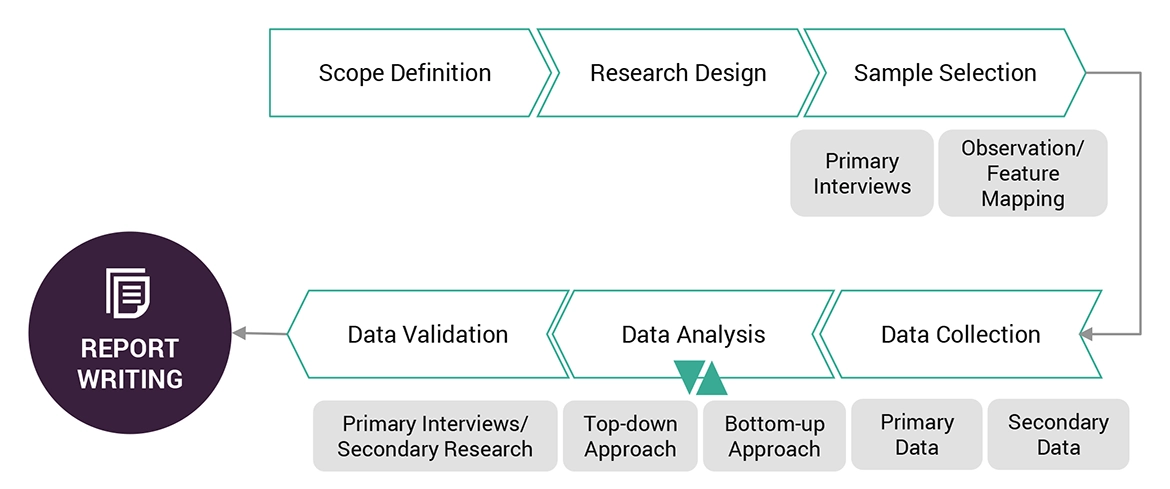
The study involved four major activities in estimating the size of the RF signal chain components market. Exhaustive secondary research has been done to collect information on the market, peer market, and parent market. Validation of these findings, assumptions, and sizing with industry experts across the value chain through primary research has been the next step. Both top-down and bottom-up approaches have been employed to estimate the global market size. After that, market breakdown and data triangulation have been used to estimate the market sizes of segments and subsegments.
Secondary Research
Secondary sources that were referred to for this research study include corporate filings (such as annual reports, investor presentations, and financial statements); trade, business, and professional associations; white papers; certified publications; articles from recognized authors; directories; and databases. Secondary data was collected and analyzed to arrive at the overall market size, further validated by primary research.
Primary Research
Extensive primary research was conducted after understanding and analyzing the RF signal chain components market scenario through the secondary research process. Several primary interviews were conducted with key opinion leaders from both the demand- and supply-side vendors across four major regions—North America, Asia Pacific, Europe, and RoW (including the Middle East & Africa and South America).
After interacting with industry experts, brief sessions were conducted with highly experienced independent consultants to reinforce the findings from our primaries. This, along with the in-house subject matter experts’ opinions, has led us to the findings as described in the remainder of this report.

To know about the assumptions considered for the study, download the pdf brochure
Market Size Estimation
In this report, both the top-down and bottom-up approaches were used to estimate and validate the RF signal chain components market size along with the size of various other dependent submarkets. The key players in the RF signal chain components market were identified through secondary research, and their market shares in the respective regions were determined through primary and secondary research processes. This entire research methodology includes the study of annual and financial reports of top players, as well as interviews with experts such as CEOs, VPs, directors, and marketing executives to obtain key insights (both quantitative and qualitative). All percentage shares, splits, and breakdowns were determined using secondary sources and verified through primary sources. All the possible parameters that affect the markets covered in this research study were accounted for, viewed in detail, verified through primary research, and analyzed to obtain the final quantitative and qualitative data. This data was consolidated and supplemented with detailed inputs and analysis from MarketsandMarkets, and finally, the data was presented in this report.
This data was consolidated, supplemented with detailed inputs and analysis from MarketsandMarkets, and presented in this report.
Market Size Estimation Methodology-Bottom-Up Approach
The bottom-up approach was employed to arrive at the overall size of the RF signal chain components market from the shipment. The overall market size was calculated by adding the revenues derived by multiplying the average selling prices of all the RF signal chain components by their respective shipments.

Data Triangulation
After arriving at the overall market size through the process explained earlier, the total market was split into several segments. The market breakdown and data triangulation procedures were employed, wherever applicable, to complete the overall market engineering process and arrive at the exact statistics for all the segments and subsegments. The data was triangulated by studying various factors and trends from both the demand and supply sides. The market was validated using both the top-down and bottom-up approaches.
Market Definition
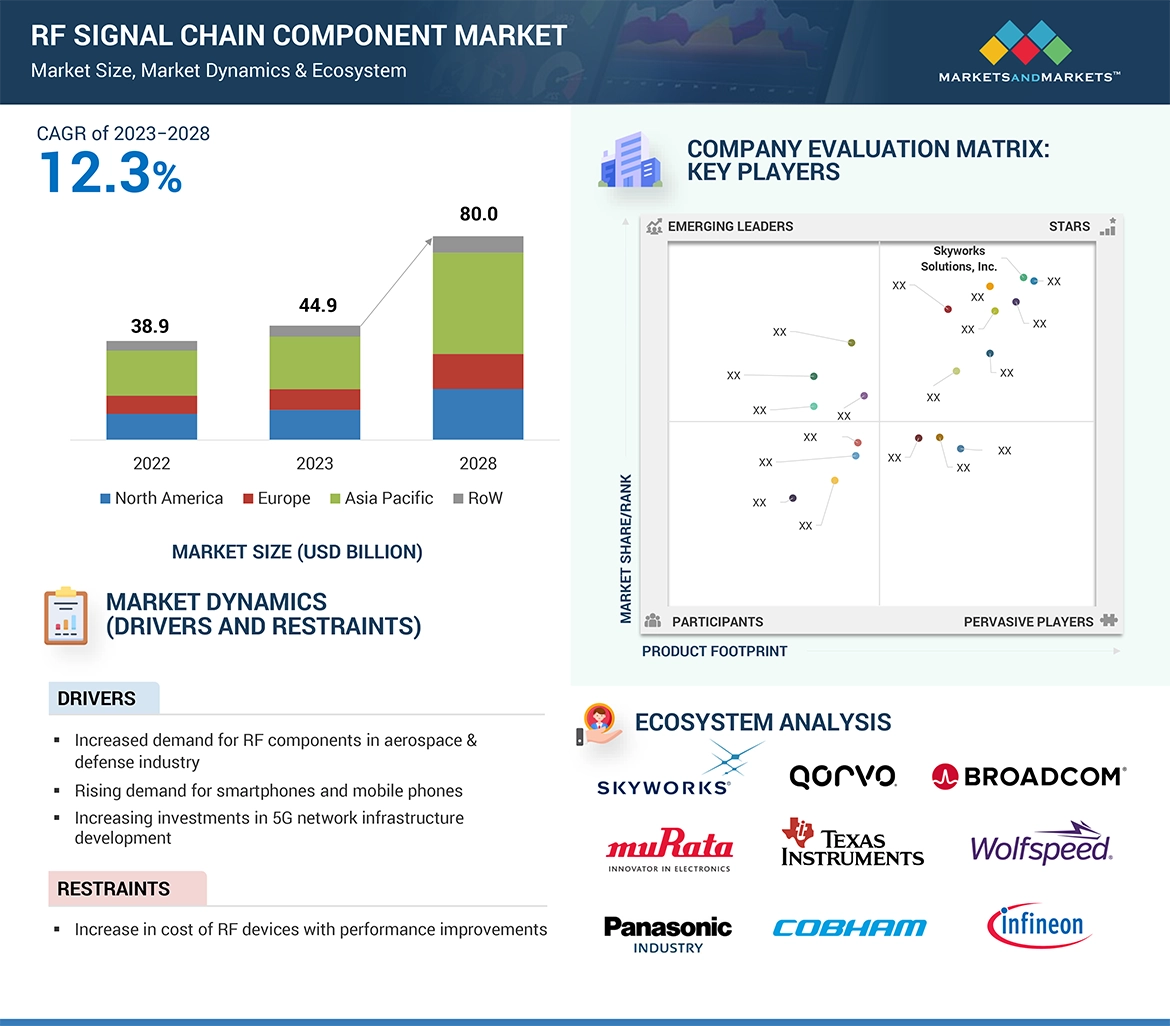
Radio frequency (RF) signals are electromagnetic signals that have a frequency within the radio frequency spectrum. The radio frequency spectrum typically ranges from 3 KHz to 300 GHz. RF signals are a type of electromagnetic radiation and are used for wireless communication in various applications, including radio and television broadcasting, cellular communication, Wi-Fi, Bluetooth, radar,among others.
Key Statekeholders
-
Raw material suppliers
-
Electronic design automation (EDA) and design tool vendors
-
Original equipment manufacturers (OEMs)
-
Integrated device manufacturers (IDMs)
-
Original design manufacturers (ODMs)
-
ODM and OEM technology and solution providers
-
Assembly, testing, and packaging vendors
-
Technology, service, and solution providers
-
Intellectual property (IP) core and license providers
-
Suppliers and distributors
-
Government and other regulatory bodies
-
Technology investors
-
Research institutes and organizations
-
Market research and consulting firms
Report Objectives
-
To describe and forecast the size of the RF signal chain components market, in terms of value, based on product, frequency band, material type, and application
-
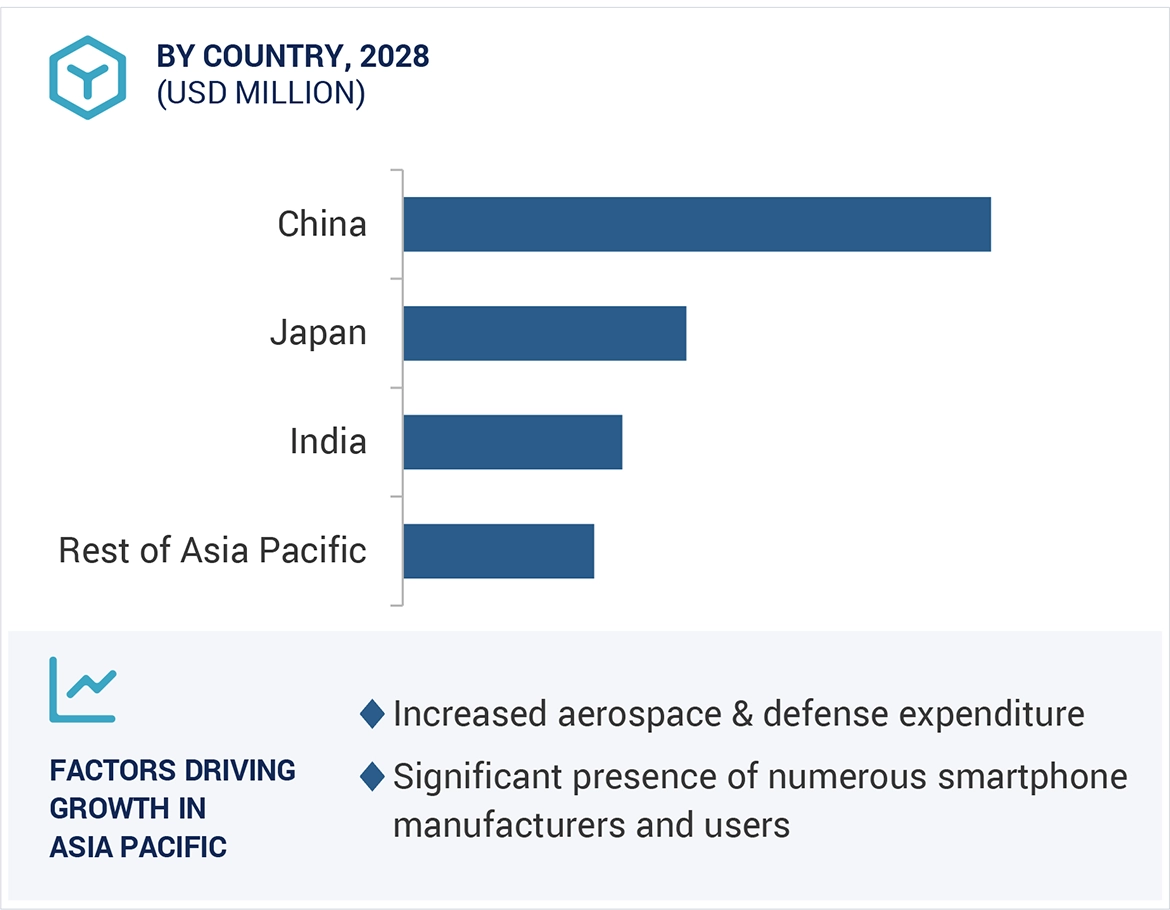
To forecast the sizes of various segments with respect to four major regions—North America, Europe, Asia Pacific, and Rest of the World (RoW)
-
To provide a detailed analysis of the RF signal chain components supply chain
-
To strategically analyze the micromarkets1 with respect to individual growth trends and prospects and their contributions to the total market
-
To analyze the opportunities for market players and provide details of the competitive landscape of the market
-
To strategically profile the key players and comprehensively analyze their market rankings and core competencies2
-
To provide details regarding the drivers, restraints, opportunities, and challenges influencing the growth of the market
-
To analyze the competitive developments in the market, such as acquisitions, product launches, partnerships, collaborations, and agreements
Available Customizations:
MarketsandMarkets offers the following customizations for this market report:
-
Further breakdown of the market in different regions to the country-level
-
Detailed analysis and profiling of additional market players (up to 5)


Growth opportunities and latent adjacency in RF Signal Chain Component Market