Ring Main Unit Market

Ring Main Unit Market by Insulation Type (Gas-insulated, Air-insulated, Oil-insulated, Solid Dielectric), Voltage Rating (Up to 15 kV, 16-25 kV, Above 25 kV), Installation (Indoor, Outdoor), Structure, Application, Region - Global Forecast to 2029

Report Code: EP 4041 Jun, 2024, by marketsandmarkets.com

[273 Pages Report] The global ring main unit market is anticipated to expand significantly, reaching USD 3.4 billion by 2029, up from USD 2.5 billion in 2024, reflecting a compound annual growth rate (CAGR) of 5.7% during the forecast period. This growth trajectory is fueled by several factors, including escalating capacity additions and improvement initiatives within distribution networks, alongside ongoing modernization endeavors targeting existing power infrastructure worldwide. The market's upward trajectory is underpinned by the increasing need for reliable and efficient power distribution solutions to meet rising electricity demand spurred by urbanization, industrialization, and the integration of renewable energy sources into the grid. As stakeholders prioritize grid reliability and efficiency, the demand for ring main units continues to rise, positioning the market for substantial growth opportunities in the coming years.

Ring Main Unit Market

To know about the assumptions considered for the study, Request for Free Sample Report

Ring Main Unit Market Opportunities

To know about the assumptions considered for the study, download the pdf brochure

Ring main unit Market Dynamics

Driver: Focus on the strengthening of power distribution infrastructure.

The strengthening of power distribution infrastructure serves as a significant driver propelling the global ring main unit (RMU) market forward. With the increasing demand for electricity driven by urbanization, industrialization, and population growth, there is a pressing need to enhance the reliability, efficiency, and resilience of power distribution networks. As a result, utilities and grid operators worldwide are undertaking extensive initiatives to upgrade and modernize their distribution infrastructure. One key aspect of this modernization effort involves the expansion and optimization of distribution networks to accommodate growing electricity demand and integrate renewable energy sources effectively. Ring main units play a crucial role in this process by facilitating the efficient distribution of power, enabling quick fault detection, isolation, and restoration. By strategically deploying RMUs within distribution networks, utilities can enhance grid reliability, minimize downtime, and improve overall system performance. Advancements in technology are driving the adoption of smart grid solutions, further fueling the demand for RMUs. These intelligent systems leverage advanced monitoring, control, and communication capabilities to optimize grid operations, enhance asset management, and support the integration of distributed energy resources. RMUs equipped with smart functionalities enable utilities to remotely monitor network conditions, identify potential issues in real-time, and implement proactive measures to mitigate disruptions and ensure continuous power supply to consumers. The modernization of power distribution infrastructure includes efforts to improve grid resiliency and withstand extreme weather events, natural disasters, and cyber threats.

Restraints: Emission regulations restricting the use of SF6.

The tightening emission regulations restricting the use of sulfur hexafluoride (SF6) emerge as a significant restraint for the global ring main unit (RMU) market. SF6 gas has long been favored as an insulation medium in RMUs due to its excellent dielectric properties and thermal conductivity, enabling compact design and efficient operation. However, SF6 is a potent greenhouse gas with a high global warming potential, prompting regulatory authorities worldwide to impose stringent restrictions on its usage to mitigate environmental impact. These regulatory measures aim to curb the emissions of SF6 and reduce its contribution to climate change. As a result, governments and environmental agencies have implemented regulations mandating the phase-out or reduction of SF6 in various applications, including electrical equipment such as RMUs. For instance, the European Union's F-Gas Regulation imposes quotas and bans on the use of SF6, incentivizing the transition to alternative, environmentally-friendly insulation gases. For RMU manufacturers and users, compliance with emission regulations poses several challenges. Firstly, the transition to alternative insulation gases necessitates significant investment in research and development to develop new RMU designs compatible with environmentally-friendly alternatives. Additionally, ensuring the safety, reliability, and performance of RMUs with alternative insulation gases requires rigorous testing, certification, and validation processes. Moreover, the transition away from SF6 may impact the cost and availability of RMUs, as alternative insulation gases may have different material properties and performance characteristics. This could result in higher manufacturing costs and longer lead times for RMU production, potentially affecting market competitiveness and profitability.

Opportunities:  Growing deployment of smart grids and digitization.

The growing deployment of smart grids and digitization presents a significant opportunity for the global ring main unit (RMU) market. Smart grids leverage advanced digital technologies, such as sensors, communication networks, and data analytics, to optimize grid operations, enhance reliability, and support the integration of renewable energy sources and electric vehicles. RMUs, with their critical role in power distribution networks, are integral components of smart grid infrastructure. By incorporating smart functionalities into RMUs, utilities can unlock new capabilities, such as remote monitoring, fault detection, and predictive maintenance. These smart RMUs enable real-time monitoring of network conditions, allowing utilities to proactively identify and address issues, minimize downtime, and optimize grid performance. Furthermore, digitization enhances the interoperability and communication capabilities of RMUs, enabling seamless integration with other grid components and control systems. As utilities worldwide increasingly embrace smart grid initiatives to modernize their infrastructure and improve operational efficiency, the demand for advanced RMUs equipped with smart features is expected to surge, creating lucrative growth opportunities for market players.

Challenges: High competition from players of the unorganized sector.

High competition from players in the unorganized sector poses a notable challenge for the global ring main unit (RMU) market. While established players dominate the market with their extensive product portfolios, brand recognition, and global reach, the presence of numerous unorganized players introduces competitive pressures, particularly in price-sensitive markets. These unorganized players often offer RMUs at lower prices, leveraging cost advantages such as reduced overheads and production expenses. Additionally, they may target niche or regional markets overlooked by larger players, further intensifying competition. Moreover, the lack of stringent quality standards and certifications in the unorganized sector may result in inconsistent product quality and reliability, posing risks to end-users and undermining confidence in the overall market. Addressing this challenge requires established players to differentiate themselves through product innovation, quality assurance measures, and strategic partnerships to maintain their competitive edge and mitigate the impact of unorganized competition. Additionally, regulatory initiatives aimed at standardizing product quality and ensuring compliance with safety and performance standards can help level the playing field and foster a more sustainable competitive environment in the RMU market.

Ring Main Unit Market Ecosystem

The ring main unit market is characterised by the presence of well-established, financially stable companies with significant experience in producing ring main unit and related components. These companies are well-established in the market and offer a diverse range of products. Utilizing cutting-edge technologies, they uphold vast international networks for sales and marketing. Some of the leading companies in this market are ABB (Switzerland), Siemens (Germany), Schneider Electric (France), Eaton (Ireland), and LS Electric (South Korea).

Top Companies in Ring Main Unit Market

Gas-insulated segment, by insulation type, is expected to be the largest segment during the forecast period.

The gas-insulated segment is anticipated to emerge as the largest segment in the ring main unit (RMU) market during the forecast period due to several compelling factors. Firstly, gas-insulated RMUs utilize sulfur hexafluoride (SF6) gas as an insulation medium, offering superior dielectric properties and enabling compact and lightweight designs. This allows for the efficient utilization of space, making gas-insulated RMUs ideal for installations where space is limited, such as densely populated urban areas or indoor substations. Additionally, SF6 gas offers excellent insulation performance, ensuring high reliability and minimal power losses during operation. Moreover, gas-insulated RMUs are known for their robustness and durability, with the ability to withstand harsh environmental conditions, temperature variations, and seismic events. These features make gas-insulated RMUs suitable for a wide range of applications across various industries, including utilities, industrial facilities, and commercial complexes. Furthermore, advancements in gas-insulated RMU technology, such as the development of eco-friendly SF6 alternatives and innovations in sealing techniques, further drive the segment's growth by addressing environmental concerns and enhancing product performance and sustainability. As a result, the gas-insulated segment is poised to maintain its dominance in the RMU market, offering reliable and efficient solutions for modern power distribution networks.

By installation, the outdoor segment is expected to be the fastest-growing segment in the global ring main unit  market  during the forecast period.

The outdoor segment is poised to emerge as the fastest-growing segment in the global ring main unit (RMU) market during the forecast period due to several key factors. Firstly, the increasing focus on expanding and upgrading power distribution infrastructure, particularly in developing regions, necessitates the deployment of RMUs in outdoor settings to enhance grid reliability and resilience. Outdoor RMUs are specifically designed to withstand harsh environmental conditions, such as extreme temperatures, humidity, and exposure to UV radiation, making them well-suited for outdoor installations in diverse geographical regions. Additionally, the rising adoption of renewable energy sources, such as solar and wind power, requires the integration of RMUs into outdoor substations to facilitate the seamless integration of renewable energy into the grid. Furthermore, the trend towards smart grid solutions and digitalization in the utilities sector drives the demand for outdoor RMUs equipped with advanced monitoring, control, and communication capabilities, enabling utilities to optimize grid performance and ensure uninterrupted power supply to consumers. Overall, the outdoor segment is expected to experience accelerated growth as utilities prioritize the deployment of robust and reliable RMUs in outdoor environments to meet the evolving demands of the modern power grid.

Asia Pacific to account for largest market size during forecast period.

Asia Pacific is poised to secure the largest market size in the ring main unit (RMU) segment during the forecast period due to several converging factors. The region is experiencing rapid industrialization, urbanization, and economic growth, leading to a surge in electricity demand across various sectors. This escalating demand necessitates significant investments in power infrastructure, including the expansion and modernization of distribution networks, where RMUs play a pivotal role. Furthermore, Asia Pacific governments are prioritizing initiatives to enhance energy access, improve grid reliability, and integrate renewable energy sources into the electricity mix. As a result, there is a heightened focus on deploying advanced technologies like RMUs to ensure efficient power distribution and mitigate grid instability. Moreover, the region's vast geographical expanse and diverse market landscapes present abundant opportunities for RMU manufacturers and suppliers to cater to a wide range of applications and customer segments. With favorable government policies, growing industrialization, and increasing emphasis on grid reliability and sustainability, Asia Pacific emerges as a key growth engine for the RMU market, driving its largest market share during the forecast period.

North American Ring Main Unit Market Size, and Share

Key Market Players

The ring main unit market is predominantly controlled by a handful of prominent players boasting extensive regional coverage. Among the leading contenders in this market are ABB Ltd (Switzerland), Siemens (Germany), Eaton (Ireland), Schneider Electric (France),and LS Electric Co., Ltd (South Korea), Lucy Electric (UK), CG power & industrial solutions (India), Tiepco (Saudi Arabia), Orecco (China), Entec Electric & Electronics (South Korea). Throughout the period spanning from 2020 to 2023, these companies strategically focused on securing sales contracts as their primary approach to expand their foothold and enhance their market share within the ring main unit segment.

Get online access to the report on the World's First Market Intelligence Cloud

  • Easy to Download Historical Data & Forecast Numbers
  • Company Analysis Dashboard for high growth potential opportunities
  • Research Analyst Access for customization & queries
  • Competitor Analysis with Interactive dashboard
  • Latest News, Updates & Trend analysis
Request Sample

Scope of the Report

Report Metric

Details

Market Size available for years

2020–2029

Base year considered

2023

Forecast period

2024–2029

Forecast units

Value (USD Billion)

Segments covered

Insulation Type, Installation, Voltage Rating, Structure, Application

Geographies covered

Asia Pacific, North America, Europe, Middle East and Africa, and South America 

Companies covered

ABB Ltd (Switzerland), Siemens (Germany), Eaton (Ireland), Schneider Electric (France), LS Electric Co., Ltd (South Korea), Lucy Electric (UK), TIEPCO (Saudi Arabia), ENTEC Electric & Electronic (South Korea), ORECCO (China), Ormazabal (Spain), NATUS GmbH & Co. KG (Germany), Alfanar Group (Saudi Arabia), Wenzhou Rockwill Electric Co., Ltd (China), KONCAR–Electrical Industry Inc (Croatia), Yueqing Liyond Electric Co., Ltd (China), China Transpowers Electric Co., Ltd (China), INDKOM Engineering SDN. BHD. (Malaysia), Swati Switchgears (India) Pvt. Ltd. (India), BVM Technologies Pvt. Ltd. (India), CG power & industrial solutions (India)

This research report categorizes the ring main unit market according to insulation type, installation, voltage rating, structure, application, and region.

Based on insulation type:
  • Gas-insulated
  • Air-insulated
  • Oil-insulated
  • Solid dielectric
Based on installation:
  • Outdoor
  • Indoor
Based on voltage rating:
  • Up to 15 kV
  • 15–25 kV
  • Above 25 kV
Based on structure:
  • Extensive
  • Non-extensive
Based on application:
  • Distribution utilities
  • Industrial application
  • Transportation infrastructure
  • Commercial buildings
Based on regions:
  • North America
  • Asia Pacific
  • South America
  • Europe
  • Middle East and Africa

Recent Developments

  • In April 2021, Siemens unveiled the 8DJH 24 switchgear, marking its entry into the ring main unit (RMU) market for line voltages of up to 24 kV.
  • In June 2022, Schneider Electric entered into an agreement to provide 4,000 ring main units alongside four control centers, aiming to modernize Egypt's national grid.
  • In June 2022, Schneider Electric Expands Its Portfolio of SF6-Free Green and Digital MV Switchgear with GM AirSeT™

Frequently Asked Questions (FAQ):

To speak to our analyst for a discussion on the above findings, click Speak to Analyst

TABLE OF CONTENTS
 
1 INTRODUCTION (Page No. - 34)
    1.1 STUDY OBJECTIVES 
    1.2 MARKET DEFINITION 
    1.3 STUDY SCOPE 
           1.3.1 MARKETS COVERED
                    FIGURE 1 RING MAIN UNIT MARKET SEGMENTATION
           1.3.2 INCLUSIONS AND EXCLUSIONS
                    TABLE 1 INSULATION TYPE: INCLUSIONS AND EXCLUSIONS
                    TABLE 2 INSTALLATION: INCLUSIONS AND EXCLUSIONS
                    TABLE 3 STRUCTURE: INCLUSIONS AND EXCLUSIONS
                    TABLE 4 POSITION: INCLUSIONS AND EXCLUSIONS
                    TABLE 5 END USER: INCLUSIONS AND EXCLUSIONS
                    TABLE 6 VOLTAGE RATING: INCLUSIONS AND EXCLUSIONS
                    TABLE 7 REGION: INCLUSIONS AND EXCLUSIONS
           1.3.3 REGIONAL SCOPE
           1.3.4 YEARS CONSIDERED
    1.4 CURRENCY CONSIDERED 
    1.5 UNITS CONSIDERED 
    1.6 LIMITATIONS 
    1.7 STAKEHOLDERS 
    1.8 SUMMARY OF CHANGES 
    1.9 RECESSION IMPACT 
 
2 RESEARCH METHODOLOGY (Page No. - 42)
    2.1 RESEARCH DATA 
           FIGURE 2 RING MAIN UNIT MARKET: RESEARCH DESIGN
    2.2 DATA TRIANGULATION 
           2.2.1 SECONDARY AND PRIMARY RESEARCH
           2.2.2 SECONDARY DATA
                    2.2.2.1 List of key secondary sources
                    2.2.2.2 Key data from secondary sources
           2.2.3 PRIMARY DATA
                    2.2.3.1 Breakdown of primaries
                    2.2.3.2 Key data from primary sources
                    2.2.3.3 Key industry insights
                    2.2.3.4 List of major primary interview participants
                    2.2.3.5 Intended participants and key opinion leaders in primary interviews
    2.3 RESEARCH SCOPE 
    2.4 MARKET SIZE ESTIMATION 
           2.4.1 BOTTOM-UP APPROACH
                    FIGURE 3 MARKET SIZE ESTIMATION METHODOLOGY: BOTTOM-UP APPROACH
           2.4.2 TOP-DOWN APPROACH
                    FIGURE 4 MARKET SIZE ESTIMATION METHODOLOGY: TOP-DOWN APPROACH
           2.4.3 DEMAND-SIDE ANALYSIS
                    FIGURE 5 PARAMETERS CONSIDERED TO ASSESS DEMAND FOR RING MAIN UNITS
                    2.4.3.1 Approach to estimate market size using demand-size analysis
                    2.4.3.2 Demand-side assumptions
           2.4.4 SUPPLY-SIDE ANALYSIS
                    FIGURE 6 KEY METRICS CONSIDERED FOR ASSESSING SUPPLY OF RING MAIN UNITS
                    FIGURE 7 MARKET SIZE ESTIMATION METHODOLOGY: SUPPLY-SIDE ANALYSIS: ILLUSTRATION OF REVENUE ESTIMATIONS FOR TOP PLAYER IN RING MAIN UNIT MARKET
                    2.4.4.1 Approach to estimate market size using supply-side analysis
                    2.4.4.2 Supply-side assumptions
    2.5 FORECAST 
           2.5.1 IMPACT OF RECESSION
    2.6 RESEARCH ASSUMPTIONS 
           2.6.1 RESEARCH LIMITATIONS
           2.6.2 RISK ASSESSMENT
 
3 EXECUTIVE SUMMARY (Page No. - 57)
    TABLE 8 RING MAIN UNIT MARKET SNAPSHOT 
    FIGURE 8 ASIA PACIFIC TO REGISTER HIGHEST CAGR IN RING MAIN UNIT MARKET DURING FORECAST PERIOD 
    FIGURE 9 GAS-INSULATED SEGMENT TO LEAD MARKET IN 2029 
    FIGURE 10 OUTDOOR SEGMENT TO RECORD HIGHER CAGR DURING FORECAST PERIOD 
    FIGURE 11 UP TO 15 KV SEGMENT TO REGISTER HIGHEST CAGR DURING FORECAST PERIOD 
    FIGURE 12 NON-EXTENSIBLE SEGMENT TO ACCOUNT FOR LARGER MARKET SHARE IN 2024 
    FIGURE 13 DISTRIBUTION UTILITIES SEGMENT TO DOMINATE MARKET IN 2029 
    FIGURE 14 3-POSITION SEGMENT TO LEAD MARKET IN 2029 
 
4 PREMIUM INSIGHTS (Page No. - 62)
    4.1 ATTRACTIVE OPPORTUNITIES FOR PLAYERS IN RING MAIN UNIT MARKET 
           FIGURE 15 GROWING SHIFT TOWARD RENEWABLE ENERGY SOURCES TO DRIVE MARKET
    4.2 RING MAIN UNIT MARKET, BY REGION 
           FIGURE 16 ASIA PACIFIC TO REGISTER HIGHEST CAGR DURING FORECAST PERIOD
    4.3 RING MAIN UNIT MARKET IN ASIA PACIFIC, BY END USER AND COUNTRY 
           FIGURE 17 DISTRIBUTION UTILITIES AND CHINA DOMINATED MARKET IN ASIA PACIFIC IN 2023
    4.4 RING MAIN UNIT MARKET, BY INSULATION TYPE 
           FIGURE 18 GAS-INSULATED SEGMENT TO DOMINATE MARKET IN 2029
    4.5 RING MAIN UNIT MARKET, BY INSTALLATION 
           FIGURE 19 OUTDOOR SEGMENT TO ACCOUNT FOR LARGER MARKET SHARE IN 2029
    4.6 RING MAIN UNIT MARKET, BY VOLTAGE RATING 
           FIGURE 20 UP TO 15 KV SEGMENT TO CAPTURE LARGEST MARKET SHARE IN 2029
    4.7 RING MAIN UNIT MARKET, BY STRUCTURE 
           FIGURE 21 NON-EXTENSIBLE SEGMENT TO DOMINATE MARKET IN 2029
    4.8 RING MAIN UNIT MARKET, BY END USER 
           FIGURE 22 DISTRIBUTION UTILITIES SEGMENT TO ACCOUNT FOR LARGEST MARKET SHARE IN 2029
    4.9 RING MAIN UNIT MARKET, BY POSITION 
           FIGURE 23 3-POSITION SEGMENT TO ACCOUNT FOR LARGEST MARKET SHARE IN 2029
 
5 MARKET OVERVIEW (Page No. - 66)
    5.1 INTRODUCTION 
    5.2 MARKET DYNAMICS 
           FIGURE 24 RING MAIN UNIT MARKET: DRIVERS, RESTRAINTS, OPPORTUNITIES, AND CHALLENGES
           5.2.1 DRIVERS
                    5.2.1.1 Increasing demand for reliable and resilient power grids
                               FIGURE 25 REGIONAL/COUNTRY-WISE DATA ON INVESTMENTS IN POWER GRIDS, 2015–2022
                    5.2.1.2 Integration of renewable energy into existing grid infrastructure
                               FIGURE 26 GLOBAL DATA ON INVESTMENTS IN CLEAN ENERGY AND FOSSIL FUELS, 2015–2023
                               FIGURE 27 DATA ON RENEWABLE ELECTRICITY CAPACITY, 2016–2022
           5.2.2 RESTRAINTS
                    5.2.2.1 Environmental concerns associated with RMUs
                               TABLE 9 GLOBAL WARMING POTENTIAL OF GREENHOUSE GASES (100-YEAR TIME HORIZON)
                    5.2.2.2 Volatile raw material prices
                    5.2.2.3 Limited land availability
                    5.2.2.4 High expenses associated with retrofitting existing RMUs
           5.2.3 OPPORTUNITIES
                    5.2.3.1 Benefits of integrating RMUs with distribution management system
                    5.2.3.2 Government-led initiatives to boost adoption of smart RMUs
                    5.2.3.3 Growing use of smart technologies to transform power distribution
                    5.2.3.4 Ongoing digitalization of electricity sector
                               FIGURE 28 GLOBAL DATA ON INVESTMENTS IN ENERGY, 2015–2023
           5.2.4 CHALLENGES
                    5.2.4.1 High initial investment in smart RMUs
    5.3 TRENDS/DISRUPTIONS IMPACTING CUSTOMERS’ BUSINESSES 
           FIGURE 29 TRENDS/DISRUPTIONS IMPACTING CUSTOMERS’ BUSINESSES
    5.4 ECOSYSTEM ANALYSIS 
           FIGURE 30 ECOSYSTEM ANALYSIS: RING MAIN UNIT MARKET
           TABLE 10 ROLES OF COMPANIES IN RING MAIN UNIT ECOSYSTEM
    5.5 PRICING ANALYSIS 
           5.5.1 INDICATIVE PRICING TREND, BY VOLTAGE RATING
                    TABLE 11 INDICATIVE PRICING TREND, BY VOLTAGE RATING (USD)
           5.5.2 AVERAGE SELLING PRICE TREND OF RING MAIN UNIT, BY REGION
                    TABLE 12 AVERAGE SELLING PRICE TREND OF RING MAIN UNIT, BY REGION, 2020–2024 (USD)
                    FIGURE 31 AVERAGE SELLING PRICE TREND OF RING MAIN UNIT, BY REGION, 2020–2024 (USD)
    5.6 SUPPLY CHAIN ANALYSIS 
           FIGURE 32 RING MAIN UNIT MARKET: SUPPLY CHAIN ANALYSIS
    5.7 TECHNOLOGY ANALYSIS 
           5.7.1 KEY TECHNOLOGIES
                    5.7.1.1 Vacuum technology
           5.7.2 COMPLEMENTARY TECHNOLOGIES
                    5.7.2.1 Smart RMUs
    5.8 INVESTMENT AND FUNDING SCENARIO 
           FIGURE 33 INVESTMENT AND FUNDING SCENARIO
    5.9 KEY CONFERENCES AND EVENTS, 2024–2025 
           TABLE 13 RING MAIN UNIT MARKET: LIST OF CONFERENCES AND EVENTS
    5.1 TARIFF AND REGULATORY LANDSCAPE 
           5.10.1 TARIFF ANALYSIS
                    TABLE 14 IMPORT TARIFF FOR HS CODE 853690-COMPLIANT PRODUCTS, 2023
                    TABLE 15 IMPORT DATA FOR HS 853590 CODE-COMPLIANT PRODUCTS, 2023
           5.10.2 REGULATORY BODIES, GOVERNMENT AGENCIES, AND OTHER ORGANIZATIONS
                    TABLE 16 NORTH AMERICA: LIST OF REGULATORY BODIES, GOVERNMENT AGENCIES, AND OTHER ORGANIZATIONS
                    TABLE 17 EUROPE: LIST OF REGULATORY BODIES, GOVERNMENT AGENCIES, AND OTHER ORGANIZATIONS
                    TABLE 18 ASIA PACIFIC: LIST OF REGULATORY BODIES, GOVERNMENT AGENCIES, AND OTHER ORGANIZATIONS
                    TABLE 19 ROW: LIST OF REGULATORY BODIES, GOVERNMENT AGENCIES, AND OTHER ORGANIZATIONS
           5.10.3 CODES AND REGULATIONS
                    TABLE 20 GLOBAL REGULATIONS AND STANDARDS RELATED TO RING MAIN UNIT TECHNOLOGY
    5.11 TRADE ANALYSIS 
           5.11.1 IMPORT DATA (HS CODE 853590)
                    TABLE 21 IMPORT DATA FOR HS CODE 853590-COMPLIANT PRODUCTS, BY COUNTRY, 2021–2023 (USD)
                    FIGURE 34 IMPORT DATA FOR HS CODE 853590-COMPLIANT PRODUCTS, BY COUNTRY, 2021–2023 (USD)
           5.11.2 EXPORT DATA (HS CODE 853590)
                    TABLE 22 EXPORT DATA FOR HS CODE 853590-COMPLIANT PRODUCTS, BY COUNTRY, 2021–2023 (USD)
                    FIGURE 35 EXPORT DATA FOR HS CODE 853590-COMPLIANT PRODUCTS, BY COUNTRY, 2021–2023 (USD)
           5.11.3 IMPORT DATA (HS CODE 853690)
                    TABLE 23 IMPORT DATA FOR HS CODE 853690-COMPLIANT PRODUCTS, BY COUNTRY, 2021–2023 (USD)
                    FIGURE 36 IMPORT DATA FOR HS CODE 853690-COMPLIANT PRODUCTS, BY COUNTRY, 2021–2023 (USD)
           5.11.4 EXPORT DATA (HS CODE 853690)
                    TABLE 24 EXPORT DATA FOR HS CODE 853690-COMPLIANT PRODUCTS, BY COUNTRY, 2021–2023 (USD)
                    FIGURE 37 EXPORT DATA FOR HS CODE 853690-COMPLIANT PRODUCTS, BY COUNTRY, 2021–2023 (USD)
    5.12 PATENT ANALYSIS 
                    FIGURE 38 NUMBER OF PATENTS APPLIED AND GRANTED FOR RING MAIN UNITS, 2014–2023
                    TABLE 25 LIST OF APPLIED/GRANTED PATENTS RELATED TO RING MAIN UNITS, 2021–2024
    5.13 PORTER'S FIVE FORCES ANALYSIS 
                    FIGURE 39 RING MAIN UNIT MARKET: PORTER'S FIVE FORCES ANALYSIS
                    TABLE 26 RING MAIN UNIT MARKET: PORTER'S FIVE FORCES ANALYSIS
           5.13.1 THREAT OF SUBSTITUTES
           5.13.2 BARGAINING POWER OF SUPPLIERS
           5.13.3 BARGAINING POWER OF BUYERS
           5.13.4 THREAT OF NEW ENTRANTS
           5.13.5 INTENSITY OF COMPETITIVE RIVALRY
    5.14 KEY STAKEHOLDERS AND BUYING CRITERIA 
           5.14.1 KEY STAKEHOLDERS IN BUYING PROCESS
                    FIGURE 40 INFLUENCE OF STAKEHOLDERS ON BUYING PROCESS, BY END USER
                    TABLE 27 INFLUENCE OF KEY STAKEHOLDERS ON BUYING PROCESS, BY END USER (%)
           5.14.2 BUYING CRITERIA
                    FIGURE 41 KEY BUYING CRITERIA, BY END USER
                    TABLE 28 KEY BUYING CRITERIA, BY END USER
    5.15 CASE STUDY ANALYSIS 
           5.15.1 LS ELECTRIC OFFERED RENEWABLE PROJECTS AEGIS 36-RING MAIN UNIT TO ENSURE RELIABILITY AND COST-EFFICIENCY
           5.15.2 SÜC COBURG PROVIDED ABB WITH SAFERING AIRPLUS RMUS TO BOOST POWER RELIABILITY
           5.15.3 SCHNEIDER ELECTRIC PROVIDED UTILITY COMPANY WITH RM6 SERIES GAS-INSULATED RMUS TO IMPROVE NETWORK MANAGEMENT
 
6 RING MAIN UNIT MARKET, BY POSITION (Page No. - 108)
    6.1 INTRODUCTION 
           FIGURE 42 3-POSITION SEGMENT ACCOUNTED FOR LARGEST MARKET SHARE IN 2023
           TABLE 29 RING MAIN UNIT MARKET, BY POSITION, 2020–2023 (USD MILLION)
           TABLE 30 RING MAIN UNIT MARKET, BY POSITION, 2024–2029 (USD MILLION)
    6.2 3-POSITION 
           6.2.1 BUILT-IN DIAGNOSTICS FEATURE FOR PROACTIVE PERFORMANCE MONITORING TO FUEL MARKET GROWTH
    6.3 6-POSITION 
           6.3.1 ABILITY TO CONTROL ELECTRICAL POWER DISTRIBUTION IN MEDIUM TO HIGH-VOLTAGE ENVIRONMENTS TO DRIVE DEMAND
    6.4 OTHERS 
 
7 RING MAIN UNIT MARKET, BY INSULATION TYPE (Page No. - 112)
    7.1 INTRODUCTION 
           FIGURE 43 GAS-INSULATED SEGMENT DOMINATED MARKET IN 2023
           TABLE 31 RING MAIN UNIT MARKET, BY INSULATION TYPE, 2020–2023 (USD MILLION)
           TABLE 32 RING MAIN UNIT MARKET, BY INSULATION TYPE, 2024–2029 (USD MILLION)
    7.2 GAS-INSULATED 
           7.2.1 GROWING DEMAND FOR HIGH DIELECTRIC STRENGTH IN MEDIUM-AND HIGH-VOLTAGE APPLICATIONS TO FUEL SEGMENTAL GROWTH
                    TABLE 33 GAS-INSULATED: RING MAIN UNIT MARKET, BY REGION, 2020–2023 (USD MILLION)
                    TABLE 34 GAS-INSULATED: RING MAIN UNIT MARKET, BY REGION, 2024–2029 (USD MILLION)
    7.3 AIR-INSULATED 
           7.3.1 RISING NEED TO REDUCE CARBON FOOTPRINTS TO DRIVE MARKET
                    TABLE 35 AIR-INSULATED: RING MAIN UNIT MARKET, BY REGION, 2020–2023 (USD MILLION)
                    TABLE 36 AIR-INSULATED: RING MAIN UNIT MARKET, BY REGION, 2024–2029 (USD MILLION)
    7.4 OIL-INSULATED 
           7.4.1 ABILITY TO WITHSTAND HEAVY LOADS IN INDUSTRIAL SETTINGS TO STIMULATE MARKET GROWTH
                    TABLE 37 OIL-INSULATED: RING MAIN UNIT MARKET, BY REGION, 2020–2023 (USD MILLION)
                    TABLE 38 OIL-INSULATED: RING MAIN UNIT MARKET, BY REGION, 2024–2029 (USD MILLION)
    7.5 SOLID DIELECTRIC 
           7.5.1 INCREASING DEMAND FOR LOW-MAINTENANCE AND ECO-FRIENDLY SOLUTIONS TO FOSTER MARKET GROWTH
                    TABLE 39 SOLID DIELECTRIC: RING MAIN UNIT MARKET, BY REGION, 2020–2023 (USD MILLION)
                    TABLE 40 SOLID DIELECTRIC: RING MAIN UNIT MARKET, BY REGION, 2024–2029 (USD MILLION)
 
8 RING MAIN UNIT MARKET, BY INSTALLATION (Page No. - 120)
    8.1 INTRODUCTION 
           FIGURE 44 INDOOR SEGMENT CLAIMED LARGER MARKET SHARE IN 2023
           TABLE 41 RING MAIN UNIT MARKET, BY INSTALLATION, 2020–2023 (USD MILLION)
           TABLE 42 RING MAIN UNIT MARKET, BY INSTALLATION, 2024–2029 (USD MILLION)
    8.2 INDOOR 
           8.2.1 RISING DEMAND FOR INTERLOCKS AND ARC-PROOF ENCLOSURES TO FUEL SEGMENTAL GROWTH
                    TABLE 43 INDOOR: RING MAIN UNIT MARKET, BY REGION, 2020–2023 (USD MILLION)
                    TABLE 44 INDOOR: RING MAIN UNIT MARKET, BY REGION, 2024–2029 (USD MILLION)
    8.3 OUTDOOR 
           8.3.1 ABILITY TO WITHSTAND EXTREME TEMPERATURES, RAIN, AND HUMIDITY TO DRIVE MARKET
                    TABLE 45 OUTDOOR: RING MAIN UNIT MARKET, BY REGION, 2020–2023 (USD MILLION)
                    TABLE 46 OUTDOOR: RING MAIN UNIT MARKET, BY REGION, 2024–2029 (USD MILLION)
 
9 RING MAIN UNIT MARKET, BY VOLTAGE RATING (Page No. - 125)
    9.1 INTRODUCTION 
           FIGURE 45 UP TO 15 KV SEGMENT DOMINATED MARKET IN 2023
           TABLE 47 RING MAIN UNIT MARKET, BY VOLTAGE RATING, 2020–2023 (USD MILLION)
           TABLE 48 RING MAIN UNIT MARKET, BY VOLTAGE RATING, 2024–2029 (USD MILLION)
    9.2 UP TO 15 KV 
           9.2.1 GOVERNMENT-LED INITIATIVES TO ELECTRIFY RURAL AREAS TO DRIVE MARKET
                    TABLE 49 UP TO 15 KV: RING MAIN UNIT MARKET, BY REGION, 2020–2023 (USD MILLION)
                    TABLE 50 UP TO 15 KV: RING MAIN UNIT MARKET, BY REGION, 2024–2029 (USD MILLION)
    9.3 16–25 KV 
           9.3.1 ONGOING DEVELOPMENTS IN WIND ENERGY AND INDUSTRIAL AUTOMATION TO FUEL MARKET GROWTH
                    TABLE 51 16–25 KV: RING MAIN UNIT MARKET, BY REGION, 2020–2023 (USD MILLION)
                    TABLE 52 16–25 KV: RING MAIN UNIT MARKET, BY REGION, 2024–2029 (USD MILLION)
    9.4 ABOVE 25 KV 
           9.4.1 GROWING IMPLEMENTATION IN LARGE-SCALE COMMERCIAL BUILDINGS TO BOOST DEMAND
                    TABLE 53 ABOVE 25 KV: RING MAIN UNIT MARKET, BY REGION, 2020–2023 (USD MILLION)
                    TABLE 54 ABOVE 25 KV: RING MAIN UNIT MARKET, BY REGION, 2024–2029 (USD MILLION)
 
 
10 RING MAIN UNIT MARKET, BY STRUCTURE (Page No. - 131)
     10.1 INTRODUCTION 
               FIGURE 46 NON-EXTENSIBLE SEGMENT SECURED LARGER MARKET SHARE IN 2023
               TABLE 55 RING MAIN UNIT MARKET, BY STRUCTURE, 2020–2023 (USD MILLION)
               TABLE 56 RING MAIN UNIT MARKET, BY STRUCTURE, 2024–2029 (USD MILLION)
     10.2 NON-EXTENSIBLE 
             10.2.1 GROWING NUMBER OF INFRASTRUCTURE PROJECTS IN URBAN REDEVELOPMENT AND SMART CITY INITIATIVES TO DRIVE MARKET
                       TABLE 57 NON-EXTENSIBLE: RING MAIN UNIT MARKET, BY REGION, 2020–2023 (USD MILLION)
                       TABLE 58 NON-EXTENSIBLE: RING MAIN UNIT MARKET, BY REGION, 2024–2029 (USD MILLION)
     10.3 EXTENSIBLE 
             10.3.1 RISING EMPHASIS ON URBANIZATION AND INDUSTRIALIZATION TO BOOST DEMAND
                       TABLE 59 EXTENSIBLE: RING MAIN UNIT MARKET, BY REGION, 2020–2023 (USD MILLION)
                       TABLE 60 EXTENSIBLE: RING MAIN UNIT MARKET, BY REGION, 2024–2029 (USD MILLION)
 
11 RING MAIN UNIT MARKET, BY END USER (Page No. - 136)
     11.1 INTRODUCTION 
               FIGURE 47 DISTRIBUTION UTILITIES SEGMENT LED MARKET IN 2023
               TABLE 61 RING MAIN UNIT MARKET, BY END USER, 2020–2023 (USD MILLION)
               TABLE 62 RING MAIN UNIT MARKET, BY END USER, 2024–2029 (USD MILLION)
     11.2 DISTRIBUTION UTILITIES 
             11.2.1 GOVERNMENT-LED INITIATIVES AND INVESTMENTS TO DEVELOP SMART GRID TECHNOLOGIES TO BOOST DEMAND
                       TABLE 63 DISTRIBUTION UTILITIES: RING MAIN UNIT MARKET, BY REGION, 2020–2023 (USD MILLION)
                       TABLE 64 DISTRIBUTION UTILITIES: RING MAIN UNIT MARKET, BY REGION, 2024–2029 (USD MILLION)
     11.3 INDUSTRIAL 
             11.3.1 RISING FOCUS OF REFINERIES AND PROCESSING FACILITIES ON SAFETY TO BOOST DEMAND
                       TABLE 65 INDUSTRIAL PLANTS: RING MAIN UNIT MARKET, BY REGION, 2020–2023 (USD MILLION)
                       TABLE 66 INDUSTRIAL PLANTS: RING MAIN UNIT MARKET, BY REGION, 2024–2029 (USD MILLION)
     11.4 TRANSPORTATION INFRASTRUCTURE 
             11.4.1 GROWING REQUIREMENT FOR UNINTERRUPTED POWER SUPPLY TO ACCELERATE DEMAND
                       TABLE 67 TRANSPORTATION INFRASTRUCTURE: RING MAIN UNIT MARKET, BY REGION, 2020–2023 (USD MILLION)
                       TABLE 68 TRANSPORTATION INFRASTRUCTURE: RING MAIN UNIT MARKET, BY REGION, 2024–2029 (USD MILLION)
     11.5 COMMERCIAL BUILDINGS 
             11.5.1 INCREASING DEPLOYMENT IN ESCALATORS, ELEVATORS, SECURITY SYSTEMS, AND HVAC UNITS TO DRIVE MARKET
                       TABLE 69 COMMERCIAL BUILDINGS: RING MAIN UNIT MARKET, BY REGION, 2020–2023 (USD MILLION)
                       TABLE 70 COMMERCIAL BUILDINGS: RING MAIN UNIT MARKET, BY REGION, 2024–2029 (USD MILLION)
 
12 RING MAIN UNIT MARKET, BY REGION (Page No. - 144)
     12.1 INTRODUCTION 
               FIGURE 48 ASIA PACIFIC TO EXHIBIT HIGHEST CAGR DURING FORECAST PERIOD
               FIGURE 49 RING MAIN UNIT MARKET SHARE, BY REGION, 2023
               TABLE 71 RING MAIN UNIT MARKET, BY REGION, 2020–2023 (USD MILLION)
               TABLE 72 RING MAIN UNIT MARKET, BY REGION, 2024–2029 (USD MILLION)
               TABLE 73 RING MAIN UNIT MARKET, BY REGION, 2020–2023 (THOUSAND UNITS)
               TABLE 74 RING MAIN UNIT MARKET, BY REGION, 2024–2029 (THOUSAND UNITS)
     12.2 ASIA PACIFIC 
             12.2.1 RECESSION IMPACT ON RING MAIN UNIT MARKET IN ASIA PACIFIC
                       FIGURE 50 ASIA PACIFIC: RING MAIN UNIT MARKET SNAPSHOT
                       TABLE 75 ASIA PACIFIC: RING MAIN UNIT MARKET, BY INSULATION TYPE, 2020–2023 (USD MILLION)
                       TABLE 76 ASIA PACIFIC: RING MAIN UNIT MARKET, BY INSULATION TYPE, 2024–2029 (USD MILLION)
                       TABLE 77 ASIA PACIFIC: RING MAIN UNIT MARKET, BY INSTALLATION, 2020–2023 (USD MILLION)
                       TABLE 78 ASIA PACIFIC: RING MAIN UNIT MARKET, BY INSTALLATION, 2024–2029 (USD MILLION)
                       TABLE 79 ASIA PACIFIC: RING MAIN UNIT MARKET, BY VOLTAGE RATING, 2020–2023 (USD MILLION)
                       TABLE 80 ASIA PACIFIC: RING MAIN UNIT MARKET, BY VOLTAGE RATING, 2024–2029 (USD MILLION)
                       TABLE 81 ASIA PACIFIC: RING MAIN UNIT MARKET, BY STRUCTURE, 2020–2023 (USD MILLION)
                       TABLE 82 ASIA PACIFIC: RING MAIN UNIT MARKET, BY STRUCTURE, 2024–2029 (USD MILLION)
                       TABLE 83 ASIA PACIFIC: RING MAIN UNIT MARKET, BY END USER, 2020–2023 (USD MILLION)
                       TABLE 84 ASIA PACIFIC: RING MAIN UNIT MARKET, BY END USER, 2024–2029 (USD MILLION)
                       TABLE 85 ASIA PACIFIC: RING MAIN UNIT MARKET, BY COUNTRY, 2020–2023 (USD MILLION)
                       TABLE 86 ASIA PACIFIC: RING MAIN UNIT MARKET, BY COUNTRY, 2024–2029 (USD MILLION)
             12.2.2 CHINA
                       12.2.2.1 Government-led initiatives to upgrade and expand existing grid infrastructure to boost demand
                                   TABLE 87 CHINA: RING MAIN UNIT MARKET, BY END USER, 2020–2023 (USD MILLION)
                                   TABLE 88 CHINA: RING MAIN UNIT MARKET, BY END USER, 2024–2029 (USD MILLION)
             12.2.3 INDIA
                       12.2.3.1 Increasing demand for reliable power distribution infrastructure to drive market
                                   TABLE 89 INDIA: RING MAIN UNIT MARKET, BY END USER, 2020–2023 (USD MILLION)
                                   TABLE 90 INDIA: RING MAIN UNIT MARKET, BY END USER, 2024–2029 (USD MILLION)
             12.2.4 JAPAN
                       12.2.4.1 Rising focus on modernizing existing electricity grid to fuel market growth
                                   TABLE 91 JAPAN: RING MAIN UNIT MARKET, BY END USER, 2020–2023 (USD MILLION)
                                   TABLE 92 JAPAN: RING MAIN UNIT MARKET, BY END USER, 2024–2029 (USD MILLION)
             12.2.5 MALAYSIA
                       12.2.5.1 Growing emphasis on reducing greenhouse gas emissions to boost demand
                                   TABLE 93 MALAYSIA: RING MAIN UNIT MARKET, BY END USER, 2020–2023 (USD MILLION)
                                   TABLE 94 MALAYSIA: RING MAIN UNIT MARKET, BY END USER, 2024–2029 (USD MILLION)
             12.2.6 SOUTH KOREA
                       12.2.6.1 Increasing deployment of smart grid technologies in urban areas to drive market
                                   TABLE 95 SOUTH KOREA: RING MAIN UNIT MARKET, BY END USER, 2020–2023 (USD MILLION)
                                   TABLE 96 SOUTH KOREA: RING MAIN UNIT MARKET, BY END USER, 2024–2029 (USD MILLION)
             12.2.7 REST OF ASIA PACIFIC
                       TABLE 97 REST OF ASIA PACIFIC: RING MAIN UNIT MARKET, BY END USER, 2020–2023 (USD MILLION)
                       TABLE 98 REST OF ASIA PACIFIC: RING MAIN UNIT MARKET, BY END USER, 2024–2029 (USD MILLION)
     12.3 EUROPE 
             12.3.1 RECESSION IMPACT ON RING MAIN UNIT MARKET IN EUROPE
                       FIGURE 51 EUROPE: RING MAIN UNIT MARKET SNAPSHOT
                       TABLE 99 EUROPE: RING MAIN UNIT MARKET, BY INSULATION TYPE, 2020–2023 (USD MILLION)
                       TABLE 100 EUROPE: RING MAIN UNIT MARKET, BY INSULATION TYPE, 2024–2029 (USD MILLION)
                       TABLE 101 EUROPE: RING MAIN UNIT MARKET, BY INSTALLATION, 2020–2023 (USD MILLION)
                       TABLE 102 EUROPE: RING MAIN UNIT MARKET, BY INSTALLATION, 2024–2029 (USD MILLION)
                       TABLE 103 EUROPE: RING MAIN UNIT MARKET, BY VOLTAGE RATING, 2020–2023 (USD MILLION)
                       TABLE 104 EUROPE: RING MAIN UNIT MARKET, BY VOLTAGE RATING, 2024–2029 (USD MILLION)
                       TABLE 105 EUROPE: RING MAIN UNIT MARKET, BY STRUCTURE, 2020–2023 (USD MILLION)
                       TABLE 106 EUROPE: RING MAIN UNIT MARKET, BY STRUCTURE, 2024–2029 (USD MILLION)
                       TABLE 107 EUROPE: RING MAIN UNIT MARKET, BY END USER, 2020–2023 (USD MILLION)
                       TABLE 108 EUROPE: RING MAIN UNIT MARKET, BY END USER, 2024–2029 (USD MILLION)
                       TABLE 109 EUROPE: RING MAIN UNIT MARKET, BY COUNTRY, 2020–2023 (USD MILLION)
                       TABLE 110 EUROPE: RING MAIN UNIT MARKET, BY COUNTRY, 2024–2029 (USD MILLION)
             12.3.2 GERMANY
                       12.3.2.1 Growing emphasis on national grid expansion and modification to drive market
                                   TABLE 111 GERMANY: RING MAIN UNIT MARKET, BY END USER, 2020–2023 (USD MILLION)
                                   TABLE 112 GERMANY: RING MAIN UNIT MARKET, BY END USER, 2024–2029 (USD MILLION)
             12.3.3 FRANCE
                       12.3.3.1 Shifting focus to cut nuclear power reliance in electricity generation to boost market
                                   TABLE 113 FRANCE: RING MAIN UNIT MARKET, BY END USER, 2020–2023 (USD MILLION)
                                   TABLE 114 FRANCE: RING MAIN UNIT MARKET, BY END USER, 2024–2029 (USD MILLION)
             12.3.4 UK
                       12.3.4.1 Government-led initiatives to regulate greenhouse gas emissions to fuel market growth
                                   TABLE 115 UK: RING MAIN UNIT MARKET, BY END USER, 2020–2023 (USD MILLION)
                                   TABLE 116 UK: RING MAIN UNIT MARKET, BY END USER, 2024–2029 (USD MILLION)
             12.3.5 REST OF EUROPE
                       TABLE 117 REST OF EUROPE: RING MAIN UNIT MARKET, BY END USER, 2020–2023 (USD MILLION)
                       TABLE 118 REST OF EUROPE: RING MAIN UNIT MARKET, BY END USER, 2024–2029 (USD MILLION)
     12.4 NORTH AMERICA 
             12.4.1 RECESSION IMPACT ON RING MAIN UNIT MARKET IN NORTH AMERICA
                       TABLE 119 NORTH AMERICA: RING MAIN UNIT MARKET, BY INSULATION TYPE, 2020–2023 (USD MILLION)
                       TABLE 120 NORTH AMERICA: RING MAIN UNIT MARKET, BY INSULATION TYPE, 2024–2029 (USD MILLION)
                       TABLE 121 NORTH AMERICA: RING MAIN UNIT MARKET, BY INSTALLATION, 2020–2023 (USD MILLION)
                       TABLE 122 NORTH AMERICA: RING MAIN UNIT MARKET, BY INSTALLATION, 2024–2029 (USD MILLION)
                       TABLE 123 NORTH AMERICA: RING MAIN UNIT MARKET, BY VOLTAGE RATING, 2020–2023 (USD MILLION)
                       TABLE 124 NORTH AMERICA: RING MAIN UNIT MARKET, BY VOLTAGE RATING, 2024–2029 (USD MILLION)
                       TABLE 125 NORTH AMERICA: RING MAIN UNIT MARKET, BY STRUCTURE, 2020–2023 (USD MILLION)
                       TABLE 126 NORTH AMERICA: RING MAIN UNIT MARKET, BY STRUCTURE, 2024–2029 (USD MILLION)
                       TABLE 127 NORTH AMERICA: RING MAIN UNIT MARKET, BY END USER, 2020–2023 (USD MILLION)
                       TABLE 128 NORTH AMERICA: RING MAIN UNIT MARKET, BY END USER, 2024–2029 (USD MILLION)
                       TABLE 129 NORTH AMERICA: RING MAIN UNIT MARKET, BY COUNTRY, 2020–2023 (USD MILLION)
                       TABLE 130 NORTH AMERICA: RING MAIN UNIT MARKET, BY COUNTRY, 2024–2029 (USD MILLION)
             12.4.2 US
                       12.4.2.1 Increasing adoption of renewable energy sources to drive market
                                   TABLE 131 US: RING MAIN UNIT MARKET, BY END USER, 2020–2023 (USD MILLION)
                                   TABLE 132 US: RING MAIN UNIT MARKET, BY END USER, 2024–2029 (USD MILLION)
             12.4.3 CANADA
                       12.4.3.1 Growing emphasis on developing alternative insulation materials to SF6 to boost demand
                                   TABLE 133 CANADA: RING MAIN UNIT MARKET, BY END USER, 2020–2023 (USD MILLION)
                                   TABLE 134 CANADA: RING MAIN UNIT MARKET, BY END USER, 2024–2029 (USD MILLION)
             12.4.4 MEXICO
                       12.4.4.1 Pressing need to reduce dependence on coal for power generation to boost demand
                                   TABLE 135 MEXICO: RING MAIN UNIT MARKET, BY END USER, 2020–2023 (USD MILLION)
                                   TABLE 136 MEXICO: RING MAIN UNIT MARKET, BY END USER, 2024–2029 (USD MILLION)
     12.5 MIDDLE EAST & AFRICA 
             12.5.1 RECESSION IMPACT ON RING MAIN UNIT MARKET IN MIDDLE EAST & AFRICA
                       TABLE 137 MIDDLE EAST & AFRICA: RING MAIN UNIT MARKET, BY INSULATION TYPE, 2020–2023 (USD MILLION)
                       TABLE 138 MIDDLE EAST & AFRICA: RING MAIN UNIT MARKET, BY INSULATION TYPE, 2024–2029 (USD MILLION)
                       TABLE 139 MIDDLE EAST & AFRICA: RING MAIN UNIT MARKET, BY INSTALLATION, 2020–2023 (USD MILLION)
                       TABLE 140 MIDDLE EAST & AFRICA: RING MAIN UNIT MARKET, BY INSTALLATION, 2024–2029 (USD MILLION)
                       TABLE 141 MIDDLE EAST & AFRICA: RING MAIN UNIT MARKET, BY STRUCTURE, 2020–2023 (USD MILLION)
                       TABLE 142 MIDDLE EAST & AFRICA: RING MAIN UNIT MARKET, BY STRUCTURE, 2024–2029 (USD MILLION)
                       TABLE 143 MIDDLE EAST & AFRICA: RING MAIN UNIT MARKET, BY END USER, 2020–2023 (USD MILLION)
                       TABLE 144 MIDDLE EAST & AFRICA: RING MAIN UNIT MARKET, BY END USER, 2024–2029 (USD MILLION)
                       TABLE 145 MIDDLE EAST & AFRICA: RING MAIN UNIT MARKET, BY COUNTRY, 2020–2023 (USD MILLION)
                       TABLE 146 MIDDLE EAST & AFRICA: RING MAIN UNIT MARKET, BY COUNTRY, 2024–2029 (USD MILLION)
                       TABLE 147 GCC: RING MAIN UNIT MARKET, BY COUNTRY, 2020–2023 (USD MILLION)
                       TABLE 148 GCC: RING MAIN UNIT MARKET, BY COUNTRY, 2024–2029 (USD MILLION)
             12.5.2 GCC
                       12.5.2.1 Saudi Arabia
                                   12.5.2.1.1 Rapid urbanization and industrialization to boost demand
                                   TABLE 149 SAUDI ARABIA: RING MAIN UNIT MARKET, BY END USER, 2020–2023 (USD MILLION)
                                   TABLE 150 SAUDI ARABIA: RING MAIN UNIT MARKET, BY END USER, 2024–2029 (USD MILLION)
                       12.5.2.2 UAE
                                   12.5.2.2.1 Rising need for grid modernization to meet high energy demands to create opportunities
                                   TABLE 151 UAE: RING MAIN UNIT MARKET, BY END USER, 2020–2023 (USD MILLION)
                                   TABLE 152 UAE: RING MAIN UNIT MARKET, BY END USER, 2024–2029 (USD MILLION)
                       12.5.2.3 Rest of GCC
                                   TABLE 153 REST OF GCC: RING MAIN UNIT MARKET, BY END USER, 2020–2023 (USD MILLION)
                                   TABLE 154 REST OF GCC: RING MAIN UNIT MARKET, BY END USER, 2024–2029 (USD MILLION)
             12.5.3 EGYPT
                       12.5.3.1 Increasing urbanization and industrialization to drive market
                                   TABLE 155 EGYPT: RING MAIN UNIT MARKET, BY END USER, 2020–2023 (USD MILLION)
                                   TABLE 156 EGYPT: RING MAIN UNIT MARKET, BY END USER, 2024–2029 (USD MILLION)
             12.5.4 SOUTH AFRICA
                       12.5.4.1 Integration of advanced monitoring and control systems to drive market
                                   TABLE 157 SOUTH AFRICA: RING MAIN UNIT MARKET, BY END USER, 2020–2023 (USD MILLION)
                                   TABLE 158 SOUTH AFRICA: RING MAIN UNIT MARKET, BY END USER, 2024–2029 (USD MILLION)
             12.5.5 REST OF MIDDLE EAST & AFRICA
                       TABLE 159 REST OF MIDDLE EAST & AFRICA: RING MAIN UNIT MARKET, BY END USER, 2020–2023 (USD MILLION)
                       TABLE 160 REST OF MIDDLE EAST & AFRICA: RING MAIN UNIT MARKET, BY END USER, 2024–2029 (USD MILLION)
     12.6 SOUTH AMERICA 
             12.6.1 RECESSION IMPACT ON RING MAIN UNIT MARKET IN SOUTH AMERICA
                       TABLE 161 SOUTH AMERICA: RING MAIN UNIT MARKET, BY INSULATION TYPE, 2020–2023 (USD MILLION)
                       TABLE 162 SOUTH AMERICA: RING MAIN UNIT MARKET, BY INSULATION TYPE, 2024–2029 (USD MILLION)
                       TABLE 163 SOUTH AMERICA: RING MAIN UNIT MARKET, BY INSTALLATION, 2020–2023 (USD MILLION)
                       TABLE 164 SOUTH AMERICA: RING MAIN UNIT MARKET, BY INSTALLATION, 2024–2029 (USD MILLION)
                       TABLE 165 SOUTH AMERICA: RING MAIN UNIT MARKET, BY STRUCTURE, 2020–2023 (USD MILLION)
                       TABLE 166 SOUTH AMERICA: RING MAIN UNIT MARKET, BY STRUCTURE, 2024–2029 (USD MILLION)
                       TABLE 167 SOUTH AMERICA: RING MAIN UNIT MARKET, BY END USER, 2020–2023 (USD MILLION)
                       TABLE 168 SOUTH AMERICA: RING MAIN UNIT MARKET, BY END USER, 2024–2029 (USD MILLION)
                       TABLE 169 SOUTH AMERICA: RING MAIN UNIT MARKET, BY COUNTRY, 2020–2023 (USD MILLION)
                       TABLE 170 SOUTH AMERICA: RING MAIN UNIT MARKET, BY COUNTRY, 2024–2029 (USD MILLION)
             12.6.2 BRAZIL
                       12.6.2.1 Increasing demand for efficient electricity distribution to drive demand
                                   TABLE 171 BRAZIL: RING MAIN UNIT MARKET, BY END USER, 2020–2023 (USD MILLION)
                                   TABLE 172 BRAZIL: RING MAIN UNIT MARKET, BY END USER, 2024–2029 (USD MILLION)
             12.6.3 ARGENTINA
                       12.6.3.1 Rising use of automated and digital monitoring systems to drive market
                                   TABLE 173 ARGENTINA: RING MAIN UNIT MARKET, BY END USER, 2020–2023 (USD MILLION)
                                   TABLE 174 ARGENTINA: RING MAIN UNIT MARKET, BY END USER, 2024–2029 (USD MILLION)
             12.6.4 REST OF SOUTH AMERICA
                       TABLE 175 REST OF SOUTH AMERICA: RING MAIN UNIT MARKET, BY END USER, 2020–2023 (USD MILLION)
                       TABLE 176 REST OF SOUTH AMERICA: RING MAIN UNIT MARKET, BY END USER, 2024–2029 (USD MILLION)
 
13 COMPETITIVE LANDSCAPE (Page No. - 197)
     13.1 OVERVIEW 
     13.2 KEY PLAYER STRATEGIES/RIGHT TO WIN, 2020–2024 
               TABLE 177 KEY PLAYER STRATEGIES/RIGHT TO WIN, 2020–2024
     13.3 MARKET SHARE ANALYSIS, 2023 
               TABLE 178 RING MAIN UNIT MARKET: DEGREE OF COMPETITION, 2023
               FIGURE 52 RING MAIN UNIT MARKET SHARE ANALYSIS, 2023
     13.4 REVENUE ANALYSIS, 2019–2023 
               FIGURE 53 REVENUE ANALYSIS OF TOP FIVE PLAYERS, 2019–2023
     13.5 COMPANY EVALUATION MATRIX: KEY PLAYERS, 2023 
             13.5.1 STARS
             13.5.2 EMERGING LEADERS
             13.5.3 PERVASIVE PLAYERS
             13.5.4 PARTICIPANTS
                       FIGURE 54 RING MAIN UNIT MARKET: COMPANY EVALUATION MATRIX (KEY PLAYERS), 2023
             13.5.5 COMPANY FOOTPRINT: KEY PLAYERS, 2023
                       13.5.5.1 Company footprint
                                   FIGURE 55 RING MAIN UNIT MARKET: COMPANY FOOTPRINT
                       13.5.5.2 End user footprint
                                   TABLE 179 RING MAIN UNIT MARKET: END USER FOOTPRINT
                       13.5.5.3 Installation footprint
                                   TABLE 180 RING MAIN UNIT MARKET: INSTALLATION FOOTPRINT
                       13.5.5.4 Voltage rating footprint
                                   TABLE 181 RING MAIN UNIT MARKET: VOLTAGE RATING FOOTPRINT
                       13.5.5.5 Insulation type footprint
                                   TABLE 182 RING MAIN UNIT MARKET: INSULATION TYPE FOOTPRINT
                       13.5.5.6 Position footprint
                                   TABLE 183 RING MAIN UNIT MARKET: POSITION FOOTPRINT
                       13.5.5.7 Structure footprint
                                   TABLE 184 RING MAIN UNIT MARKET: STRUCTURE FOOTPRINT
                       13.5.5.8 Region footprint
                                   TABLE 185 RING MAIN UNIT MARKET: REGION FOOTPRINT
     13.6 COMPANY EVALUATION MATRIX: STARTUPS/SMES, 2023 
             13.6.1 PROGRESSIVE COMPANIES
             13.6.2 RESPONSIVE COMPANIES
             13.6.3 DYNAMIC COMPANIES
             13.6.4 STARTING BLOCKS
                       FIGURE 56 RING MAIN UNIT MARKET: COMPANY EVALUATION MATRIX (STARTUPS/SMES), 2023
             13.6.5 COMPETITIVE BENCHMARKING: STARTUPS/SMES, 2023
                       13.6.5.1 Detailed list of key startups/SMEs
                                   TABLE 186 RING MAIN UNIT MARKET: DETAILED LIST OF KEY STARTUPS/SMES
                       13.6.5.2 Competitive benchmarking of key startups/SMEs
                                   TABLE 187 RING MAIN UNIT MARKET: COMPETITIVE BENCHMARKING OF KEY STARTUPS/SMES
     13.7 COMPANY VALUATION AND FINANCIAL METRICS 
               FIGURE 57 FINANCIAL METRICS (EV/EBITDA), 2024
               FIGURE 58 COMPANY VALUATION, 2024
     13.8 BRAND/PRODUCT COMPARISON 
               FIGURE 59 PRODUCT/BRAND COMPARISON
     13.9 COMPETITIVE SCENARIO AND TRENDS 
             13.9.1 PRODUCT LAUNCHES
                       TABLE 188 RING MAIN UNIT MARKET: PRODUCT LAUNCHES, APRIL 2020–FEBRUARY 2024
             13.9.2 DEALS
                       TABLE 189 RING MAIN UNIT MARKET: DEALS, APRIL 2020–FEBRUARY 2024
             13.9.3 OTHERS
                       TABLE 190 RING MAIN UNIT MARKET: OTHERS, APRIL 2020–FEBRUARY 2024
 
14 COMPANY PROFILES (Page No. - 218)
(Business Overview, Products/Solutions/Services Offered, Recent Developments, MnM view (Key strengths/Right to win, Strategic choices made, Weakness/competitive threats)*
     14.1 KEY PLAYERS 
             14.1.1 ABB
                       TABLE 191 ABB: COMPANY OVERVIEW
                       FIGURE 60 ABB: COMPANY SNAPSHOT
                       TABLE 192 ABB: PRODUCTS/SERVICES/SOLUTIONS OFFERED
                       TABLE 193 ABB: OTHERS
             14.1.2 SIEMENS
                       TABLE 194 SIEMENS: COMPANY OVERVIEW
                       FIGURE 61 SIEMENS: COMPANY SNAPSHOT
                       TABLE 195 SIEMENS: PRODUCTS/SERVICES/SOLUTIONS OFFERED
                       TABLE 196 SIEMENS: PRODUCT LAUNCHES
                       TABLE 197 SIEMENS: DEALS
                       TABLE 198 SIEMENS: OTHERS
             14.1.3 EATON
                       TABLE 199 EATON: COMPANY OVERVIEW
                       FIGURE 62 EATON: COMPANY SNAPSHOT
                       TABLE 200 EATON: PRODUCTS/SERVICES/SOLUTIONS OFFERED
                       TABLE 201 EATON: DEALS
             14.1.4 SCHNEIDER ELECTRIC
                       TABLE 202 SCHNEIDER ELECTRIC: COMPANY OVERVIEW
                       FIGURE 63 SCHNEIDER ELECTRIC: COMPANY SNAPSHOT
                       TABLE 203 SCHNEIDER ELECTRIC: PRODUCTS/SERVICES/SOLUTIONS OFFERED
                       TABLE 204 SCHNEIDER ELECTRIC: PRODUCT LAUNCHES
                       TABLE 205 SCHNEIDER ELECTRIC: DEALS
                       TABLE 206 SCHNEIDER ELECTRIC: OTHERS
             14.1.5 LS ELECTRIC CO., LTD.
                       TABLE 207 LS ELECTRIC CO., LTD.: COMPANY OVERVIEW
                       FIGURE 64 LS ELECTRIC CO., LTD.: COMPANY SNAPSHOT
                       TABLE 208 LS ELECTRIC CO., LTD.: PRODUCTS/SERVICES/SOLUTIONS OFFERED
                       TABLE 209 LS ELECTRIC CO., LTD.: PRODUCT LAUNCHES
                       TABLE 210 LS ELECTRIC CO., LTD.: DEALS
             14.1.6 LUCY GROUP LTD.
                       TABLE 211 LUCY GROUP LTD.: COMPANY OVERVIEW
                       TABLE 212 LUCY GROUP LTD.: PRODUCTS/SERVICES/SOLUTIONS OFFERED
                       TABLE 213 LUCY GROUP LTD.: DEALS
             14.1.7 CG POWER & INDUSTRIAL SOLUTIONS LTD.
                       TABLE 214 CG POWER & INDUSTRIAL SOLUTIONS LTD.: COMPANY OVERVIEW
                       FIGURE 65 CG POWER & INDUSTRIAL SOLUTIONS LTD.: COMPANY SNAPSHOT
                       TABLE 215 CG POWER & INDUSTRIAL SOLUTIONS LTD.: PRODUCTS/SERVICES/SOLUTIONS OFFERED
             14.1.8 TIEPCO
                       TABLE 216 TIEPCO: COMPANY OVERVIEW
                       TABLE 217 TIEPCO: PRODUCTS/SERVICES/SOLUTIONS OFFERED
             14.1.9 ENTEC ELECTRIC & ELECTRONIC
                       TABLE 218 ENTEC ELECTRIC & ELECTRONIC: COMPANY OVERVIEW
                       TABLE 219 ENTEC ELECTRIC & ELECTRONIC: PRODUCTS/SERVICES/SOLUTIONS OFFERED
               14.1.10 ORECCO
                                   TABLE 220 ORECCO: COMPANY OVERVIEW
                                   TABLE 221 ORECCO: PRODUCTS/SERVICES/SOLUTIONS OFFERED
               14.1.11 LARSEN & TOUBRO LIMITED
                                   TABLE 222 LARSEN & TOUBRO LIMITED: COMPANY OVERVIEW
                                   FIGURE 66 LARSEN & TOUBRO LIMITED: COMPANY SNAPSHOT
            TABLE 223 LARSEN & TOUBRO LIMITED: PRODUCTS/SERVICES/SOLUTIONS OFFERED
                                   TABLE 224 LARSEN & TOUBRO LIMITED: OTHERS
               14.1.12 NATUS GMBH & CO. KG
                                   TABLE 225 NATUS GMBH & CO. KG: COMPANY OVERVIEW
                                   TABLE 226 NATUS GMBH & CO. KG: PRODUCTS/SERVICES/SOLUTIONS OFFERED
               14.1.13 ALFANAR GROUP
                                   TABLE 227 ALFANAR GROUP: COMPANY OVERVIEW
                                   TABLE 228 ALFANAR GROUP: PRODUCTS/SERVICES/SOLUTIONS OFFERED
               14.1.14 ROCKWILL
                                   TABLE 229 ROCKWILL: COMPANY OVERVIEW
                                   TABLE 230 ROCKWILL: PRODUCTS/SERVICES/SOLUTIONS OFFERED
               14.1.15 KONCAR D.D.
                                   TABLE 231 KONCAR D.D.: COMPANY OVERVIEW
                                   FIGURE 67 KONCAR D.D.: COMPANY SNAPSHOT
                                   TABLE 232 KONCAR D.D.: PRODUCTS/SERVICES/SOLUTIONS OFFERED
               14.1.16 MEGAWIN
                                   TABLE 233 MEGAWIN: COMPANY OVERVIEW
                                   TABLE 234 MEGAWIN: PRODUCTS/SERVICES/SOLUTIONS OFFERED
               14.1.17 BONOMI EUGENIO SPA
                                   TABLE 235 BONOMI EUGENIO SPA: COMPANY OVERVIEW
                                   TABLE 236 BONOMI EUGENIO SPA: PRODUCTS/SERVICES/SOLUTIONS OFFERED
               14.1.18 CHINT GROUP
                                   TABLE 237 CHINT GROUP: COMPANY OVERVIEW
                                   TABLE 238 CHINT GROUP: PRODUCTS/SERVICES/SOLUTIONS OFFERED
                                   TABLE 239 CHINT GROUP: DEALS
               14.1.19 KDM STEEL
                                   TABLE 240 KDM STEEL: COMPANY OVERVIEW
                                   TABLE 241 KDM STEEL: PRODUCTS/SERVICES/SOLUTIONS OFFERED
               14.1.20 C-SEC TECHNOLOGIES PRIVATE LIMITED
                                   TABLE 242 C-SEC TECHNOLOGIES PRIVATE LIMITED: COMPANY OVERVIEW
                                   TABLE 243 C-SEC TECHNOLOGIES PRIVATE LIMITED: PRODUCTS/SERVICES/SOLUTIONS OFFERED
     14.2 OTHER PLAYERS 
             14.2.1 YUEQING LIYOND ELECTRIC CO., LTD
             14.2.2 CHINA TRANSPOWERS ELECTRIC CO., LIMITED
             14.2.3 INDKOM ENGINEERING SDN. BHD.
             14.2.4 SKYY CREATECH SERVICES PVT. LTD.
             14.2.5 BVM TECHNOLOGIES PRIVATE LIMITED
*Details on Business Overview, Products/Solutions/Services Offered, Recent Developments, MnM view (Key strengths/Right to win, Strategic choices made, Weakness/competitive threats)* might not be captured in case of unlisted companies.
 
15 APPENDIX (Page No. - 265)
     15.1 INSIGHTS FROM INDUSTRY EXPERTS 
     15.2 DISCUSSION GUIDE 
     15.3 KNOWLEDGESTORE: MARKETSANDMARKETS’ SUBSCRIPTION PORTAL 
     15.4 CUSTOMIZATION OPTIONS 
     15.5 RELATED REPORTS 
     15.6 AUTHOR DETAILS 

This study employed a comprehensive approach to determine the current size of the ring main unitmarket. The process began with an in-depth phase of secondary research, gathering extensive data from the market, related sectors, and the broader industry context. This initial data collection was then rigorously validated through primary research, involving discussions with industry experts across the value chain. Subsequently, market size assessments were performed for each country through tailored analyses, resulting in a detailed market breakdown. These analyses were cross-verified to estimate the sizes of various segments and sub-segments accurately. By integrating both secondary and primary research methods, the study ensures that its findings are accurate and reliable. 

Secondary Research

In this research study, a wide array of secondary sources was employed to gather crucial data for a detailed analysis of the global ring main unitmarket. These sources included directories, databases, and reputable references such as Hoover's, Bloomberg BusinessWeek, Factiva, the World Bank, the US Department of Energy (DOE), and the International Energy Agency (IEA). These resources were instrumental in covering technical, market-oriented, and commercial aspects of the market, significantly enriching the study's depth and scope. Additional sources utilized in the research comprised annual reports, press releases, investor presentations, white papers, authoritative publications, articles by esteemed experts, information from industry associations, trade directories, and various database resources. The extensive and diverse secondary sources provided a robust and comprehensive foundation for the research study.

Primary Research

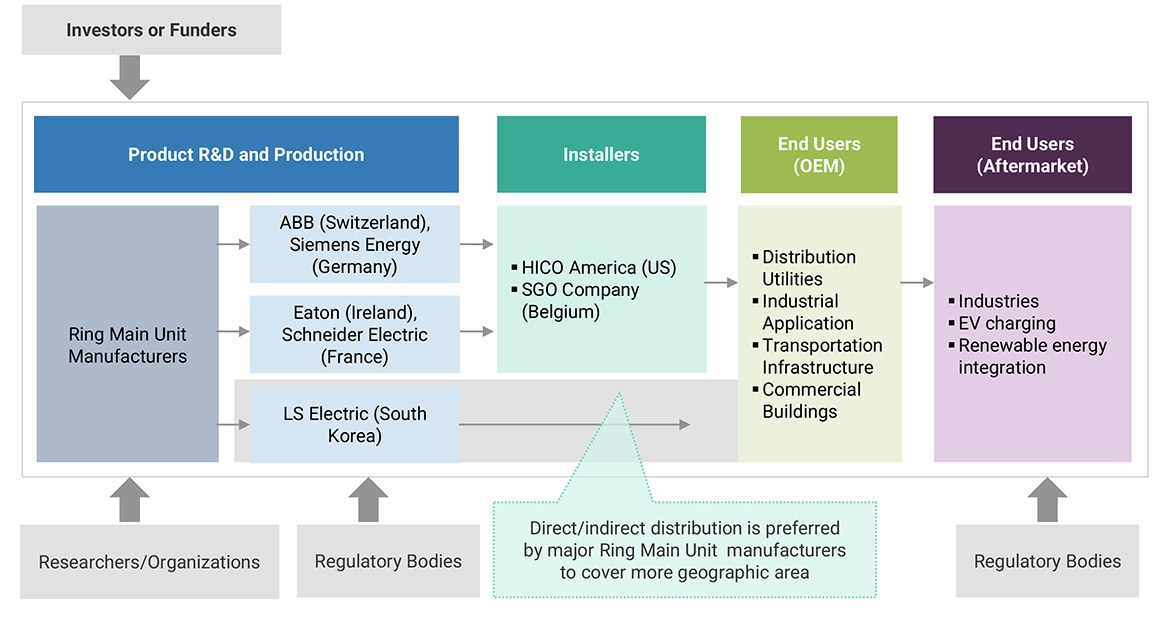
The ring main unit (RMU) market involves a diverse range of stakeholders, including RMU manufacturers, boiler manufacturers, subcomponent manufacturers, manufacturing technology providers, and technology support providers within the supply chain. On the demand side, the market is driven by the increasing need for RMUs in electrical distribution networks. On the supply side, the market is characterized by a growing demand for contracts from distribution utilities, as well as mergers and acquisitions among major industry players. To gather both qualitative and quantitative data, numerous primary sources from both the supply and demand sides of the market were interviewed. Below is a breakdown of the primary respondents:

Ring Main Unit Market Size, and Share

To know about the assumptions considered for the study, download the pdf brochure

Market Size Estimation

The ring main unit market size has been meticulously estimated and verified through the application of both bottom-up and top-down methodology. Numerous market subsegments were estimated using this method in great detail. The research process includes the following important stages.

  • This approach has looked at regional and national manufacturing data for all kinds of ring main units.
  • A substantial amount of primary and secondary research has been carried out in order to completely comprehend the state of the global market for different types of ring main units.
  • Several primary interviews have been conducted with eminent ring main unit system development specialists, including major OEMs and Tier I suppliers.
  • Qualitative aspects like market drivers, constraints, opportunities, and challenges have been considered when assessing and projecting the market size.

Global Ring Main Unit Market Size: Bottom-Up Approach

Ring Main Unit Market Bottom Up Approach

To know about the assumptions considered for the study, Request for Free Sample Report

Global Ring Main Unit Market Size: Top-Down Approach

Ring Main Unit Market Top Down Approach

Data Triangulation

To determine the overall market size, the study divided the market into various segments and subsegments. Techniques such as data triangulation and market segmentation were used to finalize the comprehensive market analysis and obtain precise statistics for each segment and subsegment. Data triangulation involved a detailed analysis of various factors and trends from both the demand and supply sides within the ring main unit market ecosystem.

Market Definition

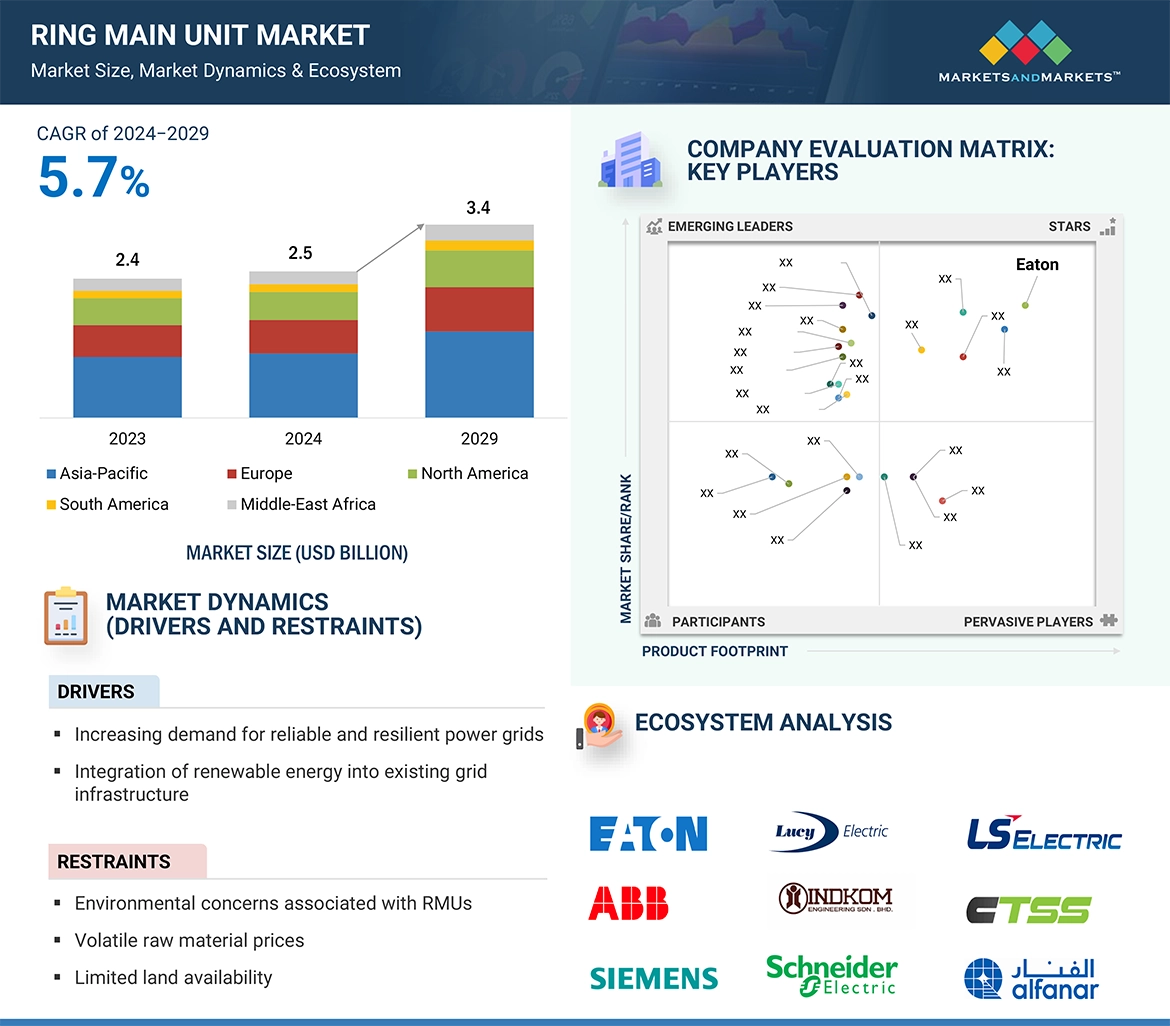
A ring main unit (RMU) serves as a vital component in the transmission and distribution of electrical energy, tasked with adjusting voltage levels between circuits within the power grid. Its principal role involves either increasing (stepping up) or decreasing (stepping down) voltage as electricity traverses from power generation plants to end-users, ensuring efficient transmission over extended distances while minimizing energy loss. Power transformers play a pivotal role in linking disparate power networks and upholding the stability and reliability of the electrical supply system. Comprising a magnetic core typically crafted from materials like silicon steel and insulated wire coils or windings, power transformers operate through electromagnetic induction. As alternating current flows through the primary winding, it generates a magnetic field that induces voltage in the secondary winding. The magnitude of the induced voltage is contingent upon the turns ratio between the primary and secondary windings. For example, if the secondary winding has fewer turns than the primary, the resultant output voltage will be lower, thus functioning as a step-down transformer.

Key Stakeholders

  • Government Utility Providers
  • Independent Power Producers
  • Transformer manufacturers
  • Power equipment and garden tool manufacturers
  • Consulting companies in the energy & power sector
  • Distribution utilities
  • Government and research organizations
  • Organizations, forums, and associations
  • Raw material suppliers
  • State and national regulatory authorities
  • RMU manufacturers, distributors, and suppliers
  • RMU original equipment manufacturers (OEMs)

Objectives of the Study

  • Based on variables including insulation type, installation, voltage rating, structure, application, the ring main unit market will be defined, categorized, segmented, and projected.
  • To estimate market sizes for the major nations in each of these five regions, along with those for Africa, the Middle East, Asia Pacific, North America, and South America.
  • To offer comprehensive examinations of the factors influencing market dynamics, as well as industry-specific prospects, limitations, and challenges.
  • To methodically evaluate each subsegment's market share, growth patterns, and future prospects.
  • To assess market prospects for interested parties and the competitive environment facing industry leaders.
  • To develop strategic profiles of the leading companies by carefully analyzing their market shares and key differentiators.
  • To keep an eye on and evaluate developments pertaining to competition in the ring main unit market, including partnerships, agreements, sales contracts, joint ventures, product launches, contracts, expansions, and investments.
  • This study provides an analysis of the market for ring main units.

Available Customization

With the given market data, MarketsandMarkets offers customizations based on the company’s specific needs. The following customization options are available for the report:

Product Analysis

  • Product Matrix, which provides a detailed comparison of the product portfolio of each company

Company Information

  • Detailed analyses and profiling of additional market players (up to 5)
Custom Market Research Services

We will customize the research for you, in case the report listed above does not meet with your exact requirements. Our custom research will comprehensively cover the business information you require to help you arrive at strategic and profitable business decisions.

Request Customization

Instant Answers with GPT - Ask Now!

Ask real questions. Get complete answers !
Report Code
EP 4041
Published ON
Jun, 2024
Choose License Type
BUY NOW
  • SHARE
X
Request Customization
Speak to Analyst
Speak to Analyst
OR FACE-TO-FACE MEETING
PERSONALIZE THIS RESEARCH
  • Triangulate with your Own Data
  • Get Data as per your Format and Definition
  • Gain a Deeper Dive on a Specific Application, Geography, Customer or Competitor
  • Any level of Personalization
REQUEST A FREE CUSTOMIZATION
LET US HELP YOU!
  • What are the Known and Unknown Adjacencies Impacting the Ring Main Unit Market
  • What will your New Revenue Sources be?
  • Who will be your Top Customer; what will make them switch?
  • Defend your Market Share or Win Competitors
  • Get a Scorecard for Target Partners
CUSTOMIZED WORKSHOP REQUEST
  • Call Us
  • +1-888-600-6441 (Corporate office hours)
  • +1-888-600-6441 (US/Can toll free)
  • +44-800-368-9399 (UK office hours)
CONNECT WITH US
ABOUT TRUST ONLINE
©2024 MarketsandMarkets Research Private Ltd. All rights reserved
DMCA.com Protection Status Website Feedback