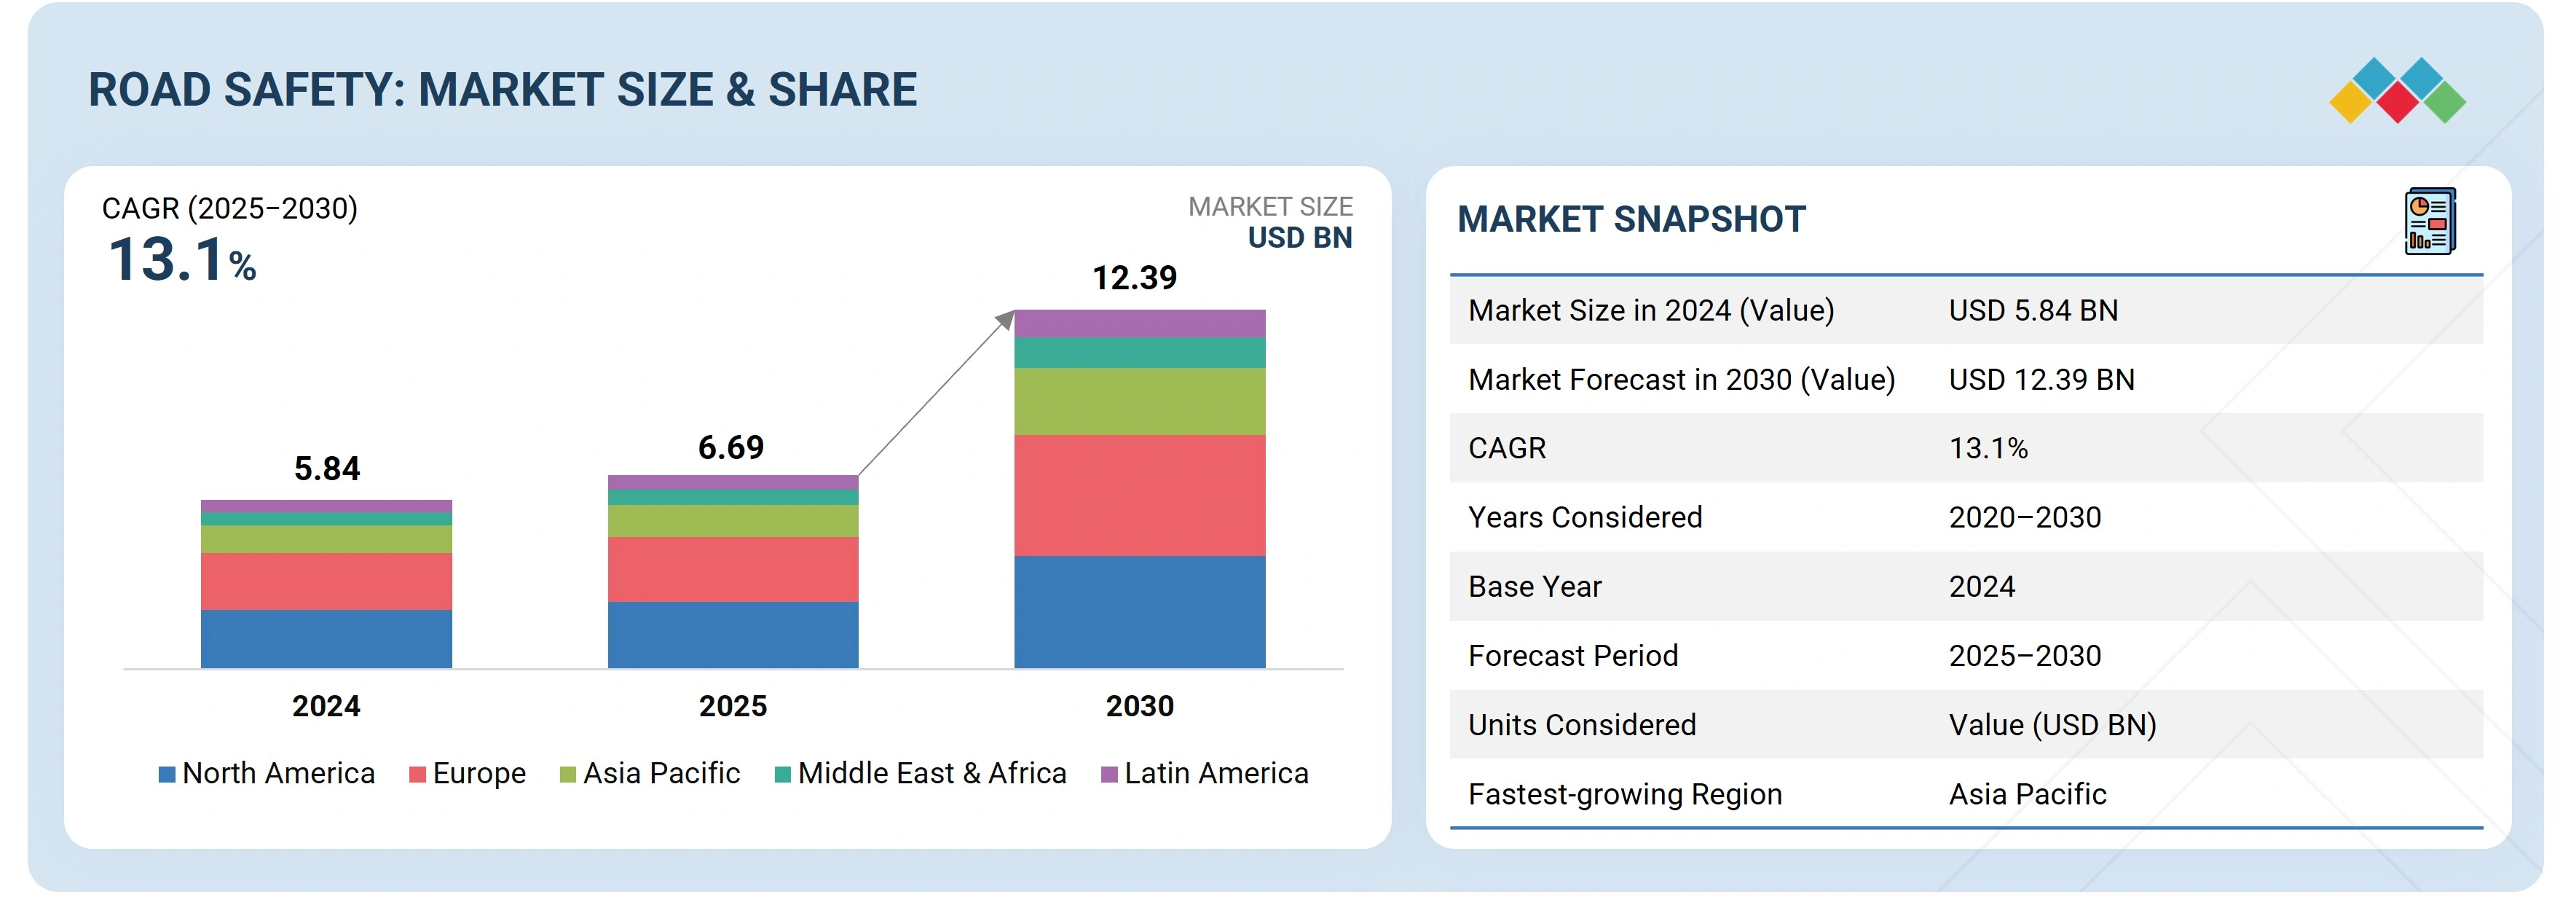
2
RESEARCH METHODOLOGY
42
5
MARKET OVERVIEW AND INDUSTRY TRENDS
Urbanization and tech integration revolutionize road safety, despite privacy and infrastructure challenges.
63
5.2.1.1
Urban surge fuels smart road safety revolution amid rising traffic risks
5.2.1.2
Commercial fleets push for safety-driven operational efficiency
5.2.1.3
Enforcement to improve compliance with governments
5.2.1.4
Adoption of digitalization and technologies in road safety market
5.2.1.5
Government initiatives for enhancing road safety
5.2.2.1
Lack of standardized and uniform technologies
5.2.2.2
Data privacy and surveillance concerns hinder adoption of road safety technologies
5.2.3.1
Improved intelligent transportation systems for road safety
5.2.3.2
Integration of AI and predictive analytics in traffic management systems
5.2.3.3
Evolving 5g technology and transformation of road safety systems
5.2.4.1
Infrastructure gaps and budget constraints limit road safety technology deployment
5.2.4.2
Digital reluctance and fragmentation in legacy fleet segments
5.3
IMPACT OF 2025 US TARIFF ON ROAD SAFETY MARKET
5.3.3
PRICE IMPACT ANALYSIS
5.3.3.1
Strategic shifts and emerging trends
5.3.4
IMPACT ON COUNTRY/REGION
5.3.5
IMPACT ON END-USE INDUSTRIES
5.3.5.1
Government and municipalities
5.3.5.2
Highway authorities
5.3.5.3
Law enforcement agencies
5.3.5.4
Private toll operators
5.3.5.5
Smart city integrator
5.3.5.6
Construction companies
5.4
EVOLUTION OF ROAD SAFETY SOLUTIONS
5.5
SUPPLY CHAIN ANALYSIS
5.6
IMPACT OF GENERATIVE AI ON ROAD SAFETY MARKET
5.6.1
TOP USE CASES & MARKET POTENTIAL
5.6.2
TRAFFIC INCIDENT REPORTING AND DOCUMENTATION
5.6.3
SYNTHETIC DATA GENERATION FOR TRAINING AI MODELS
5.6.4
PREDICTIVE VIOLATION & ACCIDENT RISK MODELING
5.6.5
AUTOMATED PUBLIC AWARENESS CAMPAIGNS
5.6.6
LAW ENFORCEMENT SUPPORT
5.6.7
INFRASTRUCTURE DESIGN & SIMULATION
5.7.1
ROAD SAFETY MARKET: SOLUTION TYPE
5.7.1.1
Enforcement solution
5.7.1.2
ALPR/ANPR (automatic number plate recognition)
5.7.1.3
Incident detection & response
5.7.1.4
Traffic monitoring & control
5.7.1.5
Pedestrian safety solutions
5.8
INVESTMENT LANDSCAPE AND FUNDING SCENARIO
5.9.1
USE CASE 1: SIEMENS HELPED YUNEX TRAFFIC WITH ADAPTIVE TRAFFIC CONTROL AND MANAGEMENT, HIGHWAY, AND TUNNEL AUTOMATION AS WELL AS SMART SOLUTIONS FOR V2X AND ROAD USER CHARGING (TOLLING)
5.9.2
USE CASE 2: MOTOROLA SOLUTIONS HELPED VICTORIA POLICE WITH NUMBER PLATE RECOGNITION WITH ANPR TECHNOLOGY
5.9.3
USE CASE 3: CONDUENT AND HAYDEN AI ANNOUNCED TECHNOLOGY PARTNERSHIP TO IMPROVE BUS LANE PERFORMANCE AND TRAFFIC SAFETY
5.9.4
USE CASE 4: SWARCO ROAD MARKING SYSTEMS AND ISAC GMBH MEASURED DETECTABILITY OF ROAD MARKINGS
5.9.5
CASE STUDY 6: DATA COLLECTION LIMITED ENHANCED ROAD INFRASTRUCTURE MANAGEMENT WITH TELEDYNE FLIR IMAGING SOLUTIONS
5.10.1.1
Artificial intelligence (AI)
5.10.1.2
Internet of things (IoT)
5.10.1.3
Geographic information systems (GIS)
5.10.1.4
Automatic number plate recognition (ANPR)
5.10.1.5
Vehicle-to-infrastructure (V2I) and vehicle-to-everything (V2X)
5.10.2
COMPLEMENTARY TECHNOLOGIES
5.10.2.1
Big data and analytics
5.10.3
ADJACENT TECHNOLOGIES
5.10.3.1
Advanced traffic management systems (ATMS)
5.10.3.2
Smart city solutions
5.11
TARIFF AND REGULATORY LANDSCAPE
5.11.1
TARIFF RELATED TO ROAD SAFETY SOLUTIONS
5.11.2
REGULATORY BODIES, GOVERNMENT AGENCIES, AND OTHER ORGANIZATIONS
5.11.3.4
Middle East & Africa
5.12.1
EXPORT SCENARIO OF ELECTRICAL SIGNALING AND TRAFFIC CONTROL EQUIPMENT (HS CODE 853080)
5.12.2
IMPORT SCENARIO OF ELECTRICAL SIGNALING AND TRAFFIC CONTROL EQUIPMENT (HS CODE 853080)
5.13.2
PATENTS FILED, BY DOCUMENT TYPE
5.13.3
INNOVATION AND PATENT APPLICATIONS
5.14.1
AVERAGE SELLING PRICE OF OFFERING, BY KEY PLAYER, 2025
5.14.2
INDICATIVE PRICING, BY APPLICATION, 2025
5.15
KEY CONFERENCES AND EVENTS (2025–2026)
5.16
PORTER’S FIVE FORCES ANALYSIS
5.16.1
THREAT OF NEW ENTRANTS
5.16.2
THREAT OF SUBSTITUTES
5.16.3
BARGAINING POWER OF BUYERS
5.16.4
BARGAINING POWER OF SUPPLIERS
5.16.5
INTENSITY OF COMPETITIVE RIVALRY
5.17
TRENDS AND DISRUPTIONS IMPACTING BUYERS
5.18
KEY STAKEHOLDERS AND BUYING CRITERIA
5.18.1
KEY STAKEHOLDERS IN BUYING PROCESS
5.19.1
ROAD SAFETY TECHNOLOGY ROADMAP TILL 2030
5.19.1.1
Short-term roadmap (2024–2026)
5.19.1.2
Mid-term roadmap (2026–2028)
5.19.1.3
Long-term roadmap (2028–2030)
5.20
PARTNERSHIP & ECOSYSTEM STRATEGIES
5.20.1
PARTNERSHIP & ECOSYSTEM STRATEGIES
5.21
STRATEGIC IMPERATIVES FOR STAKEHOLDERS
5.21.1
STRATEGIC IMPERATIVES FOR STAKEHOLDERS
6
ROAD SAFETY MARKET, BY OFFERING
Market Size & Growth Rate Forecast Analysis to 2030 in USD Million | 44 Data Tables
119
6.1.1
OFFERING: ROAD SAFETY MARKET DRIVERS
6.2.1
ENABLING SAFER ROADS THROUGH END-TO-END INTELLIGENT TRAFFIC ENFORCEMENT AND MANAGEMENT SOLUTIONS
6.2.2.1
Enforcement solutions
6.2.2.3
Incident detection and response
6.2.2.4
Traffic monitoring & control
6.2.2.5
Pedestrian safety
6.3.1
OFFER PROFESSIONAL AND MANAGED SERVICES FOR INSTALLATION, COMMISSIONING, CALIBRATION, AND FUNCTIONAL TESTING OF CRITICAL ROAD SAFETY EQUIPMENT
6.3.2
PROFESSIONAL SERVICES
6.3.2.2
System integration
6.3.2.4
Road safety audits
6.3.3.1
Outsourced operations
6.3.3.2
System maintenance
6.3.3.3
Analytics-as-a-service
6.3.3.4
Back-office processing
7
ROAD SAFETY MARKET, BY DEPLOYMENT MODEL
Market Size & Growth Rate Forecast Analysis to 2030 in USD Million | 10 Data Tables
155
7.1.1
DEPLOYMENT MODEL: ROAD SAFETY MARKET DRIVERS
7.2.1
ESTABLISHING LONG-TERM AND HIGH-ACCURACY ROAD SAFETY INFRASTRUCTURE AT CRITICAL TRAFFIC ZONES
7.3
MOBILE/TRAILER-MOUNTED SYSTEMS
7.3.1
DEPLOYING SEMI-PERMANENT AND RELOCATABLE TRAFFIC MONITORING UNITS FOR FLEXIBLE AND TARGETED COVERAGE
7.4
PORTABLE/TEMPORARY SOLUTIONS
7.4.1
UTILIZING LIGHTWEIGHT AND RAPIDLY DEPLOYABLE ENFORCEMENT TOOLS FOR SHORT-DURATION OR ON-DEMAND TRAFFIC SAFETY OPERATIONS
7.5
CLOUD-BASED PLATFORMS
7.5.1
IMPLEMENTING CENTRALIZED AND SCALABLE CLOUD-BASED PLATFORMS TO MANAGE, PROCESS, AND ANALYZE ROAD SAFETY DATA IN REAL-TIME
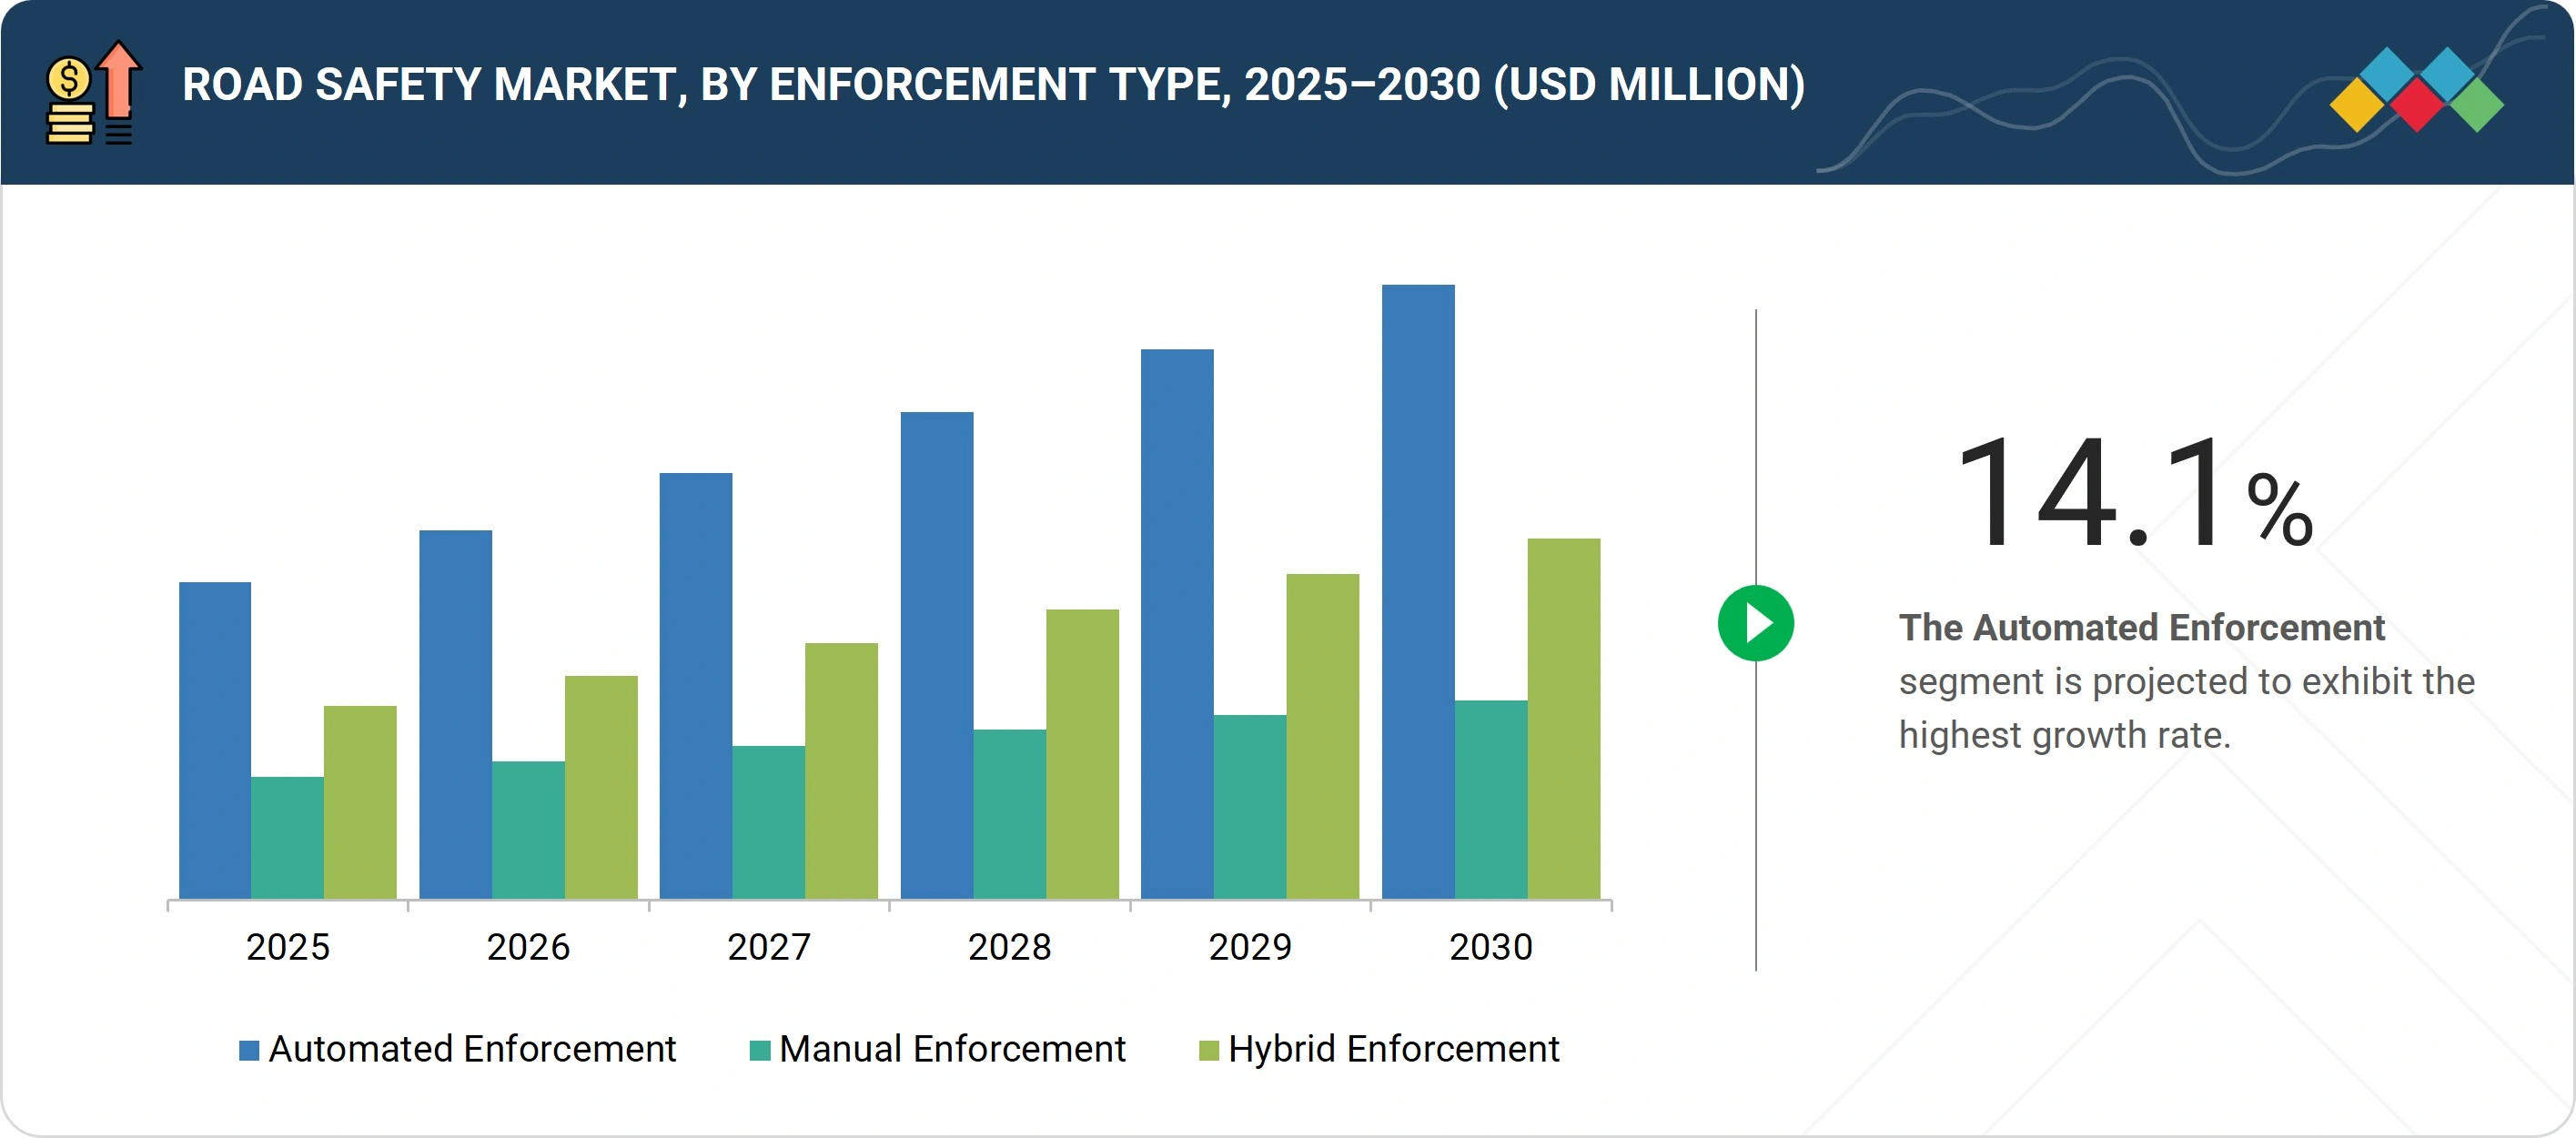
8
ROAD SAFETY MARKET, BY ENFORCEMENT TYPE
Market Size & Growth Rate Forecast Analysis to 2030 in USD Million | 8 Data Tables
162
8.1.1
ENFORCEMENT TYPE: ROAD SAFETY MARKET DRIVERS
8.2
AUTOMATED ENFORCEMENT
8.2.1
DEPLOYING INTELLIGENT TECHNOLOGY-DRIVEN SYSTEMS TO ENABLE CONTINUOUS, UNBIASED, AND FULLY AUTOMATED ENFORCEMENT OF TRAFFIC VIOLATIONS ACROSS DIVERSE ENVIRONMENTS
8.3.1
CONDUCTING FIELD-LEVEL ENFORCEMENT OPERATIONS THROUGH HUMAN INTERVENTION TO ENSURE REGULATORY COMPLIANCE AND ADDRESS SITUATIONAL ROAD SAFETY CHALLENGES
8.4.1
ENSURE RELIABLE, FLEXIBLE, AND REAL-TIME AI DELIVERY WITH ADVANCED MODEL DEPLOYMENT AND SERVING FUNCTIONALITIES
9
ROAD SAFETY MARKET, BY DATA TYPE
Market Size & Growth Rate Forecast Analysis to 2030 in USD Million | 8 Data Tables
168
9.1.1
DATA TYPE: ROAD SAFETY MARKET DRIVERS
9.2.1
HARNESSING REAL-TIME AND HIGH-RESOLUTION VISUAL EVIDENCE THROUGH AI-ENABLED CAMERA NETWORKS TO AUTOMATE VIOLATION DETECTION AND ENHANCE INCIDENT TRACEABILITY IN TRAFFIC ECOSYSTEMS
9.3.1
CONDUCTING DEPLOYING HIGH-PRECISION ROADWAY AND ROADSIDE SENSORS TO CAPTURE REAL-TIME VEHICLE AND TRAFFIC BEHAVIOR DATA FOR CONTINUOUS, NON-VISUAL MONITORING
9.4.1
AGGREGATING CROSS-DOMAIN AND MULTI-SOURCE DATASETS INTO SCALABLE PLATFORMS TO ENABLE PREDICTIVE ROAD SAFETY INTELLIGENCE, OPTIMIZE ENFORCEMENT STRATEGIES
10
ROAD SAFETY MARKET, BY APPLICATION
Market Size & Growth Rate Forecast Analysis to 2030 in USD Million | 20 Data Tables
174
10.1.1
APPLICATION: ROAD SAFETY MARKET DRIVERS
10.2
VIOLATION MANAGEMENT
10.2.1
IMPLEMENTING INTELLIGENT ROAD SAFETY SOLUTIONS TO AUTOMATE VIOLATION DETECTION AND STREAMLINE CITATION PROCESSING FOR SAFER ROAD NETWORKS
10.3
TRAFFIC OPTIMIZATION
10.3.1
USING DATA-DRIVEN CONTROL STRATEGIES AND REAL-TIME OPTIMIZATION TECHNOLOGIES WILL REDUCE CONGESTION AND ENHANCE MOBILITY ACROSS URBAN ROAD NETWORKS
10.4.1
DEPLOYING PREDICTIVE ANALYTICS AND ENVIRONMENTAL SENSING TECHNOLOGIES TO IDENTIFY RISK ZONES AND IMPLEMENT PROACTIVE MEASURES
10.5.1
ENABLING ACCELERATED INCIDENT DETECTION AND REAL-TIME COORDINATION OF EMERGENCY SERVICES TO REDUCE RESPONSE TIME
10.6
DRIVER BEHAVIOR MONITORING
10.6.1
LEVERAGING IN-VEHICLE ANALYTICS AND SENSOR FUSION TO TRACK AND CORRECT UNSAFE DRIVING BEHAVIORS FOR LONG-TERM BEHAVIORAL CHANGE AND CRASH REDUCTION
10.7
PUBLIC AWARENESS/TRAINING
10.7.1
PROMOTING ROAD SAFETY CULTURE THROUGH IMMERSIVE AWARENESS PROGRAMS AND STRUCTURED TRAINING
10.8
PEDESTRIAN & VRU PROTECTION
10.8.1
INTEGRATING SMART INFRASTRUCTURE AND DETECTION SYSTEMS TO SAFEGUARD PEDESTRIANS AND VULNERABLE ROAD USERS THROUGH REAL-TIME ALERTS
10.9
WORK ZONE SAFETY MANAGEMENT
10.9.1
ENHANCING SAFETY IN ACTIVE WORK ZONES BY DEPLOYING CONNECTED ENFORCEMENT SYSTEMS AND DYNAMIC WARNINGS TO PREVENT COLLISIONS AND PROTECT ROAD CREWS
10.10
INSURANCE RISK ASSESSMENT
10.10.1
UTILIZING BEHAVIORAL ANALYTICS AND TELEMATICS TO ACCURATELY ASSESS DRIVER RISK PROFILES AND INFORM DYNAMIC, USAGE-BASED INSURANCE AND SAFETY STRATEGIES
11
ROAD SAFETY MARKET, BY END USER
Market Size & Growth Rate Forecast Analysis to 2030 in USD Million | 16 Data Tables
187
11.1.1
END USER: ROAD SAFETY MARKET DRIVERS
11.2
GOVERNMENT & MUNICIPALITIES
11.2.1
GOVERNMENTS AND MUNICIPALITIES LEAD ROAD SAFETY EFFORTS THROUGH FUNDING, REGULATION, AND SMART CITY INITIATIVES
11.3.1
HIGHWAY AUTHORITIES ADOPT SMART INFRASTRUCTURE TO ENSURE SAFETY ON HIGH-SPEED ROAD NETWORKS
11.4
LAW ENFORCEMENT AGENCIES
11.4.1
LAW ENFORCEMENT AGENCIES EMBRACE SURVEILLANCE AND ANALYTICS TO MONITOR AND CONTROL TRAFFIC VIOLATIONS
11.5
PRIVATE TOLL OPERATORS
11.5.1
TOLL OPERATORS INVEST IN INTELLIGENT SYSTEMS TO ENSURE SAFE, EFFICIENT, AND COMPLIANT ROAD USAGE
11.6
SMART CITY INTEGRATORS
11.6.1
SMART CITY INTEGRATORS EMBED ROAD SAFETY WITHIN BROADER URBAN DIGITAL INFRASTRUCTURE
11.7
CONSTRUCTION COMPANIES
11.7.1
CONSTRUCTION FIRMS IMPLEMENT SAFETY PROTOCOLS AND TECHNOLOGIES ACROSS ROAD DEVELOPMENT PHASES
12
ROAD SAFETY MARKET, BY REGION
Market Size & Growth Rate Forecast Analysis to 2030 in USD Million | 180 Data Tables
198
12.2.1
NORTH AMERICA: ROAD SAFETY MARKET DRIVERS
12.2.2
NORTH AMERICA: MACROECONOMIC OUTLOOK
12.2.3.1
Institutionalized cross-sector data integration and predictive enforcement to scale vision zero across diverse urban and rural mobility ecosystems
12.2.4.1
Align safety modernization with climate goals through municipal co-funding, open data mandates, and community-based AI enforcement
12.3.1
EUROPE: ROAD SAFETY MARKET DRIVERS
12.3.2
EUROPE: MACROECONOMIC OUTLOOK
12.3.3.1
UK’s nationwide deployment of AI-powered speed enforcement, smart crossings, and connected mobility zones to drive toward zero fatalities
12.3.4.1
Germany scaling road safety through V2X integration, dynamic lane controls, and urban zero-vision zones
12.3.5.1
France’s tech-driven road safety surge expanding autonomous radar networks, smart signage, and urban speed harmonization
12.3.6.1
Italy building safer streets through urban ITS deployment, smart crosswalks, and behavioral analytics to protect vulnerable road users
12.3.7.1
Spain’s smart enforcement strategy scaling intelligent cameras, real-time incident detection, and speed harmonization for safer mobility
12.4.1
ASIA PACIFIC: ROAD SAFETY MARKET DRIVER
12.4.2
ASIA PACIFIC: MACROECONOMIC OUTLOOK
12.4.3.1
China scales AI-driven enforcement in tier 2/3 cities
12.4.4.1
Japan deploying smart crosswalks with embedded led alerts and pedestrian protection systems
12.4.5.1
Accelerating road safety transformation through data-driven enforcement and public-private innovation
12.4.6
AUSTRALIA & NEW ZEALAND
12.4.6.1
Pioneering smart safety through predictive analytics and digital infrastructure for zero fatality roads
12.4.7.1
Unlocking scalable road safety through regional standards and smart mobility innovation
12.4.8.1
Korea driving Vision Zero through AI-powered pedestrian safety and urban intelligence
12.4.9
REST OF ASIA PACIFIC
12.5
MIDDLE EAST & AFRICA
12.5.1
MIDDLE EAST & AFRICA: ROAD SAFETY MARKET DRIVERS
12.5.2
MIDDLE EAST & AFRICA: MACROECONOMIC OUTLOOK
12.5.3.1
Drive holistic integration of AI, infrastructure, and enforcement under Vision 2030 mobility goals
12.5.4
UNITED ARAB EMIRATES (UAE)
12.5.4.1
Expand interoperable urban safety platforms leveraging AI, V2X, and municipal data integration
12.5.5.1
Expansion of multi-layered safety programs integrating enforcement, education, and urban design in high-risk zones
12.5.6.1
Leveraging world cup infrastructure legacy to build scalable, high-compliance smart enforcement mode
12.5.7
REST OF MIDDLE EAST & AFRICA
12.6.1
LATIN AMERICA: ROAD SAFETY MARKET DRIVERS
12.6.2
LATIN AMERICA: MACROECONOMIC OUTLOOK
12.6.3.1
Modernizing legacy enforcement networks through regionalized, data-centric road safety platforms
12.6.4.1
Expansion of municipal safety intelligence systems to address VRU vulnerability and informal transit risks
12.6.5.1
Strengthening of data-driven enforcement and crash analytics amid institutional decentralization
12.6.6
REST OF LATIN AMERICA
13
COMPETITIVE LANDSCAPE
Uncover strategic shifts and market dominance in road safety tech from 2022 to 2025.
268
13.2
KEY PLAYER STRATEGIES/RIGHT TO WIN, 2022–2025
13.3
REVENUE ANALYSIS, 2020–2024
13.4
MARKET SHARE ANALYSIS, 2024
13.4.1
MARKET RANKING ANALYSIS
13.5
PRODUCT COMPARATIVE ANALYSIS
13.5.1
PRODUCT COMPARATIVE ANALYSIS, BY HARDWARE (ROAD SAFETY)
13.5.1.1
TruSpeed Laser (Laser Technology)
13.5.1.2
Redflex RadarCam (Traffic Management Technologies)
13.5.1.3
Enforcer Portable System (Trifoil Group)
13.5.1.4
Camera-based Speed System (Syntell)
13.5.1.5
Gatso T-Series (Sensys Gatso Group)
13.5.2
PRODUCT COMPARATIVE ANALYSIS, BY SOFTWARE (ROAD SAFETY)
13.5.2.1
TRIPS platform (Fred Engineering)
13.5.2.2
Behavior AI (Humanising Autonomy)
13.5.2.3
SafeCam AI (Vebits AI)
13.5.2.4
SmartMobility Suite (Connected Wise)
13.5.2.5
LiveRoad Insights (LiveRoad Analytics)
13.6
COMPANY VALUATION AND FINANCIAL METRICS
13.7
COMPANY EVALUATION MATRIX: KEY PLAYERS, 2024
13.7.5
COMPANY FOOTPRINT: KEY PLAYERS, 2024
13.7.5.1
Company footprint
13.7.5.2
Regional footprint
13.7.5.3
Offering footprint
13.7.5.4
Application footprint
13.7.5.5
End user footprint
13.8
COMPANY EVALUATION MATRIX: STARTUPS/SMES (HARDWARE), 2024
13.8.1
PROGRESSIVE COMPANIES
13.8.2
RESPONSIVE COMPANIES
13.9
COMPANY EVALUATION MATRIX: STARTUPS/SMES (SOFTWARE), 2024
13.9.1
PROGRESSIVE COMPANIES
13.9.2
RESPONSIVE COMPANIES
13.9.5
COMPETITIVE BENCHMARKING: STARTUPS/SMES, 2024
13.9.5.1
Detailed list of key startups/SMEs
13.9.5.2
Competitive benchmarking of key startups/SMEs (hardware)
13.9.5.3
Competitive benchmarking of key startups/SMEs (software)
13.10
COMPETITIVE SCENARIO AND TRENDS
13.10.1
PRODUCT LAUNCHES AND ENHANCEMENTS
14
COMPANY PROFILES
In-depth Company Profiles of Leading Market Players with detailed Business Overview, Product and Service Portfolio, Recent Developments, and Unique Analyst Perspective (MnM View)
294
14.1.1.1
Business overview
14.1.1.2
Products/Solutions/Services offered
14.1.1.3
Recent developments
14.1.3
SENSYS GATSO GROUP
14.1.6
MOTOROLA SOLUTIONS
14.1.12
CUBIC CORPORATION
14.1.14
LASER TECHNOLOGIES
14.2.1
TRAFFIC MANAGEMENT TECHNOLOGIES
14.2.6
CLEARVIEW INTELLIGENCE
14.2.10
HUMANISING AUTONOMY
14.2.12
CONNECTED WISE LLC
14.2.14
LIVEROAD ANALYTICS
15
ADJACENT AND RELATED MARKETS
360
15.2
TRAFFIC MANAGEMENT MARKET - GLOBAL FORECAST TO 2029
15.2.2.1
Traffic management market, by offering
15.2.2.2
Traffic management market, by area of application
15.2.2.3
Traffic management market, by end user
15.2.2.4
Traffic management market, by region
15.3
SMART TRANSPORTATION MARKET - GLOBAL FORECAST TO 2029
15.3.2.1
Smart transportation market, by transportation mode
15.3.2.2
Smart transportation market, by roadway
15.3.2.3
Smart transportation market, by railway
15.3.2.4
Smart transportation market, by airway
15.3.2.5
Smart transportation market, by maritime
15.3.2.6
Smart transportation market, by region
16.2
KNOWLEDGESTORE: MARKETSANDMARKETS’ SUBSCRIPTION PORTAL
16.3
CUSTOMIZATION OPTIONS
TABLE 1
UNITED STATES DOLLAR EXCHANGE RATE, 2020–2024
TABLE 3
GLOBAL ROAD SAFETY MARKET SIZE AND GROWTH RATE, 2020–2024 (USD MILLION, Y-O-Y %)
TABLE 4
GLOBAL ROAD SAFETY MARKET SIZE AND GROWTH RATE, 2025–2030 (USD MILLION, Y-O-Y %)
TABLE 5
US: ADJUSTED RECIPROCAL TARIFF RATES
TABLE 6
EXPECTED CHANGE IN PRICES AND LIKELY IMPACT ON END-USE MARKET DUE TO TARIFF IMPACT
TABLE 7
ROAD SAFETY MARKET: ECOSYSTEM
TABLE 8
TARIFF RELATED TO ELECTRICAL SIGNALING, SAFETY, AND TRAFFIC CONTROL EQUIPMENT
TABLE 9
NORTH AMERICA: REGULATORY BODIES, GOVERNMENT AGENCIES, AND OTHER ORGANIZATIONS
TABLE 10
EUROPE: REGULATORY BODIES, GOVERNMENT AGENCIES, AND OTHER ORGANIZATIONS
TABLE 11
ASIA PACIFIC: REGULATORY BODIES, GOVERNMENT AGENCIES, AND OTHER ORGANIZATIONS
TABLE 12
REST OF THE WORLD: REGULATORY BODIES, GOVERNMENT AGENCIES, AND OTHER ORGANIZATIONS
TABLE 13
EXPORT DATA FOR HS CODE 853080 - ELECTRICAL SIGNALING AND TRAFFIC CONTROL EQUIPMENT, BY COUNTRY, 2020-2024 (USD MILLION)
TABLE 14
IMPORT DATA FOR HS CODE 853080 - ELECTRICAL SIGNALING AND TRAFFIC CONTROL EQUIPMENT, BY COUNTRY, 2020-2024 (USD MILLION)
TABLE 15
PATENTS FILED, 2016–2025
TABLE 16
LIST OF TOP PATENTS IN ROAD SAFETY MARKET, 2024-2025
TABLE 17
PRICING DATA OF ROAD SAFETY MARKET, BY OFFERING
TABLE 18
PRICING DATA OF ROAD SAFETY MARKET, BY APPLICATION
TABLE 19
ROAD SAFETY MARKET: DETAILED LIST OF CONFERENCES AND EVENTS
TABLE 20
ROAD SAFETY MARKET: PORTER’S FIVE FORCES MODEL
TABLE 21
INFLUENCE OF STAKEHOLDERS ON BUYING PROCESS FOR TOP THREE APPLICATIONS
TABLE 22
KEY BUYING CRITERIA FOR TOP THREE APPLICATIONS
TABLE 23
PARTNERSHIP TYPE AND STRATEGIC VALUE
TABLE 24
STRATEGIC IMPERATIVES FOR STAKEHOLDERS
TABLE 25
ROAD SAFETY MARKET, BY OFFERING, 2020–2024 (USD MILLION)
TABLE 26
ROAD SAFETY MARKET, BY OFFERING, 2025–2030 (USD MILLION)
TABLE 27
ROAD SAFETY MARKET, BY SOLUTION, 2020–2024 (USD MILLION)
TABLE 28
ROAD SAFETY MARKET, BY SOLUTION, 2025–2030 (USD MILLION)
TABLE 29
ROAD SAFETY MARKET, BY SOLUTION TYPE, 2020–2024 (USD MILLION)
TABLE 30
ROAD SAFETY MARKET, BY SOLUTION TYPE, 2025–2030 (USD MILLION)
TABLE 31
ENFORCEMENT SOLUTIONS: ROAD SAFETY MARKET, BY REGION, 2020–2024 (USD MILLION)
TABLE 32
ENFORCEMENT SOLUTIONS: ROAD SAFETY MARKET, BY REGION, 2025–2030 (USD MILLION)
TABLE 33
ALPR/ANPR: ROAD SAFETY MARKET, BY REGION, 2020–2024 (USD MILLION)
TABLE 34
ALPR/ANPR: ROAD SAFETY MARKET, BY REGION, 2025–2030 (USD MILLION)
TABLE 35
INCIDENT DETECTION AND RESPONSE: ROAD SAFETY MARKET, BY REGION, 2020–2024 (USD MILLION)
TABLE 36
INCIDENT DETECTION AND RESPONSE: ROAD SAFETY MARKET, BY REGION, 2025–2030 (USD MILLION)
TABLE 37
TRAFFIC MONITORING & CONTROL: ROAD SAFETY MARKET, BY REGION, 2020–2024 (USD MILLION)
TABLE 38
TRAFFIC MONITORING & CONTROL: ROAD SAFETY MARKET, BY REGION, 2025–2030 (USD MILLION)
TABLE 39
PEDESTRIAN SAFETY: ROAD SAFETY MARKET, BY REGION, 2020–2024 (USD MILLION)
TABLE 40
PEDESTRIAN SAFETY: ROAD SAFETY MARKET, BY REGION, 2025–2030 (USD MILLION)
TABLE 41
ROAD SAFETY MARKET, BY COMPONENT, 2020–2024 (USD MILLION)
TABLE 42
ROAD SAFETY MARKET, BY COMPONENT, 2025–2030 (USD MILLION)
TABLE 43
HARDWARE: ROAD SAFETY MARKET, BY REGION, 2020–2024 (USD MILLION)
TABLE 44
HARDWARE: ROAD SAFETY MARKET, BY REGION, 2025–2030 (USD MILLION)
TABLE 45
SOFTWARE: ROAD SAFETY MARKET, BY REGION, 2020–2024 (USD MILLION)
TABLE 46
SOFTWARE: ROAD SAFETY MARKET, BY REGION, 2025–2030 (USD MILLION)
TABLE 47
ROAD SAFETY MARKET, BY SERVICE, 2020–2024 (USD MILLION)
TABLE 48
ROAD SAFETY MARKET, BY SERVICE, 2025–2030 (USD MILLION)
TABLE 49
PROFESSIONAL SERVICES: ROAD SAFETY MARKET, BY TYPE, 2020–2024 (USD MILLION)
TABLE 50
PROFESSIONAL SERVICES: ROAD SAFETY MARKET, BY TYPE, 2025–2030 (USD MILLION)
TABLE 51
CONSULTING: ROAD SAFETY MARKET, BY REGION, 2020–2024 (USD MILLION)
TABLE 52
CONSULTING: ROAD SAFETY MARKET, BY REGION, 2025–2030 (USD MILLION)
TABLE 53
SYSTEM INTEGRATION: ROAD SAFETY MARKET, BY REGION, 2020–2024 (USD MILLION)
TABLE 54
SYSTEM INTEGRATION: ROAD SAFETY MARKET, BY REGION, 2025–2030 (USD MILLION)
TABLE 55
TRAINING: ROAD SAFETY MARKET, BY REGION, 2020–2024 (USD MILLION)
TABLE 56
TRAINING: ROAD SAFETY MARKET, BY REGION, 2025–2030 (USD MILLION)
TABLE 57
ROAD SAFETY AUDITS: ROAD SAFETY MARKET, BY REGION, 2020–2024 (USD MILLION)
TABLE 58
ROAD SAFETY AUDITS: ROAD SAFETY MARKET, BY REGION, 2025–2030 (USD MILLION)
TABLE 59
MANAGED SERVICES: ROAD SAFETY MARKET, BY TYPE, 2020–2024 (USD MILLION)
TABLE 60
MANAGED SERVICES: ROAD SAFETY MARKET, BY TYPE, 2025–2030 (USD MILLION)
TABLE 61
OUTSOURCED OPERATIONS: ROAD SAFETY MARKET, BY REGION, 2020–2024 (USD MILLION)
TABLE 62
OUTSOURCED OPERATIONS: ROAD SAFETY MARKET, BY REGION, 2025–2030 (USD MILLION)
TABLE 63
SYSTEM MAINTENANCE: ROAD SAFETY MARKET, BY REGION, 2020–2024 (USD MILLION)
TABLE 64
SYSTEM MAINTENANCE: ROAD SAFETY MARKET, BY REGION, 2025–2030 (USD MILLION)
TABLE 65
ANALYTICS-AS-A-SERVICE: ROAD SAFETY MARKET, BY REGION, 2020–2024 (USD MILLION)
TABLE 66
ANALYTICS-AS-A-SERVICE: ROAD SAFETY MARKET, BY REGION, 2025–2030 (USD MILLION)
TABLE 67
BACK-OFFICE PROCESSING: ROAD SAFETY MARKET, BY REGION, 2020–2024 (USD MILLION)
TABLE 68
BACK-OFFICE PROCESSING: ROAD SAFETY MARKET, BY REGION, 2025–2030 (USD MILLION)
TABLE 69
ROAD SAFETY MARKET, BY DEPLOYMENT MODEL, 2020–2024 (USD MILLION)
TABLE 70
ROAD SAFETY MARKET, BY DEPLOYMENT MODEL, 2025–2030 (USD MILLION)
TABLE 71
FIXED INSTALLATIONS: ROAD SAFETY MARKET, BY REGION, 2020–2024 (USD MILLION)
TABLE 72
FIXED INSTALLATIONS: ROAD SAFETY MARKET, BY REGION, 2025–2030 (USD MILLION)
TABLE 73
MOBILE/TRAILER-MOUNTED SYSTEMS: ROAD SAFETY MARKET, BY REGION, 2020–2024 (USD MILLION)
TABLE 74
MOBILE/TRAILER-MOUNTED SYSTEMS: ROAD SAFETY MARKET, BY REGION, 2025–2030 (USD MILLION)
TABLE 75
PORTABLE/TEMPORARY SOLUTIONS: ROAD SAFETY MARKET, BY REGION, 2020–2024 (USD MILLION)
TABLE 76
PORTABLE/TEMPORARY SOLUTIONS: ROAD SAFETY MARKET, BY REGION, 2025–2030 (USD MILLION)
TABLE 77
CLOUD-BASED PLATFORMS: ROAD SAFETY MARKET, BY REGION, 2020–2024 (USD MILLION)
TABLE 78
CLOUD-BASED PLATFORMS: ROAD SAFETY MARKET, BY REGION, 2025–2030 (USD MILLION)
TABLE 79
ROAD SAFETY MARKET, BY ENFORCEMENT TYPE, 2020–2024 (USD MILLION)
TABLE 80
ROAD SAFETY MARKET, BY ENFORCEMENT TYPE, 2025–2030 (USD MILLION)
TABLE 81
AUTOMATED ENFORCEMENT: ROAD SAFETY MARKET, BY REGION, 2020–2024 (USD MILLION)
TABLE 82
AUTOMATED ENFORCEMENT: ROAD SAFETY MARKET, BY REGION, 2025–2030 (USD MILLION)
TABLE 83
MANUAL ENFORCEMENT: ROAD SAFETY MARKET, BY REGION, 2020–2024 (USD MILLION)
TABLE 84
MANUAL ENFORCEMENT: ROAD SAFETY MARKET, BY REGION, 2025–2030 (USD MILLION)
TABLE 85
HYBRID ENFORCEMENT: ROAD SAFETY MARKET, BY REGION, 2020–2024 (USD MILLION)
TABLE 86
HYBRID ENFORCEMENT: ROAD SAFETY MARKET, BY REGION, 2025–2030 (USD MILLION)
TABLE 87
ROAD SAFETY MARKET, BY DATA TYPE, 2020–2024 (USD MILLION)
TABLE 88
ROAD SAFETY MARKET, BY DATA TYPE, 2025–2030 (USD MILLION)
TABLE 89
VIDEO & IMAGE: ROAD SAFETY MARKET, BY REGION, 2020–2024 (USD MILLION)
TABLE 90
VIDEO & IMAGE: ROAD SAFETY MARKET, BY REGION, 2025–2030 (USD MILLION)
TABLE 91
SENSOR DATA: ROAD SAFETY MARKET, BY REGION, 2020–2024 (USD MILLION)
TABLE 92
SENSOR DATA: ROAD SAFETY MARKET, BY REGION, 2025–2030 (USD MILLION)
TABLE 93
INTEGRATED BIG DATA: ROAD SAFETY MARKET, BY REGION, 2020–2024 (USD MILLION)
TABLE 94
INTEGRATED BIG DATA: ROAD SAFETY MARKET, BY REGION, 2025–2030 (USD MILLION)
TABLE 95
ROAD SAFETY MARKET, BY APPLICATION, 2020–2024 (USD MILLION)
TABLE 96
ROAD SAFETY MARKET, BY APPLICATION, 2025–2030 (USD MILLION)
TABLE 97
VIOLATION MANAGEMENT: ROAD SAFETY MARKET, BY REGION, 2020–2024 (USD MILLION)
TABLE 98
VIOLATION MANAGEMENT: ROAD SAFETY MARKET, BY REGION, 2025–2030 (USD MILLION)
TABLE 99
TRAFFIC OPTIMIZATION: ROAD SAFETY MARKET, BY REGION, 2020–2024 (USD MILLION)
TABLE 100
TRAFFIC OPTIMIZATION: ROAD SAFETY MARKET, BY REGION, 2025–2030 (USD MILLION)
TABLE 101
ACCIDENT PREVENTION: ROAD SAFETY MARKET, BY REGION, 2020–2024 (USD MILLION)
TABLE 102
ACCIDENT PREVENTION: ROAD SAFETY MARKET, BY REGION, 2025–2030 (USD MILLION)
TABLE 103
EMERGENCY RESPONSE: ROAD SAFETY MARKET, BY REGION, 2020–2024 (USD MILLION)
TABLE 104
EMERGENCY RESPONSE: ROAD SAFETY MARKET, BY REGION, 2025–2030 (USD MILLION)
TABLE 105
DRIVER BEHAVIOR MONITORING: ROAD SAFETY MARKET, BY REGION, 2020–2024 (USD MILLION)
TABLE 106
DRIVER BEHAVIOR MONITORING: ROAD SAFETY MARKET, BY REGION, 2025–2030 (USD MILLION)
TABLE 107
PUBLIC AWARENESS/TRAINING: ROAD SAFETY MARKET, BY REGION, 2020–2024 (USD MILLION)
TABLE 108
PUBLIC AWARENESS/TRAINING: ROAD SAFETY MARKET, BY REGION, 2025–2030 (USD MILLION)
TABLE 109
PEDESTRIAN & VRU PROTECTION: ROAD SAFETY MARKET, BY REGION, 2020–2024 (USD MILLION)
TABLE 110
PEDESTRIAN & VRU PROTECTION: ROAD SAFETY MARKET, BY REGION, 2025–2030 (USD MILLION)
TABLE 111
WORK ZONE SAFETY MANAGEMENT: ROAD SAFETY MARKET, BY REGION, 2020–2024 (USD MILLION)
TABLE 112
WORK ZONE SAFETY MANAGEMENT: ROAD SAFETY MARKET, BY REGION, 2025–2030 (USD MILLION)
TABLE 113
INSURANCE RISK ASSESSMENT: ROAD SAFETY MARKET, BY REGION, 2020–2024 (USD MILLION)
TABLE 114
INSURANCE RISK ASSESSMENT: ROAD SAFETY MARKET, BY REGION, 2025–2030 (USD MILLION)
TABLE 115
ROAD SAFETY MARKET, BY END USER, 2020–2024 (USD MILLION)
TABLE 116
ROAD SAFETY MARKET, BY END USER, 2025–2030 (USD MILLION)
TABLE 117
GOVERNMENT & MUNICIPALITIES: ROAD SAFETY MARKET, BY REGION, 2020–2024 (USD MILLION)
TABLE 118
GOVERNMENT & MUNICIPALITIES: ROAD SAFETY MARKET, BY REGION, 2025–2030 (USD MILLION)
TABLE 119
HIGHWAY AUTHORITIES: ROAD SAFETY MARKET, BY REGION, 2020–2024 (USD MILLION)
TABLE 120
HIGHWAY AUTHORITIES: ROAD SAFETY MARKET, BY REGION, 2025–2030 (USD MILLION)
TABLE 121
LAW ENFORCEMENT AGENCIES: ROAD SAFETY MARKET, BY REGION, 2020–2024 (USD MILLION)
TABLE 122
LAW ENFORCEMENT AGENCIES: ROAD SAFETY MARKET, BY REGION, 2025–2030 (USD MILLION)
TABLE 123
PRIVATE TOLL OPERATORS: ROAD SAFETY MARKET, BY REGION, 2020–2024 (USD MILLION)
TABLE 124
PRIVATE TOLL OPERATORS: ROAD SAFETY MARKET, BY REGION, 2025–2030 (USD MILLION)
TABLE 125
SMART CITY INTEGRATORS: ROAD SAFETY MARKET, BY REGION, 2020–2024 (USD MILLION)
TABLE 126
SMART CITY INTEGRATORS: ROAD SAFETY MARKET, BY REGION, 2025–2030 (USD MILLION)
TABLE 127
CONSTRUCTION COMPANIES: ROAD SAFETY MARKET, BY REGION, 2020–2024 (USD MILLION)
TABLE 128
CONSTRUCTION COMPANIES: ROAD SAFETY MARKET, BY REGION, 2025–2030 (USD MILLION)
TABLE 129
OTHER END USERS: ROAD SAFETY MARKET, BY REGION, 2020–2024 (USD MILLION)
TABLE 130
OTHER END USERS: ROAD SAFETY MARKET, BY REGION, 2025–2030 (USD MILLION)
TABLE 131
ROAD SAFETY MARKET, BY REGION, 2020–2024 (USD MILLION)
TABLE 132
ROAD SAFETY MARKET, BY REGION, 2025–2030 (USD MILLION)
TABLE 133
NORTH AMERICA: ROAD SAFETY MARKET, BY OFFERING, 2020–2024 (USD MILLION)
TABLE 134
NORTH AMERICA: ROAD SAFETY MARKET, BY OFFERING,2025–2030 (USD MILLION)
TABLE 135
NORTH AMERICA: ROAD SAFETY MARKET, BY SOLUTION, 2020–2024 (USD MILLION)
TABLE 136
NORTH AMERICA: ROAD SAFETY MARKET, BY SOLUTION, 2025–2030 (USD MILLION)
TABLE 137
NORTH AMERICA: ROAD SAFETY MARKET, BY SOLUTION TYPE, 2020–2024 (USD MILLION)
TABLE 138
NORTH AMERICA: ROAD SAFETY MARKET, BY SOLUTION TYPE, 2025–2030 (USD MILLION)
TABLE 139
NORTH AMERICA: ROAD SAFETY MARKET, BY COMPONENT, 2020–2024 (USD MILLION)
TABLE 140
NORTH AMERICA: ROAD SAFETY MARKET, BY COMPONENT, 2025–2030 (USD MILLION)
TABLE 141
NORTH AMERICA: ROAD SAFETY MARKET, BY SERVICE, 2020–2024 (USD MILLION)
TABLE 142
NORTH AMERICA: ROAD SAFETY MARKET, BY SERVICE, 2025–2030 (USD MILLION)
TABLE 143
NORTH AMERICA: ROAD SAFETY MARKET, BY PROFESSIONAL SERVICE, 2020–2024 (USD MILLION)
TABLE 144
NORTH AMERICA: ROAD SAFETY MARKET, BY PROFESSIONAL SERVICE, 2025–2030 (USD MILLION)
TABLE 145
NORTH AMERICA: ROAD SAFETY MARKET, BY MANAGED SERVICE, 2020–2024 (USD MILLION)
TABLE 146
NORTH AMERICA: ROAD SAFETY MARKET, BY MANAGED SERVICE, 2025–2030 (USD MILLION)
TABLE 147
NORTH AMERICA: ROAD SAFETY MARKET, BY DEPLOYMENT MODEL, 2020–2024 (USD MILLION)
TABLE 148
NORTH AMERICA: ROAD SAFETY MARKET, BY DEPLOYMENT MODEL,2025–2030 (USD MILLION)
TABLE 149
NORTH AMERICA: ROAD SAFETY MARKET, BY ENFORCEMENT TYPE, 2020–2024 (USD MILLION)
TABLE 150
NORTH AMERICA: ROAD SAFETY MARKET, BY ENFORCEMENT TYPE, 2025–2030 (USD MILLION)
TABLE 151
NORTH AMERICA: ROAD SAFETY MARKET, BY DATA TYPE, 2020–2024 (USD MILLION)
TABLE 152
NORTH AMERICA: ROAD SAFETY MARKET, BY DATA TYPE, 2025–2030 (USD MILLION)
TABLE 153
NORTH AMERICA: ROAD SAFETY MARKET, BY APPLICATION, 2020–2024 (USD MILLION)
TABLE 154
NORTH AMERICA: ROAD SAFETY MARKET, BY APPLICATION, 2025–2030 (USD MILLION)
TABLE 155
NORTH AMERICA: ROAD SAFETY MARKET, BY END USER, 2020–2024 (USD MILLION)
TABLE 156
NORTH AMERICA: ROAD SAFETY MARKET, BY END USER, 2025–2030 (USD MILLION)
TABLE 157
NORTH AMERICA: ROAD SAFETY MARKET, BY COUNTRY, 2020–2024 (USD MILLION)
TABLE 158
NORTH AMERICA: ROAD SAFETY MARKET, BY COUNTRY, 2025–2030 (USD MILLION)
TABLE 159
US: ROAD SAFETY MARKET, BY OFFERING, 2020–2024 (USD MILLION)
TABLE 160
US: ROAD SAFETY MARKET, BY OFFERING, 2025–2030 (USD MILLION)
TABLE 161
CANADA: ROAD SAFETY MARKET, BY OFFERING, 2020–2024 (USD MILLION)
TABLE 162
CANADA: ROAD SAFETY MARKET, BY OFFERING, 2025–2030 (USD MILLION)
TABLE 163
EUROPE: ROAD SAFETY MARKET, BY OFFERING, 2020–2024 (USD MILLION)
TABLE 164
EUROPE: ROAD SAFETY MARKET, BY OFFERING, 2025–2030 (USD MILLION)
TABLE 165
EUROPE: ROAD SAFETY MARKET, BY SOLUTION, 2020–2024 (USD MILLION)
TABLE 166
EUROPE: ROAD SAFETY MARKET, BY SOLUTION, 2025–2030 (USD MILLION)
TABLE 167
EUROPE: ROAD SAFETY MARKET, BY SOLUTION TYPE, 2020–2024 (USD MILLION)
TABLE 168
EUROPE: ROAD SAFETY MARKET, BY SOLUTION TYPE, 2025–2030 (USD MILLION)
TABLE 169
EUROPE: ROAD SAFETY MARKET, BY COMPONENT, 2020–2024 (USD MILLION)
TABLE 170
EUROPE: ROAD SAFETY MARKET, BY COMPONENT, 2025–2030 (USD MILLION)
TABLE 171
EUROPE: ROAD SAFETY MARKET, BY SERVICE, 2020–2024 (USD MILLION)
TABLE 172
EUROPE: ROAD SAFETY MARKET, BY SERVICE, 2025–2030 (USD MILLION)
TABLE 173
EUROPE: ROAD SAFETY MARKET, BY PROFESSIONAL SERVICE, 2020–2024 (USD MILLION)
TABLE 174
EUROPE: ROAD SAFETY MARKET, BY PROFESSIONAL SERVICE, 2025–2030 (USD MILLION)
TABLE 175
EUROPE: ROAD SAFETY MARKET, BY MANAGED SERVICE, 2020–2024 (USD MILLION)
TABLE 176
EUROPE: ROAD SAFETY MARKET, BY MANAGED SERVICE, 2025–2030 (USD MILLION)
TABLE 177
EUROPE: ROAD SAFETY MARKET, BY DEPLOYMENT MODEL, 2020–2024 (USD MILLION)
TABLE 178
EUROPE: ROAD SAFETY MARKET, BY DEPLOYMENT MODEL, 2025–2030 (USD MILLION)
TABLE 179
EUROPE: ROAD SAFETY MARKET, BY ENFORCEMENT TYPE, 2020–2024 (USD MILLION)
TABLE 180
EUROPE: ROAD SAFETY MARKET, BY ENFORCEMENT TYPE, 2025–2030 (USD MILLION)
TABLE 181
EUROPE: ROAD SAFETY MARKET, BY DATA TYPE, 2020–2024 (USD MILLION)
TABLE 182
EUROPE: ROAD SAFETY MARKET, BY DATA TYPE, 2025–2030 (USD MILLION)
TABLE 183
EUROPE: ROAD SAFETY MARKET, BY APPLICATION, 2020–2024 (USD MILLION)
TABLE 184
EUROPE: ROAD SAFETY MARKET, BY APPLICATION, 2025–2030 (USD MILLION)
TABLE 185
EUROPE: ROAD SAFETY MARKET, BY END USER, 2020–2024 (USD MILLION)
TABLE 186
EUROPE: ROAD SAFETY MARKET, BY END USER, 2025–2030 (USD MILLION)
TABLE 187
EUROPE: ROAD SAFETY MARKET, BY COUNTRY, 2020–2024 (USD MILLION)
TABLE 188
EUROPE: ROAD SAFETY MARKET, BY COUNTRY, 2025–2030 (USD MILLION)
TABLE 189
UK: ROAD SAFETY MARKET, BY OFFERING, 2020–2024 (USD MILLION)
TABLE 190
UK: ROAD SAFETY MARKET, BY OFFERING, 2025–2030 (USD MILLION)
TABLE 191
GERMANY: ROAD SAFETY MARKET, BY OFFERING, 2020–2024 (USD MILLION)
TABLE 192
GERMANY: ROAD SAFETY MARKET, BY OFFERING, 2025–2030 (USD MILLION)
TABLE 193
FRANCE: ROAD SAFETY MARKET, BY OFFERING, 2020–2024 (USD MILLION)
TABLE 194
FRANCE: ROAD SAFETY MARKET, BY OFFERING, 2025–2030 (USD MILLION)
TABLE 195
ITALY: ROAD SAFETY MARKET, BY OFFERING, 2020–2024 (USD MILLION)
TABLE 196
ITALY: ROAD SAFETY MARKET, BY OFFERING, 2025–2030 (USD MILLION)
TABLE 197
SPAIN: ROAD SAFETY MARKET, BY OFFERING, 2020–2024 (USD MILLION)
TABLE 198
SPAIN: ROAD SAFETY MARKET, BY OFFERING, 2025–2030 (USD MILLION)
TABLE 199
REST OF EUROPE: ROAD SAFETY MARKET, BY OFFERING, 2020–2024 (USD MILLION)
TABLE 200
REST OF EUROPE: ROAD SAFETY MARKET, BY OFFERING, 2025–2030 (USD MILLION)
TABLE 201
ASIA PACIFIC: ROAD SAFETY MARKET, BY OFFERING, 2020–2024 (USD MILLION)
TABLE 202
ASIA PACIFIC: ROAD SAFETY MARKET, BY OFFERING, 2025–2030 (USD MILLION)
TABLE 203
ASIA PACIFIC: ROAD SAFETY MARKET, BY SOLUTION, 2020–2024 (USD MILLION)
TABLE 204
ASIA PACIFIC: ROAD SAFETY MARKET, BY SOLUTION, 2025–2030 (USD MILLION)
TABLE 205
ASIA PACIFIC: ROAD SAFETY MARKET, BY SOLUTION TYPE, 2020–2024 (USD MILLION)
TABLE 206
ASIA PACIFIC: ROAD SAFETY MARKET, BY SOLUTION TYPE, 2025–2030 (USD MILLION)
TABLE 207
ASIA PACIFIC: ROAD SAFETY MARKET, BY COMPONENT, 2020–2024 (USD MILLION)
TABLE 208
ASIA PACIFIC: ROAD SAFETY MARKET, BY COMPONENT, 2025–2030 (USD MILLION)
TABLE 209
ASIA PACIFIC: ROAD SAFETY MARKET, BY SERVICE, 2020–2024 (USD MILLION)
TABLE 210
ASIA PACIFIC: ROAD SAFETY MARKET, BY SERVICE, 2025–2030 (USD MILLION)
TABLE 211
ASIA PACIFIC: ROAD SAFETY MARKET, BY PROFESSIONAL SERVICE, 2020–2024 (USD MILLION)
TABLE 212
ASIA PACIFIC: ROAD SAFETY MARKET, BY PROFESSIONAL SERVICE, 2025–2030 (USD MILLION)
TABLE 213
ASIA PACIFIC: ROAD SAFETY MARKET, BY MANAGED SERVICE, 2020–2024 (USD MILLION)
TABLE 214
ASIA PACIFIC: ROAD SAFETY MARKET, BY MANAGED SERVICE, 2025–2030 (USD MILLION)
TABLE 215
ASIA PACIFIC: ROAD SAFETY MARKET, BY DEPLOYMENT MODEL, 2020–2024 (USD MILLION)
TABLE 216
ASIA PACIFIC: ROAD SAFETY MARKET, BY DEPLOYMENT MODEL, 2025–2030 (USD MILLION)
TABLE 217
ASIA PACIFIC: ROAD SAFETY MARKET, BY ENFORCEMENT TYPE, 2020–2024 (USD MILLION)
TABLE 218
ASIA PACIFIC: ROAD SAFETY MARKET, BY ENFORCEMENT TYPE, 2025–2030 (USD MILLION)
TABLE 219
ASIA PACIFIC: ROAD SAFETY MARKET, BY DATA TYPE, 2020–2024 (USD MILLION)
TABLE 220
ASIA PACIFIC: ROAD SAFETY MARKET, BY DATA TYPE, 2025–2030 (USD MILLION)
TABLE 221
ASIA PACIFIC: ROAD SAFETY MARKET, BY APPLICATION, 2020–2024 (USD MILLION)
TABLE 222
ASIA PACIFIC: ROAD SAFETY MARKET, BY APPLICATION, 2025–2030 (USD MILLION)
TABLE 223
ASIA PACIFIC: ROAD SAFETY MARKET, BY END USER, 2020–2024 (USD MILLION)
TABLE 224
ASIA PACIFIC: ROAD SAFETY MARKET, BY END USER, 2025–2030 (USD MILLION)
TABLE 225
ASIA PACIFIC: ROAD SAFETY MARKET, BY COUNTRY, 2020–2024 (USD MILLION)
TABLE 226
ASIA PACIFIC: ROAD SAFETY MARKET, BY COUNTRY, 2025–2030 (USD MILLION)
TABLE 227
CHINA: ROAD SAFETY MARKET, BY OFFERING, 2020–2024 (USD MILLION)
TABLE 228
CHINA: ROAD SAFETY MARKET, BY OFFERING, 2025–2030 (USD MILLION)
TABLE 229
JAPAN: ROAD SAFETY MARKET, BY OFFERING, 2020–2024 (USD MILLION)
TABLE 230
JAPAN: ROAD SAFETY MARKET, BY OFFERING, 2025–2030 (USD MILLION)
TABLE 231
INDIA: ROAD SAFETY MARKET, BY OFFERING, 2020–2024 (USD MILLION)
TABLE 232
INDIA: ROAD SAFETY MARKET, BY OFFERING, 2025–2030 (USD MILLION)
TABLE 233
AUSTRALIA & NEW ZEALAND: ROAD SAFETY MARKET, BY OFFERING, 2020–2024 (USD MILLION)
TABLE 234
AUSTRALIA & NEW ZEALAND: ROAD SAFETY MARKET, BY OFFERING, 2025–2030 (USD MILLION)
TABLE 235
ASEAN: ROAD SAFETY MARKET, BY OFFERING, 2020–2024 (USD MILLION)
TABLE 236
ASEAN: ROAD SAFETY MARKET, BY OFFERING, 2025–2030 (USD MILLION)
TABLE 237
SOUTH KOREA: ROAD SAFETY MARKET, BY OFFERING, 2020–2024 (USD MILLION)
TABLE 238
SOUTH KOREA: ROAD SAFETY MARKET, BY OFFERING, 2025–2030 (USD MILLION)
TABLE 239
REST OF ASIA PACIFIC: ROAD SAFETY MARKET, BY OFFERING, 2020–2024 (USD MILLION)
TABLE 240
REST OF ASIA PACIFIC: ROAD SAFETY MARKET, BY OFFERING, 2025–2030 (USD MILLION)
TABLE 241
MIDDLE EAST & AFRICA: ROAD SAFETY MARKET, BY OFFERING, 2020–2024 (USD MILLION)
TABLE 242
MIDDLE EAST & AFRICA: ROAD SAFETY MARKET, BY OFFERING, 2025–2030 (USD MILLION)
TABLE 243
MIDDLE EAST & AFRICA: ROAD SAFETY MARKET, BY SOLUTION, 2020–2024 (USD MILLION)
TABLE 244
MIDDLE EAST & AFRICA: ROAD SAFETY MARKET, BY SOLUTION, 2025–2030 (USD MILLION)
TABLE 245
MIDDLE EAST & AFRICA: ROAD SAFETY MARKET, BY SOLUTION TYPE, 2020–2024 (USD MILLION)
TABLE 246
MIDDLE EAST & AFRICA: ROAD SAFETY MARKET, BY SOLUTION TYPE, 2025–2030 (USD MILLION)
TABLE 247
MIDDLE EAST & AFRICA: ROAD SAFETY MARKET, BY COMPONENT, 2020–2024 (USD MILLION)
TABLE 248
MIDDLE EAST & AFRICA: ROAD SAFETY MARKET, BY COMPONENT, 2025–2030 (USD MILLION)
TABLE 249
MIDDLE EAST & AFRICA: ROAD SAFETY MARKET, BY SERVICE, 2020–2024 (USD MILLION)
TABLE 250
MIDDLE EAST & AFRICA: ROAD SAFETY MARKET, BY SERVICE, 2025–2030 (USD MILLION)
TABLE 251
MIDDLE EAST & AFRICA: ROAD SAFETY MARKET, BY PROFESSIONAL SERVICE, 2020–2024 (USD MILLION)
TABLE 252
MIDDLE EAST & AFRICA: ROAD SAFETY MARKET, BY PROFESSIONAL SERVICE, 2025–2030 (USD MILLION)
TABLE 253
MIDDLE EAST & AFRICA: ROAD SAFETY MARKET, BY MANAGED SERVICE, 2020–2024 (USD MILLION)
TABLE 254
MIDDLE EAST & AFRICA: ROAD SAFETY MARKET, BY MANAGED SERVICE, 2025–2030 (USD MILLION)
TABLE 255
MIDDLE EAST & AFRICA: ROAD SAFETY MARKET, BY DEPLOYMENT MODEL, 2020–2024 (USD MILLION)
TABLE 256
MIDDLE EAST & AFRICA: ROAD SAFETY MARKET, BY DEPLOYMENT MODEL, 2025–2030 (USD MILLION)
TABLE 257
MIDDLE EAST & AFRICA: ROAD SAFETY MARKET, BY ENFORCEMENT TYPE, 2020–2024 (USD MILLION)
TABLE 258
MIDDLE EAST & AFRICA: ROAD SAFETY MARKET, BY ENFORCEMENT TYPE, 2025–2030 (USD MILLION)
TABLE 259
MIDDLE EAST & AFRICA: ROAD SAFETY MARKET, BY DATA TYPE, 2020–2024 (USD MILLION)
TABLE 260
MIDDLE EAST & AFRICA: ROAD SAFETY MARKET, BY DATA TYPE, 2025–2030 (USD MILLION)
TABLE 261
MIDDLE EAST & AFRICA: ROAD SAFETY MARKET, BY APPLICATION, 2020–2024 (USD MILLION)
TABLE 262
MIDDLE EAST & AFRICA: ROAD SAFETY MARKET, BY APPLICATION, 2025–2030 (USD MILLION)
TABLE 263
MIDDLE EAST & AFRICA: ROAD SAFETY MARKET, BY END USER, 2020–2024 (USD MILLION)
TABLE 264
MIDDLE EAST & AFRICA: ROAD SAFETY MARKET, BY END USER, 2025–2030 (USD MILLION)
TABLE 265
MIDDLE EAST & AFRICA: ROAD SAFETY MARKET, BY COUNTRY, 2020–2024 (USD MILLION)
TABLE 266
MIDDLE EAST & AFRICA: ROAD SAFETY MARKET, BY COUNTRY, 2025–2030 (USD MILLION)
TABLE 267
SAUDI ARABIA: ROAD SAFETY MARKET, BY OFFERING, 2020–2024 (USD MILLION)
TABLE 268
SAUDI ARABIA: ROAD SAFETY MARKET, BY OFFERING, 2025–2030 (USD MILLION)
TABLE 269
UAE: ROAD SAFETY MARKET, BY OFFERING, 2020–2024 (USD MILLION)
TABLE 270
UAE: ROAD SAFETY MARKET, BY OFFERING, 2025–2030 (USD MILLION)
TABLE 271
SOUTH AFRICA: ROAD SAFETY MARKET, BY OFFERING, 2020–2024 (USD MILLION)
TABLE 272
SOUTH AFRICA: ROAD SAFETY MARKET, BY OFFERING, 2025–2030 (USD MILLION)
TABLE 273
QATAR: ROAD SAFETY MARKET, BY OFFERING, 2020–2024 (USD MILLION)
TABLE 274
QATAR: ROAD SAFETY MARKET, BY OFFERING, 2025–2030 (USD MILLION)
TABLE 275
REST OF MIDDLE EAST & AFRICA: ROAD SAFETY MARKET, BY OFFERING, 2020–2024 (USD MILLION)
TABLE 276
REST OF MIDDLE EAST & AFRICA: ROAD SAFETY MARKET, BY OFFERING, 2025–2030 (USD MILLION)
TABLE 277
LATIN AMERICA: ROAD SAFETY MARKET, BY OFFERING, 2020–2024 (USD MILLION)
TABLE 278
LATIN AMERICA: ROAD SAFETY MARKET, BY OFFERING, 2025–2030 (USD MILLION)
TABLE 279
LATIN AMERICA: ROAD SAFETY MARKET, BY SOLUTION, 2020–2024 (USD MILLION)
TABLE 280
LATIN AMERICA: ROAD SAFETY MARKET, BY SOLUTION, 2025–2030 (USD MILLION)
TABLE 281
LATIN AMERICA: ROAD SAFETY MARKET, BY SOLUTION TYPE, 2020–2024 (USD MILLION)
TABLE 282
LATIN AMERICA: ROAD SAFETY MARKET, BY SOLUTION TYPE, 2025–2030 (USD MILLION)
TABLE 283
LATIN AMERICA: ROAD SAFETY MARKET, BY COMPONENT, 2020–2024 (USD MILLION)
TABLE 284
LATIN AMERICA: ROAD SAFETY MARKET, BY COMPONENT, 2025–2030 (USD MILLION)
TABLE 285
LATIN AMERICA: ROAD SAFETY MARKET, BY SERVICE, 2020–2024 (USD MILLION)
TABLE 286
LATIN AMERICA: ROAD SAFETY MARKET, BY SERVICE, 2025–2030 (USD MILLION)
TABLE 287
LATIN AMERICA: ROAD SAFETY MARKET, BY PROFESSIONAL SERVICE, 2020–2024 (USD MILLION)
TABLE 288
LATIN AMERICA: ROAD SAFETY MARKET, BY PROFESSIONAL SERVICE, 2025–2030 (USD MILLION)
TABLE 289
LATIN AMERICA: ROAD SAFETY MARKET, BY MANAGED SERVICE, 2020–2024 (USD MILLION)
TABLE 290
LATIN AMERICA: ROAD SAFETY MARKET, BY MANAGED SERVICE, 2025–2030 (USD MILLION)
TABLE 291
LATIN AMERICA: ROAD SAFETY MARKET, BY DEPLOYMENT MODEL, 2020–2024 (USD MILLION)
TABLE 292
LATIN AMERICA: ROAD SAFETY MARKET, BY DEPLOYMENT MODEL, 2025–2030 (USD MILLION)
TABLE 293
LATIN AMERICA: ROAD SAFETY MARKET, BY ENFORCEMENT TYPE,2020–2024 (USD MILLION)
TABLE 294
LATIN AMERICA: ROAD SAFETY MARKET, BY ENFORCEMENT TYPE, 2025–2030 (USD MILLION)
TABLE 295
LATIN AMERICA: ROAD SAFETY MARKET, BY DATA TYPE, 2020–2024 (USD MILLION)
TABLE 296
LATIN AMERICA: ROAD SAFETY MARKET, BY DATA TYPE, 2025–2030 (USD MILLION)
TABLE 297
LATIN AMERICA: ROAD SAFETY MARKET, BY APPLICATION, 2020–2024 (USD MILLION)
TABLE 298
LATIN AMERICA: ROAD SAFETY MARKET, BY APPLICATION, 2025–2030 (USD MILLION)
TABLE 299
LATIN AMERICA: ROAD SAFETY MARKET, BY END USER, 2020–2024 (USD MILLION)
TABLE 300
LATIN AMERICA: ROAD SAFETY MARKET, BY END USER, 2025–2030 (USD MILLION)
TABLE 301
LATIN AMERICA: ROAD SAFETY MARKET, BY COUNTRY, 2020–2024 (USD MILLION)
TABLE 302
LATIN AMERICA: ROAD SAFETY MARKET, BY COUNTRY, 2025–2030 (USD MILLION)
TABLE 303
BRAZIL: ROAD SAFETY MARKET, BY OFFERING, 2020–2024 (USD MILLION)
TABLE 304
BRAZIL: ROAD SAFETY MARKET, BY OFFERING, 2025–2030 (USD MILLION)
TABLE 305
MEXICO: ROAD SAFETY MARKET, BY OFFERING, 2020–2024 (USD MILLION)
TABLE 306
MEXICO: ROAD SAFETY MARKET, BY OFFERING, 2025–2030 (USD MILLION)
TABLE 307
ARGENTINA: ROAD SAFETY MARKET, BY OFFERING, 2020–2024 (USD MILLION)
TABLE 308
ARGENTINA: ROAD SAFETY MARKET, BY OFFERING, 2025–2030 (USD MILLION)
TABLE 309
REST OF LATIN AMERICA: ROAD SAFETY MARKET, BY OFFERING, 2020–2024 (USD MILLION)
TABLE 310
REST OF LATIN AMERICA: ROAD SAFETY MARKET, BY OFFERING, 2025–2030 (USD MILLION)
TABLE 311
OVERVIEW OF STRATEGIES ADOPTED BY KEY ROAD SAFETY VENDORS, 2022–2025
TABLE 312
ROAD SAFETY MARKET: DEGREE OF COMPETITION
TABLE 313
REGIONAL FOOTPRINT (13 COMPANIES), 2024
TABLE 314
OFFERING FOOTPRINT (13 COMPANIES), 2024
TABLE 315
APPLICATION FOOTPRINT (13 COMPANIES), 2024
TABLE 316
END USER FOOTPRINT (13 COMPANIES), 2024
TABLE 317
ROAD SAFETY MARKET: KEY STARTUPS/SMES, 2024
TABLE 318
ROAD SAFETY MARKET: COMPETITIVE BENCHMARKING OF KEY STARTUPS/SMES (HARDWARE)
TABLE 319
ROAD SAFETY MARKET: COMPETITIVE BENCHMARKING OF KEY STARTUPS/SMES (SOFTWARE)
TABLE 320
ROAD SAFETY MARKET: PRODUCT LAUNCHES AND ENHANCEMENTS, 2022–2025
TABLE 321
ROAD SAFETY MARKET: DEALS, 2022–2025
TABLE 322
JENOPTIK: COMPANY OVERVIEW
TABLE 323
JENOPTIK: PRODUCTS/SOLUTIONS/SERVICES OFFERED
TABLE 324
JENOPTIK: PRODUCT LAUNCHES AND ENHANCEMENTS
TABLE 325
KAPSCH TRAFFICCOM: COMPANY OVERVIEW
TABLE 326
KAPSCH TRAFFICCOM: PRODUCTS/SOLUTIONS/SERVICES OFFERED
TABLE 327
KAPSCH TRAFFICCOM: PRODUCT LAUNCHES AND ENHANCEMENTS
TABLE 328
KAPSCH TRAFFICCOM: DEALS
TABLE 329
SENSYS GATSO GROUP: COMPANY OVERVIEW
TABLE 330
SENSYS GATSO GROUP: PRODUCTS/SOLUTIONS/SERVICES OFFERED
TABLE 331
SENSYS GATSO: PRODUCT LAUNCHES AND ENHANCEMENTS
TABLE 332
SENSYS GATSO GROUP: DEALS
TABLE 333
VERRA MOBILITY: COMPANY OVERVIEW
TABLE 334
VERRA MOBILITY: PRODUCTS/SOLUTIONS/SERVICES OFFERED
TABLE 335
VERRA MOBILITY: PRODUCT LAUNCHES AND ENHANCEMENTS
TABLE 336
VERRA MOBILITY: DEALS
TABLE 337
TELEDYNE FLIR: COMPANY OVERVIEW
TABLE 338
TELEDYNE FLIR: PRODUCTS/SOLUTIONS/SERVICES OFFERED
TABLE 339
TELEDYNE FLIR: PRODUCT LAUNCH AND ENHANCEMENTS
TABLE 340
TELEDYNE FLIR: DEALS
TABLE 341
MOTOROLA SOLUTIONS: COMPANY OVERVIEW
TABLE 342
MOTOROLA SOLUTIONS: PRODUCTS/SOLUTIONS/SERVICES OFFERED
TABLE 343
MOTOROLA SOLUTIONS: PRODUCT LAUNCHES AND ENHANCEMENTS
TABLE 344
MOTOROLA SOLUTIONS: DEALS
TABLE 345
IDEMIA: COMPANY OVERVIEW
TABLE 346
IDEMIA: PRODUCTS/SOLUTIONS/SERVICES OFFERED
TABLE 347
IDEMIA: PRODUCT LAUNCHES AND ENHANCEMENTS
TABLE 349
SWARCO: COMPANY OVERVIEW
TABLE 350
SWARCO: PRODUCTS/SOLUTIONS/SERVICES OFFERED
TABLE 351
SWARCO: PRODUCT LAUNCHES AND ENHANCEMENTS
TABLE 353
VITRONIC: COMPANY OVERVIEW
TABLE 354
VITRONIC: PRODUCTS/SOLUTIONS/SERVICES OFFERED
TABLE 355
VITRONIC: PRODUCT LAUNCHES AND ENHANCEMENTS
TABLE 356
SIEMENS: COMPANY OVERVIEW
TABLE 357
SIEMENS: PRODUCTS/SOLUTIONS/SERVICES OFFERED
TABLE 359
CONDUENT: COMPANY OVERVIEW
TABLE 360
CONDUENT: PRODUCTS/SOLUTIONS/SERVICES OFFERED
TABLE 361
CONDUENT: PRODUCT LAUNCHES AND ENHANCEMENTS
TABLE 362
CONDUENT: DEALS
TABLE 363
CUBIC CORPORATION: COMPANY OVERVIEW
TABLE 364
CUBIC CORPORATION: PRODUCTS/SOLUTIONS/SERVICES OFFERED
TABLE 365
CUBIC: PRODUCT LAUNCHES AND ENHANCEMENTS
TABLE 366
CUBIC CORPORATION: DEALS
TABLE 367
TRAFFIC MANAGEMENT MARKET, BY OFFERING, 2019–2023 (USD MILLION)
TABLE 368
TRAFFIC MANAGEMENT MARKET, BY OFFERING, 2024–2029 (USD MILLION)
TABLE 369
TRAFFIC MANAGEMENT MARKET, BY AREA OF APPLICATION, 2019–2023 (USD MILLION)
TABLE 370
TRAFFIC MANAGEMENT MARKET, BY AREA OF APPLICATION, 2024–2029 (USD MILLION)
TABLE 371
TRAFFIC MANAGEMENT MARKET, BY END USER, 2019–2023 (USD MILLION)
TABLE 372
TRAFFIC MANAGEMENT MARKET, BY END USER, 2024–2029 (USD MILLION)
TABLE 373
TRAFFIC MANAGEMENT MARKET, BY REGION, 2019–2023 (USD MILLION)
TABLE 374
TRAFFIC MANAGEMENT MARKET, BY REGION, 2024–2029 (USD MILLION)
TABLE 375
SMART TRANSPORTATION MARKET, BY TRANSPORTATION MODE, 2018–2022 (USD MILLION)
TABLE 376
SMART TRANSPORTATION MARKET, BY TRANSPORTATION MODE,2023–2028 (USD MILLION)
TABLE 377
ROADWAY: SMART TRANSPORTATION MARKET, BY TYPE, 2018–2022 (USD MILLION)
TABLE 378
ROADWAY: SMART TRANSPORTATION MARKET, BY TYPE, 2023–2028 (USD MILLION)
TABLE 379
RAILWAY: SMART TRANSPORTATION MARKET, BY TYPE, 2018–2022 (USD MILLION)
TABLE 380
RAILWAY: SMART TRANSPORTATION MARKET, BY TYPE, 2023–2028 (USD MILLION)
TABLE 381
AIRWAY: SMART TRANSPORTATION MARKET, BY TYPE, 2018–2022 (USD MILLION)
TABLE 382
AIRWAY: SMART TRANSPORTATION MARKET, BY TYPE, 2023–2028 (USD MILLION)
TABLE 383
MARITIME: SMART TRANSPORTATION MARKET, BY TYPE, 2018–2022 (USD MILLION)
TABLE 384
MARITIME: SMART TRANSPORTATION MARKET, BY TYPE, 2023–2028 (USD MILLION)
TABLE 385
SMART TRANSPORTATION MARKET, BY REGION, 2018–2022 (USD MILLION)
TABLE 386
SMART TRANSPORTATION MARKET, BY REGION, 2023–2028 (USD MILLION)
FIGURE 1
ROAD SAFETY MARKET: RESEARCH DESIGN
FIGURE 2
ROAD SAFETY MARKET: DATA TRIANGULATION
FIGURE 3
ROAD SAFETY MARKET: TOP-DOWN AND BOTTOM-UP APPROACHES
FIGURE 4
MARKET SIZE ESTIMATION METHODOLOGY — APPROACH 1, BOTTOM-UP (SUPPLY-SIDE): REVENUE FROM SOLUTIONS AND SERVICES IN ROAD SAFETY MARKET
FIGURE 5
MARKET SIZE ESTIMATION METHODOLOGY — APPROACH 2, BOTTOM-UP (SUPPLY-SIDE): COLLECTIVE REVENUE FROM KEY COMPANIES IN ROAD SAFETY MARKET
FIGURE 6
MARKET SIZE ESTIMATION METHODOLOGY — APPROACH 3, BOTTOM-UP (SUPPLY-SIDE): COLLECTIVE REVENUE FROM BUSINESS UNITS (BUS) OF KEY VENDORS IN ROAD SAFETY MARKET
FIGURE 7
MARKET SIZE ESTIMATION METHODOLOGY — APPROACH 4, BOTTOM-UP (DEMAND-SIDE): SHARE OF ROAD SAFETY THROUGH OVERALL IT SPENDING ON ROAD SAFETY SOLUTIONS
FIGURE 8
AUTOMATED ENFORCEMENT SEGMENT TO HOLD LARGEST MARKET SIZE IN 2025
FIGURE 9
VIDEO & IMAGE SEGMENT TO HOLD LARGEST MARKET SHARE IN 2025
FIGURE 10
SOLUTIONS SEGMENT TO HOLD LARGEST MARKET SHARE IN 2025
FIGURE 11
SMART CITY INTEGRATORS TO WITNESS HIGHEST GROWTH RATE IN END USER SEGMENT DURING FORECAST PERIOD
FIGURE 12
ASIA PACIFIC TO REGISTER FASTEST GROWTH BETWEEN 2025 AND 2030
FIGURE 13
ACCELERATING DIGITAL INFRASTRUCTURE AND ROAD SAFETY MANDATE ACROSS ASIA PACIFIC TO DRIVE ROAD SAFETY MARKET GROWTH
FIGURE 14
DRIVER BEHAVIOR MONITORING SEGMENT TO ACCOUNT FOR HIGHEST GROWTH RATE DURING FORECAST PERIOD
FIGURE 15
VIDEO & IMAGE AND AUTOMATED ENFORCEMENT TO BE LARGEST SHAREHOLDERS IN NORTH AMERICAN ROAD SAFETY MARKET IN 2025
FIGURE 16
NORTH AMERICA TO HOLD LARGEST MARKET SHARE IN 2025
FIGURE 17
DRIVERS, RESTRAINTS, OPPORTUNITIES, AND CHALLENGES: ROAD SAFETY MARKET
FIGURE 18
ROAD SAFETY MARKET EVOLUTION
FIGURE 19
ROAD SAFETY MARKET: SUPPLY CHAIN ANALYSIS
FIGURE 20
MARKET POTENTIAL OF GENERATIVE AI IN ENHANCING ROAD SAFETY
FIGURE 21
KEY PLAYERS IN ROAD SAFETY MARKET ECOSYSTEM
FIGURE 22
ROAD SAFETY MARKET: INVESTMENT LANDSCAPE AND FUNDING SCENARIO
FIGURE 23
ELECTRICAL SIGNALING AND TRAFFIC CONTROL EQUIPMENT EXPORT, BY KEY COUNTRY, 2020–2024 (USD MILLION)
FIGURE 24
ELECTRICAL SIGNALING AND TRAFFIC CONTROL EQUIPMENT IMPORT, BY KEY COUNTRY, 2020–2024 (USD MILLION)
FIGURE 25
NUMBER OF PATENTS GRANTED IN LAST 10 YEARS, 2016–2025
FIGURE 26
REGIONAL ANALYSIS OF PATENTS GRANTED, 2016–2025
FIGURE 27
ROAD SAFETY MARKET: PORTER’S FIVE FORCES ANALYSIS
FIGURE 28
TRENDS IMPACTING CUSTOMERS: ROAD SAFETY MARKET
FIGURE 29
INFLUENCE OF STAKEHOLDERS ON BUYING PROCESS FOR TOP THREE APPLICATIONS
FIGURE 30
KEY BUYING CRITERIA FOR TOP THREE APPLICATIONS
FIGURE 31
SERVICES SEGMENT TO GROW AT HIGHER CAGR DURING FORECAST PERIOD
FIGURE 32
COMPONENT TO GROW AT HIGHER CAGR DURING FORECAST PERIOD
FIGURE 33
INCIDENT DETECTION & RESPONSE SEGMENT TO GROW AT HIGHEST CAGR DURING FORECAST PERIOD
FIGURE 34
SOFTWARE SEGMENT TO GROW AT HIGHEST CAGR DURING FORECAST PERIOD
FIGURE 35
MANAGED SERVICES SEGMENT TO GROW AT HIGHER CAGR DURING FORECAST PERIOD
FIGURE 36
TRAINING SEGMENT TO GROW AT HIGHEST CAGR DURING FORECAST PERIOD
FIGURE 37
ANALYTICS-AS-A-SERVICE TO GROW AT HIGHEST CAGR DURING FORECAST PERIOD
FIGURE 38
CLOUD-BASED PLATFORMS SEGMENT TO GROW AT HIGHEST CAGR DURING FORECAST PERIOD
FIGURE 39
AUTOMATED ENFORCEMENT TO GROW AT HIGHEST CAGR DURING FORECAST PERIOD
FIGURE 40
INTEGRATED BIG DATA TO GROW AT HIGHEST CAGR DURING FORECAST PERIOD
FIGURE 41
DRIVER BEHAVIOR MONITORING TO GROW AT HIGHEST CAGR DURING FORECAST PERIOD
FIGURE 42
SMART CITY INTEGRATORS TO GROW AT HIGHEST CAGR DURING FORECAST PERIOD
FIGURE 43
NORTH AMERICA TO BE LARGEST REGIONAL MARKET DURING FORECAST PERIOD
FIGURE 44
INDIA TO WITNESS FASTEST GROWTH DURING FORECAST PERIOD
FIGURE 45
NORTH AMERICA: MARKET SNAPSHOT
FIGURE 46
ASIA PACIFIC: MARKET SNAPSHOT
FIGURE 47
TOP FIVE PUBLIC PLAYERS IN ROAD SAFETY MARKET, 2020–2024 (USD MILLION)
FIGURE 48
SHARE OF LEADING COMPANIES IN ROAD SAFETY MARKET, 2024
FIGURE 49
PRODUCT COMPARATIVE ANALYSIS (HARDWARE) (ROAD SAFETY)
FIGURE 50
PRODUCT COMPARATIVE ANALYSIS (SOFTWARE) (ROAD SAFETY)
FIGURE 51
FINANCIAL METRICS OF KEY VENDORS
FIGURE 52
YEAR-TO-DATE (YTD) PRICE TOTAL RETURN AND 5-YEAR STOCK BETA OF KEY VENDORS
FIGURE 53
ROAD SAFETY MARKET: COMPANY EVALUATION MATRIX (KEY PLAYERS), 2024
FIGURE 54
COMPANY FOOTPRINT (13 COMPANIES), 2024
FIGURE 55
ROAD SAFETY MARKET: COMPANY EVALUATION MATRIX HARDWARE (STARTUPS/SMES), 2024
FIGURE 56
ROAD SAFETY MARKET: COMPANY EVALUATION MATRIX SOFTWARE (STARTUPS/SMES), 2024
FIGURE 57
JENOPTIK: COMPANY SNAPSHOT
FIGURE 58
KAPSCH TRAFFICCOM: COMPANY SNAPSHOT
FIGURE 59
SENSYS GATSO GROUP: COMPANY SNAPSHOT
FIGURE 60
MOTOROLA SOLUTIONS: COMPANY SNAPSHOT
FIGURE 61
SIEMENS: COMPANY SNAPSHOT
FIGURE 62
CONDUENT: COMPANY SNAPSHOT


 Exclusive indicates content/data unique to MarketsandMarkets and not available with any competitors.


David
Sep, 2014
Interested in road safety market.
emrah
May, 2015
Interested in road safety market and related topics.
Maheswor
Jul, 2014
Interested in road safety market.
Jimmy
Jun, 2016
Interested in automation in ticket vending machine market.
Vincent
May, 2019
Collision avoidance (AEB - automatic emergency braking) market for heavy duty trucks and buses.
Daniel
May, 2019
Interested in road safety market.
Angelika
Apr, 2017
Understanding road safety market structure in Europe region.