Social and Emotional Learning Market

Social and Emotional Learning Market by Offering (Solution, Services), Solution (Social & Emotional Learning Platform, Social & Emotional Learning Assessment Tool), Service, End User, Core Competency, Type & Regions - Global Forecast to 2028

Report Code: TC 7519 Nov, 2023, by marketsandmarkets.com

The global social and emotional learning (SEL) market size reached US$ 3.6 Billion in 2023. Looking forward, It expects the market to reach US$ 10.3 Billion by 2028, exhibiting a growth rate (CAGR) of 23.6% during 2023-2028. There has been a significant rise in the demand for SEL in K-12 schools over the past few years. Policymakers worldwide are taking the initiative to promote SEL, and educators are eager to introduce it into their academic curriculum due to its numerous benefits. The Social and Emotional Learning market has enormous potential for growth in the future, as it is being implemented on a large scale in pre-K, elementary, middle, and high schools.

Social and Emotional Learning Market

To know about the assumptions considered for the study, Request for Free Sample Report

Social and Emotional Learning Market

To know about the assumptions considered for the study, download the pdf brochure

Social and Emotional Learning Market Dynamics

Driver:  Growing implementation of distance education solutions

The demand for social and emotional learning programs has increased due to the rise of distance education solutions. The social and emotional learning market has grown significantly with most courses being offered online. Previously, SEL courses were taught in classrooms with the help of teachers. However, due to the availability of online courses, parents are now also involved in their children’s learning at home, anytime and anywhere.

Restraint: Absence of appropriate infrastructure in emerging economies

Most developing and underdeveloped countries need more infrastructure, which is a significant hurdle in the growth of their education system. The minimum educational infrastructure required includes sufficient space, clean drinking water, access to power, roads, the internet, and proper sanitation facilities. Unfortunately, these countries still rely on outdated telecom infrastructure, which cannot offer fast and reliable connectivity. This lack of high-speed internet makes implementing web-based Social and Emotional Learning platforms that require a stable, high-speed internet connection easier. Additionally, these countries have limited funding for academic curriculums. The government cannot allocate enough resources to introduce new student programs because of poor economic conditions. Consequently, most emerging economies need more support when implementing SEL platforms.

Opportunity: Demand for new learning models with advancements in technologies

The K-12 education system has evolved from traditional classrooms to smart classrooms, incorporating innovative technologies such as cloud computing, analytics, advanced collaboration tools, and the Internet of Things (IoT). With interactive whiteboards and displays, even students in remote areas can be engaged in modern classrooms. Educators can efficiently deliver Social and Emotional Learning (SEL) curricula to multiple students from a central location using collaboration tools like WebEx, Zoom, Google Hangouts, and Skype. Cloud computing is widely used in K-12 schools, and SEL providers use it to deliver curricula. Integrating technologies such as videoconferencing, cloud computing, and analytics into the classroom to develop practical SEL skills is crucial. These collaboration tools highlight the importance of working closely with students. For example, the Fresno Unified School District implemented a digital collaboration platform to enhance social and emotional skills, resulting in a 25% improvement in the academic performance of middle school students.

Challenge: The challenge in transitioning away from traditional learning methods

Teachers worldwide face significant challenges transitioning from traditional education methods to innovative approaches. Chief among these obstacles are constraints related to time and curriculum diversity. Research conducted by the US government indicates that 81% of teachers consider time limitations as the primary hurdle in implementing these new methods. The demands of existing curricula and the necessity to cover core academic subjects often leave limited room for incorporating innovative teaching approaches. Additionally, ensuring curriculum diversity and inclusivity poses another significant challenge. Creating teaching materials that cater to the diverse needs of students from various backgrounds, encompassing differences in religion, caste, economic status, and language, can be complex.

Social and Emotional Learning (SEL) Market Ecosystem

Prominent social emotional learning companies in this market include a well-established, financially stable provider of the Social and Emotional Learning (SEL) market. These companies have innovated their offerings and possess a diversified product portfolio, state-of-the-art technologies, and marketing networks. Prominent social emotional learning companies in this market Committee for Children (US), EVERFI (US), Illuminate Education (US), Nearpod (US), Panorama Education (US), SchoolMint (US), Newsela (US), Playworks (US), Wings of Kids (US), Rethink ED (US), etc.

Social and Emotional Learning Market

By service, the Training and Support segment is expected to grow with the highest CAGR during the forecast period

In-person instruction, remote technical support, and assistance with the Social and Emotional Learning platform are all part of the training and support offerings that aid educators in their SEL journeys. The training offerings include workshops and in-class instruction. Personal instruction conferences, webinars, seminars, and SEL-related self-improvement courses. It introduces recommended practices that promote secure and exciting learning environments for students. Teachers and administrative workers can give worthwhile results in SEL programs with the help of practical SEL training. The training model aids principals and teachers in learning about the SEL program, receiving feedback, and gauging its efficacy. Training and support service providers provide best practices for teaching SEL to students.

Based on region, Asia Pacific is expected to grow with the highest CAGR during the forecast period

Due to its rapid development, Asia Pacific is one of the most lucrative markets for SEL. Social and Emotional Learning solutions are being quickly adopted, making it the fastest-growing market globally. China and Japan, the region’s most technologically advanced nations, dominate the SEL market. The region has the largest student population, and with technological advancements, there is an increasing need for newer teaching methods. The Social and Emotional Learning (SEL) market is driven to adapt to Asia Pacific’s diverse educational needs, including ANZ, Japan, China, South Korea, Southeast Asia, and India. During the projection period, Asia Pacific is expected to have more growth opportunities. The government programs to boost digital infrastructure fuel the region’s adoption of SEL. Consumer IT spending in the Asia Pacific is already declining with the ongoing tight market conditions in the US and Europe. However, enterprise IT spending is expected to remain stable as organizations focus on IT security and digital transformation in the short run.

Social and Emotional Learning Market Size, and Share

Global Social Emotional Learning Companies:

The top Social Emotional Learning Companies in the market are Committee for Children (US), EVERFI (US), Illuminate Education (US), Nearpod (US), Panorama Education (US), SchoolMint (US), Newsela (US), Playworks (US), Wings of Kids (US), Rethink ED (US), etc. These players have adopted various growth strategies, such as partnerships, agreements and collaborations, new product launches, enhancements, and acquisitions to expand their footprint in the SEL market.

Get online access to the report on the World's First Market Intelligence Cloud

  • Easy to Download Historical Data & Forecast Numbers
  • Company Analysis Dashboard for high growth potential opportunities
  • Research Analyst Access for customization & queries
  • Competitor Analysis with Interactive dashboard
  • Latest News, Updates & Trend analysis
Request Sample

Scope of the Report

Report Metrics

Details

Market size available for years

2018-2028

Base year considered

2022

Forecast period

2023–2028

Forecast units

Value (USD) Million/Billion

Segments Covered

SEL Market by Offering (Solution, Services), Solution (Social and Emotional Learning Platform, Social and Emotional Learning Assessment Tool), Service (Consulting, Integration and Deployment, Training and Support), End User (Pre-K, Elementary Schools, Middle and High Schools, Therapists and Psychologists, and Other End Users), Core Competency (Self Awareness, Self Management, Social Awareness, Relationship Skills, Responsible Decision Making), Type (Web-based, Application)

Region covered

North America, Europe, Asia Pacific, Middle East & Africa, Latin America

Top Social Emotional Learning Companies - Worldwide

Committee for Children (US), EVERFI (US), Illuminate Education (US), Nearpod (US), Panorama Education (US), SchoolMint (US), Newsela (US), Playworks (US), Wings of Kids (US), Rethink ED (US), etc.

This research report categorizes the Social and Emotional Learning (SEL) Market based on offerings, solutions, services, end users, core competency, type, and regions.

Based on Offering:
  • Solutions
  • Services
Based on Solution:
  • Social and Emotional Learning Platform
  • Social and Emotional Learning Assessment Tool
Based on Service:
  • Consulting
  • Integration and Deployment
  • Training and Support
Based on End User:
  • Pre-K
  • Elementary Schools
  • Middle and High Schools
  • Therapists and Psychologists
  • Other End Users
Based on Core Competency:
  • Self Awareness
  • Self Management
  • Social Awareness
  • Relationship Skills
  • Responsible Decision-making
Based on Type:
  • Web-based
  • Application
Based on the Region:
  • North America
    • US
    • Canada
  • Europe
    • UK
    • Germany
    • France
    • Italy
    • Spain
    • Nordic countries
    • Rest of Europe
  • Asia Pacific
    • China
    • Japan
    • India
    • Australia and New Zealand (ANZ)
    • South Korea
    • Southeast Asia
    • Rest of Asia Pacific
  • Middle East & Africa
    • GCC Countries
      • UAE
      • KSA
      • Rest of GCC Countries
    • South Africa
    • Rest of Middle East and Africa
  • Latin America
    • Brazil
    • Mexico
    • Rest of Latin America

Recent Developments

  • In August 2023, EVERFI from Blackbaud collaborated with Truth Initiative to launch an updated prescription drug safety curriculum for middle and high school students amid the growing youth overdose crisis.
  • In June 2023, Panorama Education acquired Mesa Cloud, complementing its platform with graduation support technology and enhancing Panorama’s suite of offerings to improve learning and well-being.
  • In June 2023, Newsela acquired Formative to expand its real-time assessment delivery vastly. The acquisition will allow the company to weave Formative assessments and data analysis across its content, which covers social studies, English-language arts, science, and social-emotional learning.
  • In March 2023, Rethink Ed announced an expanded partnership with the country’s most extensive public school system, New York City Public Schools (NYCPS), to deliver innovative, evidence-based, specialized support to help students with autism thrive.
  • In January 2023, Wings for Kids partnered with the YMCA of Metro Atlanta to provide more than 3,750 children with educational support, social-emotional learning, real-world skills, and workforce development to close the opportunity gap.

Frequently Asked Questions (FAQ):

To speak to our analyst for a discussion on the above findings, click Speak to Analyst

TABLE OF CONTENTS
 
1 INTRODUCTION (Page No. - 41)
    1.1 STUDY OBJECTIVES 
    1.2 MARKET DEFINITION 
    1.3 STUDY SCOPE 
           1.3.1 MARKET SEGMENTATION
           1.3.2 REGIONS COVERED
           1.3.3 INCLUSIONS AND EXCLUSIONS
    1.4 YEARS CONSIDERED 
    1.5 CURRENCY CONSIDERED 
           TABLE 1 USD EXCHANGE RATES, 2020–2022
    1.6 STAKEHOLDERS 
    1.7 SUMMARY OF CHANGES 
           1.7.1 IMPACT OF RECESSION
 
2 RESEARCH METHODOLOGY (Page No. - 46)
    2.1 RESEARCH DATA 
           FIGURE 1 SOCIAL AND EMOTIONAL LEARNING MARKET: RESEARCH DESIGN
           2.1.1 SECONDARY DATA
                    2.1.1.1 Key data from secondary sources
           2.1.2 PRIMARY DATA
                    2.1.2.1 Primary interviews with experts
                    2.1.2.2 Breakup of primary profiles
                    2.1.2.3 List of key primary participants
                               TABLE 2 PRIMARY RESPONDENTS: MARKET
                    2.1.2.4 Key insights from industry experts
    2.2 MARKET BREAKUP AND DATA TRIANGULATION 
           FIGURE 2 DATA TRIANGULATION
    2.3 MARKET SIZE ESTIMATION 
           2.3.1 BOTTOM-UP APPROACH
                    FIGURE 3 BOTTOM-UP APPROACH
           2.3.2 TOP-DOWN APPROACH
                    FIGURE 4 TOP-DOWN APPROACH
    2.4 MARKET ESTIMATION: SUPPLY-SIDE ANALYSIS 
           FIGURE 5 SOCIAL AND EMOTIONAL LEARNING MARKET SIZE ESTIMATION: SUPPLY-SIDE ANALYSIS (1/2)
           FIGURE 6 MARKET SIZE ESTIMATION: SUPPLY-SIDE ANALYSIS (2/2)
           FIGURE 7 SOCIAL AND EMOTIONAL LEARNING MARKET SIZE ESTIMATION METHODOLOGY: APPROACH 3 – BOTTOM-UP (DEMAND SIDE)
    2.5 MARKET FORECAST 
           TABLE 3 FACTOR ANALYSIS
    2.6 RESEARCH ASSUMPTIONS 
           TABLE 4 RESEARCH ASSUMPTIONS
    2.7 LIMITATIONS AND RISK ASSESSMENT 
    2.8 IMPLICATION OF RECESSION ON MARKET 
 
3 EXECUTIVE SUMMARY (Page No. - 57)
    TABLE 5 SOCIAL AND EMOTIONAL LEARNING MARKET SIZE AND GROWTH RATE,  2018–2022 (USD MILLION, Y-O-Y GROWTH) 
    TABLE 6 MARKET SIZE AND GROWTH RATE,  2023–2028 (USD BILLION, Y-O-Y GROWTH) 
    FIGURE 8 SOLUTIONS SEGMENT TO ACCOUNT FOR LARGER MARKET IN 2023 
    FIGURE 9 SOCIAL AND EMOTIONAL LEARNING ASSESSMENT TOOLS SEGMENT TO  LEAD MARKET IN 2023 
    FIGURE 10 TRAINING AND SUPPORT SEGMENT TO HOLD LARGEST MARKET SHARE IN 2023 
    FIGURE 11 MIDDLE AND HIGH SCHOOLS SEGMENT TO ACCOUNT FOR LARGEST MARKET  IN 2023 
    FIGURE 12 NORTH AMERICA TO ACCOUNT FOR LARGEST MARKET SHARE IN 2023 
 
4 PREMIUM INSIGHTS (Page No. - 61)
    4.1 ATTRACTIVE OPPORTUNITIES FOR SOCIAL AND EMOTIONAL LEARNING MARKET PLAYERS 
           FIGURE 13 DEMAND FOR NEW LEARNING MODELS WITH ADVANCEMENT IN TECHNOLOGIES TO PRESENT GROWTH OPPORTUNITIES FOR MARKET
    4.2 MARKET, BY END USER 
           FIGURE 14 MIDDLE AND HIGH SCHOOLS SEGMENT TO ACCOUNT FOR LARGEST MARKET DURING FORECAST PERIOD
    4.3 MARKET, BY KEY OFFERING AND TYPE 
           FIGURE 15 SOLUTIONS AND WEB-BASED SEGMENTS TO ACCOUNT FOR LARGEST MARKET SHARES IN 2023
    4.4 MARKET, BY REGION 
           FIGURE 16 NORTH AMERICA TO ACCOUNT FOR LARGEST MARKET SHARE IN 2023
 
5 SOCIAL AND EMOTIONAL LEARNING MARKET OVERVIEW AND INDUSTRY TRENDS (Page No. - 63)
    5.1 INTRODUCTION 
    5.2 MARKET DYNAMICS 
           FIGURE 17 DRIVERS, RESTRAINTS, OPPORTUNITIES, AND CHALLENGES: SOCIAL AND EMOTIONAL LEARNING MARKET
           5.2.1 DRIVERS
                    5.2.1.1 Increasing focus on overall development of students
                    5.2.1.2 Growing implementation of distance education solutions
                    5.2.1.3 Need for social and emotional well-being in educational institutions
                               FIGURE 18 PERCENTAGE OF CHILDREN WHO CAN CORRECTLY IDENTIFY EMOTIONS, 2019
                    5.2.1.4 Growing support and awareness programs by governments
                               FIGURE 19 TOTAL ANNUAL SPENDING ON SOCIAL AND EMOTIONAL LEARNING SOLUTIONS IN US K-12 SCHOOLS, 2017 (USD MILLION)
                    5.2.1.5 Need for promoting social awareness among employees in organizations
                               FIGURE 20 SURVEY RESULTS BY ZETY
                               FIGURE 21 TOP 10 SOFT SKILLS ACCORDING TO RECRUITERS AND HIRING MANAGERS
                    5.2.1.6 Proliferation of computing in K-12 sector
           5.2.2 RESTRAINTS
                    5.2.2.1 Absence of appropriate infrastructure in emerging economies
                               FIGURE 22 STATE OF MOBILE INTERNET CONNECTIVITY, BY REGION, 2022
                    5.2.2.2 Lack of education budget in emerging countries
           5.2.3 OPPORTUNITIES
                    5.2.3.1 Demand for new learning models with advancements in technologies
                    5.2.3.2 Emergence of AI, AR, and VR learning trends in K-12 sector
           5.2.4 CHALLENGES
                    5.2.4.1 Shift from traditional learning methods
                    5.2.4.2 Focus on academic learning more than social and emotional learning
                               TABLE 7 FIVE CORE COMPETENCIES OF SOCIAL AND EMOTIONAL LEARNING
           5.2.5 SOCIAL AND EMOTIONAL LEARNING MARKET: EVOLUTION
                    FIGURE 23 BRIEF HISTORY OF CASEL
    5.3 ECOSYSTEM/MARKET MAP 
           FIGURE 24 KEY PLAYERS IN SOCIAL AND EMOTIONAL LEARNING MARKET ECOSYSTEM
           TABLE 8 MARKET: ECOSYSTEM
    5.4 VALUE CHAIN ANALYSIS 
           FIGURE 25 MARKET: VALUE CHAIN ANALYSIS
    5.5 TARIFF AND REGULATORY LANDSCAPE 
           5.5.1 COMMUNICATIONS ACT OF 1934
           5.5.2 GDPR
           5.5.3 INTERNATIONAL ORGANIZATION FOR STANDARDIZATION (ISO) STANDARD 27001
           5.5.4 APPI
           5.5.5 ESSA
           5.5.6 SUPPORTING SOCIAL AND EMOTIONAL LEARNING ACT
           5.5.7 ACADEMIC, SOCIAL, AND EMOTIONAL LEARNING ACT OF 2015
           5.5.8 JESSE LEWIS EMPOWERING EDUCATORS ACT
           5.5.9 SOCIAL EMOTIONAL LEARNING FOR FAMILIES ACT OF 2019
                    TABLE 9 NORTH AMERICA: LIST OF REGULATORY BODIES, GOVERNMENT AGENCIES, AND OTHER ORGANIZATIONS
                    TABLE 10 EUROPE: LIST OF REGULATORY BODIES, GOVERNMENT AGENCIES, AND OTHER ORGANIZATIONS
                    TABLE 11 ASIA PACIFIC: LIST OF REGULATORY BODIES, GOVERNMENT AGENCIES, AND OTHER ORGANIZATIONS
                    TABLE 12 MIDDLE EAST & AFRICA: LIST OF REGULATORY BODIES, GOVERNMENT AGENCIES,  AND OTHER ORGANIZATIONS
                    TABLE 13 LATIN AMERICA: LIST OF REGULATORY BODIES, GOVERNMENT AGENCIES, AND OTHER ORGANIZATIONS
    5.6 CASE STUDY ANALYSIS 
           5.6.1 CASE STUDY 1: HCA HEALTHCARE UTILIZED EVERFI’S MENTAL WELLNESS PROGRAM FOR STUDENTS
           5.6.2 CASE STUDY 2: EVERFI HELPED STUDENTS OF PRINCE WILLIAM COUNTY PUBLIC SCHOOLS TO PREPARE FOR PERSONAL AND PROFESSIONAL SUCCESS
           5.6.3 CASE STUDY 3: ILLUMINATE EDUCATION PARTNERED WITH CISD TO DEVELOP ISE SOLUTIONS FOR SPECIAL EDUCATION NEEDS
           5.6.4 CASE STUDY 4: PANORAMA EDUCATION HELPED FRESNO UNIFIED SCHOOL DISTRICT PROMOTE SEL USING RELEVANT SURVEY DATA
           5.6.5 CASE STUDY 5: NAVIGATE360 SOCIAL AND EMOTIONAL LEARNING PROGRAM HELPED STUDENTS AT MARION PUBLIC SCHOOL LEARN STRATEGIES TO RESPOND TO STRESSORS
           5.6.6 CASE STUDY 6: CERES HIGH SCHOOL USED SCHOOLMINT HERO FOR SOCIAL AND ACADEMIC SUCCESS
    5.7 PATENT ANALYSIS 
           FIGURE 26 NUMBER OF PATENTS GRANTED FOR SOCIAL AND EMOTIONAL LEARNING MARKET, 2014–2023
           5.7.1 LIST OF MAJOR PATENTS
    5.8 TECHNOLOGY ANALYSIS 
           5.8.1 KEY TECHNOLOGIES
                    5.8.1.1 AR and VR
                    5.8.1.2 AI
                    5.8.1.3 IoT
                    5.8.1.4 Big Data Analytics
                    5.8.1.5 Cloud Services
                    5.8.1.6 5G Network
           5.8.2 ADJACENT TECHNOLOGIES
                    5.8.2.1 Educational Technology (EdTech)
                    5.8.2.2 Assistive Technology
                    5.8.2.3 Blockchain
           5.8.3 COMPLEMENTARY TECHNOLOGIES
                    5.8.3.1 Natural Language Processing (NLP)
                    5.8.3.2 Biometric Feedback Devices
                    5.8.3.3 Speech Recognition Technology
    5.9 PRICING ANALYSIS 
           5.9.1 AVERAGE SELLING PRICE TREND OF KEY PLAYERS, BY OFFERING
                    FIGURE 27 AVERAGE SELLING PRICE TREND OF KEY PLAYERS, BY OFFERING (SUBSCRIPTION-BASED SOLUTIONS)
                    TABLE 14 AVERAGE SELLING PRICES OF KEY PLAYERS, BY OFFERING  (SUBSCRIPTION-BASED SOLUTIONS)
                    5.9.1.1 Average selling price trend of key players, by offering (Subscription-based solutions)
    5.10 PORTER’S FIVE FORCES ANALYSIS 
           FIGURE 28 PORTER’S FIVE FORCES ANALYSIS: SOCIAL AND EMOTIONAL LEARNING MARKET
           TABLE 15 PORTER’S FIVE FORCES IMPACT ON MARKET
           5.10.1 THREAT OF NEW ENTRANTS
           5.10.2 THREAT OF SUBSTITUTES
           5.10.3 BARGAINING POWER OF BUYERS
           5.10.4 BARGAINING POWER OF SUPPLIERS
           5.10.5 INTENSITY OF COMPETITIVE RIVALRY
    5.11 TRENDS/DISRUPTIONS IMPACTING CUSTOMER’S BUSINESS 
                    FIGURE 29 TRENDS/DISRUPTIONS IMPACTING CUSTOMER’S BUSINESS
    5.12 KEY STAKEHOLDERS AND BUYING CRITERIA 
           5.12.1 KEY STAKEHOLDERS IN BUYING PROCESS
                    FIGURE 30 INFLUENCE OF KEY STAKEHOLDERS ON BUYING PROCESS FOR TOP 5 END USERS
                    TABLE 16 INFLUENCE OF STAKEHOLDERS ON BUYING PROCESS FOR SCHOOLS (PRE-K, ELEMENTARY, AND MIDDLE AND HIGH SCHOOLS)
           5.12.2 BUYING CRITERIA
                    FIGURE 31 KEY BUYING CRITERIA FOR SCHOOLS (PRE-K, ELEMENTARY,  AND MIDDLE AND HIGH SCHOOLS)
                    TABLE 17 KEY BUYING CRITERIA FOR SCHOOLS (PRE-K, ELEMENTARY, AND MIDDLE  AND HIGH SCHOOLS)
    5.13 KEY CONFERENCES AND EVENTS IN 2023–2024 
                    TABLE 18 SOCIAL AND EMOTIONAL LEARNING MARKET: DETAILED LIST OF CONFERENCES AND EVENTS
    5.14 TECHNOLOGY ROADMAP FOR MARKET 
           5.14.1 SHORT-TERM ROADMAP (2023–2025)
           5.14.2 MID-TERM ROADMAP (2026–2028)
           5.14.3 LONG-TERM ROADMAP (2029–2030)
    5.15 BEST PRACTICES IN MARKET 
    5.16 PILLARS/PRINCIPLES OF SOCIAL AND EMOTIONAL LEARNING 
 
6 SOCIAL AND EMOTIONAL LEARNING MARKET, BY OFFERING (Page No. - 99)
    6.1 INTRODUCTION 
           FIGURE 32 SERVICES SEGMENT TO GROW AT HIGHER CAGR DURING FORECAST PERIOD
           6.1.1 OFFERINGS: SOCIAL AND EMOTIONAL LEARNING (SEL) MARKET DRIVERS
                    TABLE 19 MARKET, BY OFFERING,  2018–2022 (USD MILLION)
                    TABLE 20 MARKET, BY OFFERING,  2023–2028 (USD MILLION)
    6.2 SOLUTIONS 
           6.2.1 SEL SOLUTIONS TO HELP CHILDREN DEVELOP EMOTIONAL AND SOCIAL SKILLS, GOALS, RESPONSIBILITIES, AND DECISION-MAKING ABILITIES
                    TABLE 21 SOLUTIONS: MARKET, BY REGION,  2018–2022 (USD MILLION)
                    TABLE 22 SOLUTIONS: SOCIAL AND EMOTIONAL LEARNING (SEL) MARKET, BY REGION,  2023–2028 (USD MILLION)
    6.3 SERVICES 
           6.3.1 SEL SERVICES TO HELP LEARNERS CREATE CURRICULA AND ENSURE SMOOTH IMPLEMENTATION, GROWTH, AND MAINTENANCE OF CONTINUING ACTIVITIES
                    TABLE 23 SERVICES: MARKET, BY REGION,  2018–2022 (USD MILLION)
                    TABLE 24 SERVICES: MARKET, BY REGION,  2023–2028 (USD MILLION)
 
7 SOCIAL AND EMOTIONAL LEARNING MARKET, BY SOLUTION (Page No. - 104)
    7.1 INTRODUCTION 
           FIGURE 33 SOCIAL AND EMOTIONAL LEARNING ASSESSMENT TOOLS SEGMENT TO GROW AT HIGHER CAGR DURING FORECAST PERIOD
           7.1.1 SOLUTIONS: SOCIAL AND EMOTIONAL LEARNING (SEL) MARKET DRIVERS
                    TABLE 25 MARKET, BY SOLUTION,  2018–2022 (USD MILLION)
                    TABLE 26 MARKET, BY SOLUTION,  2023–2028 (USD MILLION)
    7.2 SOCIAL AND EMOTIONAL LEARNING PLATFORM 
           TABLE 27 SOCIAL AND EMOTIONAL LEARNING PLATFORM: MARKET, BY REGION, 2018–2022 (USD MILLION)
           TABLE 28 SOCIAL AND EMOTIONAL LEARNING PLATFORM: MARKET, BY REGION, 2023–2028 (USD MILLION)
    7.3 SOCIAL AND EMOTIONAL LEARNING ASSESSMENT TOOLS 
           TABLE 29 SOCIAL AND EMOTIONAL LEARNING ASSESSMENT TOOLS: MARKET, BY REGION, 2018–2022 (USD MILLION)
           TABLE 30 SOCIAL AND EMOTIONAL LEARNING ASSESSMENT TOOLS: MARKET, BY REGION, 2023–2028 (USD MILLION)
 
8 SOCIAL AND EMOTIONAL LEARNING MARKET, BY SERVICE (Page No. - 109)
    8.1 INTRODUCTION 
           FIGURE 34 TRAINING AND SUPPORT SERVICES SEGMENT TO WITNESS HIGHEST CAGR DURING FORECAST PERIOD
           8.1.1 SERVICES: MARKET DRIVERS
                    TABLE 31 MARKET, BY SERVICE,  2018–2022 (USD MILLION)
                    TABLE 32 MARKET, BY SERVICE,  2023–2028 (USD MILLION)
    8.2 CONSULTING 
           8.2.1 CONSULTING SERVICES TO DEVELOP FRESH REGULATIONS AND BEST PRACTICES FOR EDUCATORS
                    TABLE 33 CONSULTING: MARKET, BY REGION,  2018–2022 (USD MILLION)
                    TABLE 34 CONSULTING: MARKET, BY REGION,  2023–2028 (USD MILLION)
    8.3 DEPLOYMENT AND INTEGRATION 
           8.3.1 DEPLOYMENT AND INTEGRATION SERVICES TO STREAMLINE PROCESSES, AVOID SERVICE INTERRUPTIONS, AND CUT DOWN DEPLOYMENT COSTS
                    TABLE 35 DEPLOYMENT AND INTEGRATION: MARKET,  BY REGION, 2018–2022 (USD MILLION)
                    TABLE 36 DEPLOYMENT AND INTEGRATION: MARKET,  BY REGION, 2023–2028 (USD MILLION)
    8.4 TRAINING AND SUPPORT 
           8.4.1 TRAINING AND SUPPORT SERVICES TO OFFER RECOMMENDED PRACTICES THAT PROMOTE SECURITY AND LEARNING ENVIRONMENT
                    TABLE 37 TRAINING AND SUPPORT: MARKET, BY REGION, 2018–2022 (USD MILLION)
                    TABLE 38 TRAINING AND SUPPORT: MARKET, BY REGION, 2023–2028 (USD MILLION)
 
9 SOCIAL AND EMOTIONAL LEARNING MARKET, BY CORE COMPETENCY (Page No. - 115)
    9.1 INTRODUCTION 
           9.1.1 CORE COMPETENCIES: SOCIAL AND EMOTIONAL LEARNING (SEL) MARKET DRIVERS
    9.2 SELF-AWARENESS 
           9.2.1 SELF-AWARENESS TO HELP PEOPLE RECOGNIZE BIASES AND UNDERSTAND IMPACT OF RACE AND ETHNICITY ON IDENTITY
    9.3 SELF-MANAGEMENT 
           9.3.1 SELF-MANAGEMENT TO EFFECTIVELY CONTROL ONE'S EMOTIONS, THOUGHTS, AND BEHAVIORS TO ACHIEVE GOALS AND ASPIRATIONS
    9.4 SOCIAL AWARENESS 
           9.4.1 SOCIAL AWARENESS TO HELP EMPATHIZE WITH OTHERS, UNDERSTAND GENERAL SOCIETAL NORMS IN DIFFERENT CONTEXTS, AND RECOGNIZE RESOURCES AND SUPPORT
    9.5 RELATIONSHIP SKILLS 
           9.5.1 RELATIONSHIP SKILLS TO PROMOTE EQUITY AND RESOLVE ISSUES ACROSS RACIAL, CULTURAL, GENDER, AND SOCIAL BOUNDARIES
    9.6 RESPONSIBLE DECISION-MAKING 
           9.6.1 RESPONSIBLE DECISION-MAKING TO ASSIST ADULTS AND CHILDREN IN MAKING INCLUSIVE AND EQUITABLE DECISIONS
 
10 SOCIAL AND EMOTIONAL LEARNING MARKET, BY END USER (Page No. - 118)
     10.1 INTRODUCTION 
               FIGURE 35 MIDDLE AND HIGH SCHOOLS SEGMENT TO GROW AT HIGHEST CAGR DURING FORECAST PERIOD
             10.1.1 END USERS: MARKET DRIVERS
                       TABLE 39 MARKET, BY END USER,  2018–2022 (USD MILLION)
                       TABLE 40 MARKET, BY END USER,  2023–2028 (USD MILLION)
     10.2 PRE-K 
             10.2.1 SEL IN PRE-KINDERGARTEN TO ASSIST KNOWLEDGE AND SKILL DEVELOPMENT TO FOSTER POSITIVE RELATIONSHIPS
                       TABLE 41 PRE-K: MARKET, BY REGION,  2018–2022 (USD MILLION)
                       TABLE 42 PRE-K: MARKET, BY REGION,  2023–2028 (USD MILLION)
             10.2.2 PRE-K: SOCIAL AND EMOTIONAL LEARNING USE CASES
                       10.2.2.1 The Rooted School collaborated with Panorama Education to offer mindful SEL resources to school communities
     10.3 ELEMENTARY SCHOOLS 
             10.3.1 SEL IN ELEMENTARY SCHOOLS TO DEVELOP ACADEMIC AND SOCIAL SKILLS AND IMPROVE ABILITY TO LEARN ABOUT EMOTIONS AND ACADEMIC GOALS
                       TABLE 43 ELEMENTARY SCHOOLS: MARKET, BY REGION, 2018–2022 (USD MILLION)
                       TABLE 44 ELEMENTARY SCHOOLS: SOCIAL AND EMOTIONAL LEARNING MARKET, BY REGION, 2023–2028 (USD MILLION)
             10.3.2 ELEMENTARY SCHOOLS: SOCIAL AND EMOTIONAL LEARNING USE CASES
                       10.3.2.1 Panorama Education helped Cielo Vista Elementary improve students’ mindset with SEL tools
                       10.3.2.2 Napier Elementary School adopted ‘Move This World’ program to help students express feelings and emotions positively
     10.4 MIDDLE AND HIGH SCHOOLS 
             10.4.1 GROWING CONCERNS OVER SOCIAL, BEHAVIORAL DIFFICULTIES, INDISCIPLINE, EMOTIONAL DISTRESS, AND POOR MANAGEMENT TO DRIVE MARKET
                       TABLE 45 MIDDLE AND HIGH SCHOOLS: MARKET,  BY REGION, 2018–2022 (USD MILLION)
                       TABLE 46 MIDDLE AND HIGH SCHOOLS: MARKET,  BY REGION, 2023–2028 (USD MILLION)
             10.4.2 MIDDLE AND HIGH SCHOOLS: SOCIAL AND EMOTIONAL LEARNING USE CASES
                       10.4.2.1 Tooele County Public Schools (TCPS) provided essential training with SEL
                       10.4.2.2 The State of Illinois mandated incorporation of SEL curriculum in schools to reinforce lesson concepts and create common language for discussing
                       10.4.2.3 Bridgeport Public Schools promoted overall development of its students through comprehensive SEL strategies
     10.5 THERAPISTS AND PSYCHOLOGISTS 
             10.5.1 SEL TO ADDRESS FUNDAMENTAL ASPECTS OF EMOTIONAL INTELLIGENCE, INTERPERSONAL SKILLS, AND SELF-AWARENESS
                       TABLE 47 THERAPISTS AND PSYCHOLOGISTS: MARKET,  BY REGION, 2018–2022 (USD MILLION)
                       TABLE 48 THERAPISTS AND PSYCHOLOGISTS: MARKET,  BY REGION, 2023–2028 (USD MILLION)
             10.5.2 THERAPISTS AND PSYCHOLOGISTS: SOCIAL AND EMOTIONAL LEARNING USE CASES
                       10.5.2.1 Therapists adopted SEL tools to provide comprehensive support for students
     10.6 OTHER END USERS 
               TABLE 49 OTHER END USERS: MARKET,  BY REGION, 2018–2022 (USD MILLION)
               TABLE 50 OTHER END USERS: MARKET,  BY REGION, 2023–2028 (USD MILLION)
 
11 SOCIAL AND EMOTIONAL LEARNING MARKET, BY TYPE (Page No. - 129)
     11.1 INTRODUCTION 
               FIGURE 36 APPLICATION SEGMENT TO WITNESS HIGHER CAGR DURING FORECAST PERIOD
             11.1.1 TYPES: SOCIAL AND EMOTIONAL LEARNING MARKET DRIVERS
                       TABLE 51 MARKET, BY TYPE, 2018–2022 (USD MILLION)
                       TABLE 52 MARKET, BY TYPE, 2023–2028 (USD MILLION)
     11.2 WEB-BASED 
             11.2.1 WEB-BASED PLATFORMS TO ENABLE STUDENTS AND TEACHERS TO ACCESS PLATFORM AT ANY TIME AND FROM ANYWHERE
                       TABLE 53 WEB-BASED: MARKET, BY REGION,  2018–2022 (USD MILLION)
                       TABLE 54 WEB-BASED: SOCIAL AND EMOTIONAL LEARNING (SEL) MARKET, BY REGION,  2023–2028 (USD MILLION)
     11.3 APPLICATION 
             11.3.1 APPLICATION-BASED SEL PLATFORMS TO AID STUDENTS IN RURAL LOCATIONS WITH POOR INTERNET CONNECTIVITY
                       TABLE 55 APPLICATION: MARKET, BY REGION,  2018–2022 (USD MILLION)
                       TABLE 56 APPLICATION: MARKET, BY REGION,  2023–2028 (USD MILLION)
 
12 SOCIAL AND EMOTIONAL LEARNING MARKET, BY REGION (Page No. - 133)
     12.1 INTRODUCTION 
               FIGURE 37 NORTH AMERICA TO LEAD MARKET DURING FORECAST PERIOD
             12.1.1 REGIONS: MARKET DRIVERS
                       TABLE 57 MARKET, BY REGION, 2018–2022 (USD MILLION)
                       TABLE 58 MARKET, BY REGION, 2023–2028 (USD MILLION)
     12.2 NORTH AMERICA 
             12.2.1 NORTH AMERICA: MARKET DRIVERS
             12.2.2 NORTH AMERICA: RECESSION IMPACT
                       FIGURE 38 NORTH AMERICA: SOCIAL AND EMOTIONAL LEARNING MARKET SNAPSHOT
                       TABLE 59 NORTH AMERICA: MARKET, BY OFFERING,  2018–2022 (USD MILLION)
                       TABLE 60 NORTH AMERICA: SOCIAL AND EMOTIONAL LEARNING (SEL) MARKET, BY OFFERING,  2023–2028 (USD MILLION)
                       TABLE 61 NORTH AMERICA: MARKET, BY SOLUTION,  2018–2022 (USD MILLION)
                       TABLE 62 NORTH AMERICA: MARKET, BY SOLUTION,  2023–2028 (USD MILLION)
                       TABLE 63 NORTH AMERICA: MARKET, BY SERVICE,  2018–2022 (USD MILLION)
                       TABLE 64 NORTH AMERICA: MARKET, BY SERVICE,  2023–2028 (USD MILLION)
                       TABLE 65 NORTH AMERICA: MARKET, BY TYPE,  2018–2022 (USD MILLION)
                       TABLE 66 NORTH AMERICA: MARKET, BY TYPE,  2023–2028 (USD MILLION)
                       TABLE 67 NORTH AMERICA: MARKET, BY END USER,  2018–2022 (USD MILLION)
                       TABLE 68 NORTH AMERICA: MARKET, BY END USER,  2023–2028 (USD MILLION)
                       TABLE 69 NORTH AMERICA: SOCIAL AND EMOTIONAL LEARNING (SEL) MARKET, BY COUNTRY,  2018–2022 (USD MILLION)
                       TABLE 70 NORTH AMERICA: MARKET, BY COUNTRY,  2023–2028 (USD MILLION)
             12.2.3 US
                       12.2.3.1 High degree of technological awareness and increasing number of SEL vendors to propel market
                                   TABLE 71 US: SOCIAL AND EMOTIONAL LEARNING MARKET, BY OFFERING,  2018–2022 (USD MILLION)
                                   TABLE 72 US: MARKET, BY OFFERING,  2023–2028 (USD MILLION)
                                   TABLE 73 US: MARKET, BY SOLUTION,  2018–2022 (USD MILLION)
                                   TABLE 74 US: MARKET, BY SOLUTION,  2023–2028 (USD MILLION)
                                   TABLE 75 US: MARKET, BY SERVICE,  2018–2022 (USD MILLION)
                                   TABLE 76 US: MARKET, BY SERVICE,  2023–2028 (USD MILLION)
                                   TABLE 77 US: MARKET, BY TYPE, 2018–2022 (USD MILLION)
                                   TABLE 78 US: MARKET, BY TYPE, 2023–2028 (USD MILLION)
                                   TABLE 79 US: MARKET, BY END USER,  2018–2022 (USD MILLION)
                                   TABLE 80 US: MARKET, BY END USER,  2023–2028 (USD MILLION)
             12.2.4 CANADA
                       12.2.4.1 Need to improve mental and social awareness among students to drive market
                                   TABLE 81 CANADA: SOCIAL AND EMOTIONAL LEARNING MARKET, BY OFFERING,  2018–2022 (USD MILLION)
                                   TABLE 82 CANADA: MARKET, BY OFFERING,  2023–2028 (USD MILLION)
                                   TABLE 83 CANADA: MARKET, BY SOLUTION,  2018–2022 (USD MILLION)
                                   TABLE 84 CANADA: MARKET, BY SOLUTION,  2023–2028 (USD MILLION)
                                   TABLE 85 CANADA: MARKET, BY SERVICE,  2018–2022 (USD MILLION)
                                   TABLE 86 CANADA: MARKET, BY SERVICE,  2023–2028 (USD MILLION)
                                   TABLE 87 CANADA: MARKET, BY TYPE,  2018–2022 (USD MILLION)
                                   TABLE 88 CANADA: MARKET, BY TYPE,  2023–2028 (USD MILLION)
                                   TABLE 89 CANADA: MARKET, BY END USER,  2018–2022 (USD MILLION)
                                   TABLE 90 CANADA: MARKET, BY END USER,  2023–2028 (USD MILLION)
                                   12.3 EUROPE
             12.3.1 EUROPE: MARKET DRIVERS
             12.3.2 EUROPE: RECESSION IMPACT
                       TABLE 91 EUROPE: SOCIAL AND EMOTIONAL LEARNING MARKET, BY OFFERING,  2018–2022 (USD MILLION)
                       TABLE 92 EUROPE: MARKET, BY OFFERING,  2023–2028 (USD MILLION)
                       TABLE 93 EUROPE: MARKET, BY SOLUTION,  2018–2022 (USD MILLION)
                       TABLE 94 EUROPE: MARKET, BY SOLUTION,  2023–2028 (USD MILLION)
                       TABLE 95 EUROPE: MARKET, BY SERVICE,  2018–2022 (USD MILLION)
                       TABLE 96 EUROPE: MARKET, BY SERVICE,  2023–2028 (USD MILLION)
                       TABLE 97 EUROPE: MARKET, BY TYPE,  2018–2022 (USD MILLION)
                       TABLE 98 EUROPE: MARKET, BY TYPE,  2023–2028 (USD MILLION)
                       TABLE 99 EUROPE: MARKET, BY END USER,  2018–2022 (USD MILLION)
                       TABLE 100 EUROPE: MARKET, BY END USER,  2023–2028 (USD MILLION)
                       TABLE 101 EUROPE: MARKET, BY COUNTRY,  2018–2022 (USD MILLION)
                       TABLE 102 EUROPE: MARKET, BY COUNTRY,  2023–2028 (USD MILLION)
             12.3.3 UK
                       12.3.3.1 Thriving economy, diverse population, robust IT infrastructure, and government investment to drive market
                                   TABLE 103 UK: SOCIAL AND EMOTIONAL LEARNING MARKET, BY OFFERING,  2018–2022 (USD MILLION)
                                   TABLE 104 UK: MARKET, BY OFFERING,  2023–2028 (USD MILLION)
                                   TABLE 105 UK: MARKET, BY SOLUTION,  2018–2022 (USD MILLION)
                                   TABLE 106 UK: MARKET, BY SOLUTION,  2023–2028 (USD MILLION)
                                   TABLE 107 UK: MARKET, BY SERVICE,  2018–2022 (USD MILLION)
                                   TABLE 108 UK: MARKET, BY SERVICE,  2023–2028 (USD MILLION)
                                   TABLE 109 UK: MARKET, BY TYPE, 2018–2022 (USD MILLION)
                                   TABLE 110 UK: MARKET, BY TYPE, 2023–2028 (USD MILLION)
                                   TABLE 111 UK: MARKET, BY END USER,  2018–2022 (USD MILLION)
                                   TABLE 112 UK: MARKET, BY END USER,  2023–2028 (USD MILLION)
             12.3.4 GERMANY
                       12.3.4.1 Initiatives from ‘Digital Agenda’ and growing mental health issues to propel market
                                   TABLE 113 GERMANY: SOCIAL AND EMOTIONAL LEARNING MARKET, BY OFFERING,  2018–2022 (USD MILLION)
                                   TABLE 114 GERMANY: MARKET, BY OFFERING,  2023–2028 (USD MILLION)
                                   TABLE 115 GERMANY: MARKET, BY SOLUTION,  2018–2022 (USD MILLION)
                                   TABLE 116 GERMANY: MARKET, BY SOLUTION,  2023–2028 (USD MILLION)
                                   TABLE 117 GERMANY: MARKET, BY SERVICE,  2018–2022 (USD MILLION)
                                   TABLE 118 GERMANY: MARKET, BY SERVICE,  2023–2028 (USD MILLION)
                                   TABLE 119 GERMANY: MARKET, BY TYPE,  2018–2022 (USD MILLION)
                                   TABLE 120 GERMANY: MARKET, BY TYPE,  2023–2028 (USD MILLION)
                                   TABLE 121 GERMANY: MARKET, BY END USER,  2018–2022 (USD MILLION)
                                   TABLE 122 GERMANY: MARKET, BY END USER,  2023–2028 (USD MILLION)
             12.3.5 FRANCE
                       12.3.5.1 Strong economic infrastructure, high internet penetration rate, and emergence of high-tech infrastructure to propel market
             12.3.6 ITALY
                       12.3.6.1 Outstanding primary education system and need to develop social and emotional intelligence to propel market
             12.3.7 SPAIN
                       12.3.7.1 Rising demand for innovative and rigorous K–12 educational experiences and growing awareness for SEL to propel market
             12.3.8 NORDIC COUNTRIES
                       12.3.8.1 Focus on developing social-emotional skills to fuel demand for SEL solutions
             12.3.9 REST OF EUROPE
     12.4 ASIA PACIFIC 
             12.4.1 ASIA PACIFIC: MARKET DRIVERS
             12.4.2 ASIA PACIFIC: RECESSION IMPACT
                       FIGURE 39 ASIA PACIFIC: SOCIAL AND EMOTIONAL LEARNING MARKET SNAPSHOT
                       TABLE 123 ASIA PACIFIC: MARKET, BY OFFERING,  2018–2022 (USD MILLION)
                       TABLE 124 ASIA PACIFIC: MARKET, BY OFFERING,  2023–2028 (USD MILLION)
                       TABLE 125 ASIA PACIFIC: MARKET, BY SOLUTION,  2018–2022 (USD MILLION)
                       TABLE 126 ASIA PACIFIC: MARKET, BY SOLUTION,  2023–2028 (USD MILLION)
                       TABLE 127 ASIA PACIFIC: MARKET, BY SERVICE,  2018–2022 (USD MILLION)
                       TABLE 128 ASIA PACIFIC: MARKET, BY SERVICE,  2023–2028 (USD MILLION)
                       TABLE 129 ASIA PACIFIC: MARKET, BY TYPE,  2018–2022 (USD MILLION)
                       TABLE 130 ASIA PACIFIC: MARKET, BY TYPE,  2023–2028 (USD MILLION)
                       TABLE 131 ASIA PACIFIC: MARKET, BY END USER,  2018–2022 (USD MILLION)
                       TABLE 132 ASIA PACIFIC: MARKET, BY END USER,  2023–2028 (USD MILLION)
                       TABLE 133 ASIA PACIFIC: MARKET, BY COUNTRY,  2018–2022 (USD MILLION)
                       TABLE 134 ASIA PACIFIC: MARKET, BY COUNTRY,  2023–2028 (USD MILLION)
             12.4.3 CHINA
                       12.4.3.1 Investment in cutting-edge technology and increased educational awareness to drive market
                                   TABLE 135 CHINA: SOCIAL AND EMOTIONAL LEARNING MARKET, BY OFFERING,  2018–2022 (USD MILLION)
                                   TABLE 136 CHINA: MARKET, BY OFFERING,  2023–2028 (USD MILLION)
                                   TABLE 137 CHINA: MARKET, BY SOLUTION,  2018–2022 (USD MILLION)
                                   TABLE 138 CHINA: MARKET, BY SOLUTION,  2023–2028 (USD MILLION)
                                   TABLE 139 CHINA: MARKET, BY SERVICE,  2018–2022 (USD MILLION)
                                   TABLE 140 CHINA: MARKET, BY SERVICE,  2023–2028 (USD MILLION)
                                   TABLE 141 CHINA: MARKET, BY TYPE,  2018–2022 (USD MILLION)
                                   TABLE 142 CHINA: MARKET, BY TYPE,  2023–2028 (USD MILLION)
                                   TABLE 143 CHINA: MARKET, BY END USER,  2018–2022 (USD MILLION)
                                   TABLE 144 CHINA: MARKET, BY END USER,  2023–2028 (USD MILLION)
             12.4.4 JAPAN
                       12.4.4.1 Demand for robust educational system and initiatives such as GIGA School project to propel market
                                   TABLE 145 JAPAN: SOCIAL AND EMOTIONAL LEARNING MARKET, BY OFFERING,  2018–2022 (USD MILLION)
                                   TABLE 146 JAPAN: MARKET, BY OFFERING,  2023–2028 (USD MILLION)
                                   TABLE 147 JAPAN: MARKET, BY SOLUTION,  2018–2022 (USD MILLION)
                                   TABLE 148 JAPAN: MARKET, BY SOLUTION,  2023–2028 (USD MILLION)
                                   TABLE 149 JAPAN: MARKET, BY SERVICE,  2018–2022 (USD MILLION)
                                   TABLE 150 JAPAN: MARKET, BY SERVICE,  2023–2028 (USD MILLION)
                                   TABLE 151 JAPAN: MARKET, BY TYPE,  2018–2022 (USD MILLION)
                                   TABLE 152 JAPAN: MARKET, BY TYPE,  2023–2028 (USD MILLION)
                                   TABLE 153 JAPAN: MARKET, BY END USER,  2018–2022 (USD MILLION)
                                   TABLE 154 JAPAN: MARKET, BY END USER,  2023–2028 (USD MILLION)
             12.4.5 INDIA
                       12.4.5.1 Rising need for online learning platforms and increasing government spending on education to drive market
                                   TABLE 155 INDIA: SOCIAL AND EMOTIONAL LEARNING MARKET, BY OFFERING,  2018–2022 (USD MILLION)
                                   TABLE 156 INDIA: MARKET, BY OFFERING,  2023–2028 (USD MILLION)
                                   TABLE 157 INDIA: MARKET, BY SOLUTION,  2018–2022 (USD MILLION)
                                   TABLE 158 INDIA: MARKET, BY SOLUTION,  2023–2028 (USD MILLION)
                                   TABLE 159 INDIA: MARKET, BY SERVICE,  2018–2022 (USD MILLION)
                                   TABLE 160 INDIA: MARKET, BY SERVICE,  2023–2028 (USD MILLION)
                                   TABLE 161 INDIA: MARKET, BY TYPE,  2018–2022 (USD MILLION)
                                   TABLE 162 INDIA: MARKET, BY TYPE,  2023–2028 (USD MILLION)
                                   TABLE 163 INDIA: MARKET, BY END USER,  2018–2022 (USD MILLION)
                                   TABLE 164 INDIA: MARKET, BY END USER,  2023–2028 (USD MILLION)
             12.4.6 AUSTRALIA AND NEW ZEALAND
                       12.4.6.1 Commitment to offer high-quality education and focus on developing cognitive and social skills to propel market
                                   TABLE 165 AUSTRALIA AND NEW ZEALAND: SOCIAL AND EMOTIONAL LEARNING MARKET,  BY OFFERING, 2018–2022 (USD MILLION)
                                   TABLE 166 AUSTRALIA AND NEW ZEALAND: MARKET,  BY OFFERING, 2023–2028 (USD MILLION)
                                   TABLE 167 AUSTRALIA AND NEW ZEALAND: MARKET,  BY SOLUTION, 2018–2022 (USD MILLION)
                                   TABLE 168 AUSTRALIA AND NEW ZEALAND: MARKET,  BY SOLUTION, 2023–2028 (USD MILLION)
                                   TABLE 169 AUSTRALIA AND NEW ZEALAND: MARKET,  BY SERVICE, 2018–2022 (USD MILLION)
                                   TABLE 170 AUSTRALIA AND NEW ZEALAND: MARKET,  BY SERVICE, 2023–2028 (USD MILLION)
                                   TABLE 171 AUSTRALIA AND NEW ZEALAND: MARKET, BY TYPE,  2018–2022 (USD MILLION)
                                   TABLE 172 AUSTRALIA AND NEW ZEALAND: MARKET, BY TYPE,  2023–2028 (USD MILLION)
                                   TABLE 173 AUSTRALIA AND NEW ZEALAND: MARKET,  BY END USER, 2018–2022 (USD MILLION)
                                   TABLE 174 AUSTRALIA AND NEW ZEALAND: MARKET,  BY END USER, 2023–2028 (USD MILLION)
             12.4.7 SOUTH KOREA
                       12.4.7.1 Government investment and growing focus on enhancing students' emotional intelligence and well-being to drive market
             12.4.8 SOUTHEAST ASIA
                       12.4.8.1 Rising awareness regarding students’ well-being, government support, and increasing prevalence of mental health problems among children to drive market
             12.4.9 REST OF ASIA PACIFIC
     12.5 MIDDLE EAST & AFRICA 
             12.5.1 MIDDLE EAST & AFRICA: MARKET DRIVERS
             12.5.2 MIDDLE EAST & AFRICA: RECESSION IMPACT
                       TABLE 175 MIDDLE EAST & AFRICA: SOCIAL AND EMOTIONAL LEARNING MARKET,  BY OFFERING, 2018–2022 (USD MILLION)
                       TABLE 176 MIDDLE EAST & AFRICA: MARKET,  BY OFFERING, 2023–2028 (USD MILLION)
                       TABLE 177 MIDDLE EAST & AFRICA: MARKET,  BY SOLUTION, 2018–2022 (USD MILLION)
                       TABLE 178 MIDDLE EAST & AFRICA: MARKET,  BY SOLUTION, 2023–2028 (USD MILLION)
                       TABLE 179 MIDDLE EAST & AFRICA: MARKET,  BY SERVICE, 2018–2022 (USD MILLION)
                       TABLE 180 MIDDLE EAST & AFRICA: MARKET,  BY SERVICE, 2023–2028 (USD MILLION)
                       TABLE 181 MIDDLE EAST & AFRICA: MARKET, BY TYPE,  2018–2022 (USD MILLION)
                       TABLE 182 MIDDLE EAST & AFRICA: MARKET, BY TYPE,  2023–2028 (USD MILLION)
                       TABLE 183 MIDDLE EAST & AFRICA: MARKET, BY END USER, 2018–2022 (USD MILLION)
                       TABLE 184 MIDDLE EAST & AFRICA: MARKET, BY END USER, 2023–2028 (USD MILLION)
                       TABLE 185 MIDDLE EAST & AFRICA: MARKET,  BY COUNTRY, 2018–2022 (USD MILLION)
                       TABLE 186 MIDDLE EAST & AFRICA: MARKET,  BY COUNTRY, 2023–2028 (USD MILLION)
                       TABLE 187 GCC COUNTRIES: MARKET,  BY COUNTRY, 2018–2022 (USD MILLION)
                       TABLE 188 GCC COUNTRIES: MARKET,  BY COUNTRY, 2023–2028 (USD MILLION)
             12.5.3 GCC COUNTRIES
                       12.5.3.1 UAE
                                   12.5.3.1.1 Increase in government initiatives to promote SEL programs to boost market
                       12.5.3.2 KSA
                                   12.5.3.2.1 Government investment in high-tech and smart businesses, expanding digital content and media and improving telecommunications networks to drive market
                       12.5.3.3 Rest of GCC Countries
             12.5.4 SOUTH AFRICA
                       12.5.4.1 Low cost of voice services and availability of IT professionals on demand to boost market
             12.5.5 REST OF MIDDLE EAST & AFRICA
     12.6 LATIN AMERICA 
             12.6.1 LATIN AMERICA: MARKET DRIVERS
             12.6.2 LATIN AMERICA: RECESSION IMPACT
                       TABLE 189 LATIN AMERICA: SOCIAL AND EMOTIONAL LEARNING MARKET, BY OFFERING,  2018–2022 (USD MILLION)
                       TABLE 190 LATIN AMERICA: MARKET, BY OFFERING,  2023–2028 (USD MILLION)
                       TABLE 191 LATIN AMERICA: MARKET, BY SOLUTION,  2018–2022 (USD MILLION)
                       TABLE 192 LATIN AMERICA: MARKET, BY SOLUTION,  2023–2028 (USD MILLION)
                       TABLE 193 LATIN AMERICA: MARKET, BY SERVICE,  2018–2022 (USD MILLION)
                       TABLE 194 LATIN AMERICA: MARKET, BY SERVICE,  2023–2028 (USD MILLION)
                       TABLE 195 LATIN AMERICA: MARKET, BY TYPE,  2018–2022 (USD MILLION)
                       TABLE 196 LATIN AMERICA: MARKET, BY TYPE,  2023–2028 (USD MILLION)
                       TABLE 197 LATIN AMERICA: MARKET, BY END USER,  2018–2022 (USD MILLION)
                       TABLE 198 LATIN AMERICA: MARKET, BY END USER,  2023–2028 (USD MILLION)
                       TABLE 199 LATIN AMERICA: MARKET, BY COUNTRY,  2018–2022 (USD MILLION)
                       TABLE 200 LATIN AMERICA: MARKET, BY COUNTRY,  2023–2028 (USD MILLION)
             12.6.3 BRAZIL
                       12.6.3.1 Need to develop social and emotional competencies and reduce instances of violence among students to propel market
             12.6.4 MEXICO
                       12.6.4.1 Implementation of cutting-edge technologies, such as CVR, to propel market
             12.6.5 REST OF LATIN AMERICA
 
13 COMPETITIVE LANDSCAPE (Page No. - 192)
     13.1 INTRODUCTION 
     13.2 KEY PLAYER STRATEGIES/RIGHT TO WIN 
               TABLE 201 OVERVIEW OF STRATEGIES ADOPTED BY KEY MARKET VENDORS
     13.3 REVENUE ANALYSIS 
               FIGURE 40 REVENUE ANALYSIS FOR KEY SOCIAL EMOTIONAL LEARNING COMPANIES IN PAST 5 YEARS
     13.4 MARKET SHARE ANALYSIS 
               FIGURE 41 SHARE OF LEADING SOCIAL EMOTIONAL LEARNING COMPANIES IN MARKET, 2022
               TABLE 202 SOCIAL AND EMOTIONAL LEARNING MARKET: DEGREE OF COMPETITION
     13.5 COMPANY EVALUATION MATRIX 
             13.5.1 STARS
             13.5.2 EMERGING LEADERS
             13.5.3 PERVASIVE PLAYERS
             13.5.4 PARTICIPANTS
                       FIGURE 42 GLOBAL MARKET COMPANY EVALUATION MATRIX, 2022
             13.5.5 COMPANY FOOTPRINT
                       TABLE 203 OVERALL COMPANY FOOTPRINT
                       TABLE 204 OFFERING FOOTPRINT
                       TABLE 205 END USER FOOTPRINT
                       TABLE 206 COMPANY REGION FOOTPRINT
                       TABLE 207 COMPANY FOOTPRINT
     13.6 START-UP/SME EVALUATION MATRIX 
             13.6.1 PROGRESSIVE SOCIAL EMOTIONAL LEARNING COMPANIES
             13.6.2 RESPONSIVE COMPANIES
             13.6.3 DYNAMIC COMPANIES
             13.6.4 STARTING BLOCKS
                       FIGURE 43 GLOBAL MARKET START-UP/SME EVALUATION MATRIX, 2022
             13.6.5 COMPETITIVE BENCHMARKING
                       TABLE 208 MARKET: DETAILED LIST OF KEY START-UPS/SMES
                       TABLE 209 MARKET: COMPETITIVE BENCHMARKING OF START-UPS/SMES
     13.7 COMPETITIVE SCENARIO AND TRENDS 
             13.7.1 PRODUCT LAUNCHES
                       TABLE 210 MARKET: PRODUCT LAUNCHES, FEBRUARY 2021–MAY 2022
             13.7.2 DEALS
                       TABLE 211 MARKET: DEALS, JANUARY 2021–AUGUST 2023
     13.8 MARKET: PRODUCT BENCHMARKING 
             13.8.1 PROMINENT MARKET VENDORS
                       TABLE 212 COMPARATIVE ANALYSIS OF PROMINENT SOCIAL AND EMOTIONAL LEARNING MARKET VENDORS
                       13.8.1.1 Everyday Speech Social Communication
                       13.8.1.2 Brighten Learning Social Express
                       13.8.1.3 Nearpod SEL
                       13.8.1.4 Moozoom SEL
 
14 COMPANY PROFILES (Page No. - 210)
(Business overview, Products/Services/Solutions offered, Recent Developments, MNM view)*
     14.1 KEY PLAYERS 
             14.1.1 COMMITTEE FOR CHILDREN
                       TABLE 213 COMMITTEE FOR CHILDREN: COMPANY OVERVIEW
                       TABLE 214 COMMITTEE FOR CHILDREN: PRODUCTS/SOLUTIONS/SERVICES OFFERED
                       TABLE 215 COMMITTEE FOR CHILDREN: PRODUCT LAUNCHES
                       TABLE 216 COMMITTEE FOR CHILDREN: DEALS
             14.1.2 EVERFI
                       TABLE 217 EVERFI: COMPANY OVERVIEW
                       TABLE 218 EVERFI: PRODUCTS/SOLUTIONS/SERVICES OFFERED
                       TABLE 219 EVERFI: PRODUCT LAUNCHES
                       TABLE 220 EVERFI: DEALS
                       TABLE 221 EVERFI: OTHERS
             14.1.3 NEARPOD
                       TABLE 222 NEARPOD: COMPANY OVERVIEW
                       TABLE 223 NEARPOD: PRODUCTS/SOLUTIONS/SERVICES OFFERED
                       TABLE 224 NEARPOD: PRODUCT LAUNCHES
                       TABLE 225 NEARPOD: DEALS
             14.1.4 ILLUMINATE EDUCATION
                       TABLE 226 ILLUMINATE EDUCATION: COMPANY OVERVIEW
                       TABLE 227 ILLUMINATE EDUCATION: PRODUCTS/SOLUTIONS/SERVICES OFFERED
                       TABLE 228 ILLUMINATE EDUCATION: PRODUCT LAUNCHES
                       TABLE 229 ILLUMINATE EDUCATION: DEALS
             14.1.5 PANORAMA EDUCATION
                       TABLE 230 PANORAMA EDUCATION: COMPANY OVERVIEW
                       TABLE 231 PANORAMA EDUCATION: PRODUCTS/SOLUTIONS/SERVICES OFFERED
                       TABLE 232 PANORAMA EDUCATION: PRODUCT LAUNCHES
                       TABLE 233 PANORAMA EDUCATION: DEALS
             14.1.6 SCHOOLMINT
                       TABLE 234 SCHOOLMINT: COMPANY OVERVIEW
                       TABLE 235 SCHOOLMINT: PRODUCTS/SOLUTIONS/SERVICES OFFERED
                       TABLE 236 SCHOOLMINT: DEALS
             14.1.7 NEWSELA
                       TABLE 237 NEWSELA: COMPANY OVERVIEW
                       TABLE 238 NEWSELA: PRODUCTS/SOLUTIONS/SERVICES OFFERED
                       TABLE 239 NEWSELA: PRODUCT LAUNCHES
                       TABLE 240 NEWSELA: DEALS
             14.1.8 PLAYWORKS
                       TABLE 241 PLAYWORKS: COMPANY OVERVIEW
                       TABLE 242 PLAYWORKS: PRODUCTS/SOLUTIONS/SERVICES OFFERED
                       TABLE 243 PLAYWORKS: DEALS
             14.1.9 WINGS FOR KIDS
                       TABLE 244 WINGS FOR KIDS: COMPANY OVERVIEW
                       TABLE 245 WINGS FOR KIDS: PRODUCTS/SOLUTIONS/SERVICES OFFERED
                       TABLE 246 WINGS FOR KIDS: DEALS
             14.1.10 RETHINK ED
                       TABLE 247 RETHINK ED: COMPANY OVERVIEW
                       TABLE 248 RETHINK ED: PRODUCTS/SOLUTIONS/SERVICES OFFERED
                       TABLE 249 RETHINK ED: DEALS
             14.1.11 MOVE THIS WORLD
             14.1.12 POSITIVE ACTION
             14.1.13 GROWING LEADERS
             14.1.14 7 MINDSETS
             14.1.15 ORI LEARNING
             14.1.16 THE CONOVER COMPANY
             14.1.17 IMAGINE LEARNING
             14.1.18 NAVIGATE360
             14.1.19 PEEKAPAK
             14.1.20 PATHS PROGRAM LLC
     14.2 START-UPS/SMES 
             14.2.1 BRIGHTEN LEARNING
             14.2.2 APERTURE EDUCATION
             14.2.3 TAPROOT LEARNING
             14.2.4 MEANDMINE
             14.2.5 BASE EDUCATION
             14.2.6 EVERYDAY SPEECH
             14.2.7 MOOZOOM
             14.2.8 WAYFINDER
             14.2.9 HEYKIDDO
             14.2.10 CLASSCRAFT
             14.2.11 TAMBORO
             14.2.12 PERSONA EDUCATION
*Details on Business overview, Products/Services/Solutions offered, Recent Developments, MNM view might not be captured in case of unlisted companies.
 
15 ADJACENT/RELATED MARKETS (Page No. - 247)
     15.1 INTRODUCTION 
     15.2 LIMITATIONS 
     15.3 SMART LEARNING MARKET 
             15.3.1 MARKET DEFINITION
             15.3.2 MARKET OVERVIEW
                       15.3.2.1 Smart learning market, by component
                                   TABLE 250 SMART LEARNING MARKET, BY COMPONENT, 2017–2020 (USD MILLION)
                                   TABLE 251 SMART LEARNING MARKET, BY COMPONENT, 2021–2026 (USD MILLION)
                       15.3.2.2 Smart learning market, by service
                                   TABLE 252 SMART LEARNING MARKET, BY SERVICE, 2017–2020 (USD MILLION)
                                   TABLE 253 SMART LEARNING MARKET, BY SERVICE, 2021–2026 (USD MILLION)
                       15.3.2.3 Smart learning market, by learning type
                                   TABLE 254 SMART LEARNING MARKET, BY LEARNING TYPE, 2017–2020 (USD MILLION)
                                   TABLE 255 SMART LEARNING MARKET, BY LEARNING TYPE, 2021–2026 (USD MILLION)
                       15.3.2.4 Smart learning market, by region
     15.4 EDUCATION ERP MARKET 
             15.4.1 MARKET DEFINITION
             15.4.2 MARKET OVERVIEW
                       15.4.2.1 Education ERP market, by component
                                   TABLE 256 EDUCATION ERP MARKET, BY COMPONENT, 2017–2020 (USD MILLION)
                                   TABLE 257 EDUCATION ERP MARKET, BY COMPONENT, 2021–2026 (USD MILLION)
                       15.4.2.2 Education ERP market, by application
                                   TABLE 258 EDUCATION ERP MARKET, BY APPLICATION, 2017–2020 (USD MILLION)
                                   TABLE 259 EDUCATION ERP MARKET, BY APPLICATION, 2021–2026 (USD MILLION)
                       15.4.2.3 Education ERP market, by deployment type
                                   TABLE 260 EDUCATION ERP MARKET, BY DEPLOYMENT TYPE, 2017–2020 (USD MILLION)
                                   TABLE 261 EDUCATION ERP MARKET, BY DEPLOYMENT TYPE, 2021–2026 (USD MILLION)
                       15.4.2.4 Education ERP market, by region
 
16 APPENDIX (Page No. - 255)
     16.1 DISCUSSION GUIDE 
     16.2 KNOWLEDGESTORE: MARKETSANDMARKETS’ SUBSCRIPTION PORTAL 
     16.3 CUSTOMIZATION OPTIONS 
     16.4 RELATED REPORTS 
     16.5 AUTHOR DETAILS 

The study involved four major activities in estimating the current size of the global SEL market. In the first step, exhaustive secondary research collected information on the market, peer, and parent markets. The next step was to validate these findings, assumptions, and sizing with industry experts across the value chain through primary research. Both top-down and bottom-up approaches were employed to estimate the total SEL market size. After that, the market breakup and data triangulation techniques were used to estimate the market size of segments and subsegments.

Secondary Research

In the secondary research process, various secondary sources, such as Bloomberg and BusinessWeek, have been referred to identify and collect information for this study. The secondary sources included annual reports, press releases, investor presentations of companies, white papers, journals, such as Linux Journal and Container Journal, and articles from recognized authors, directories, and databases.

Primary Research

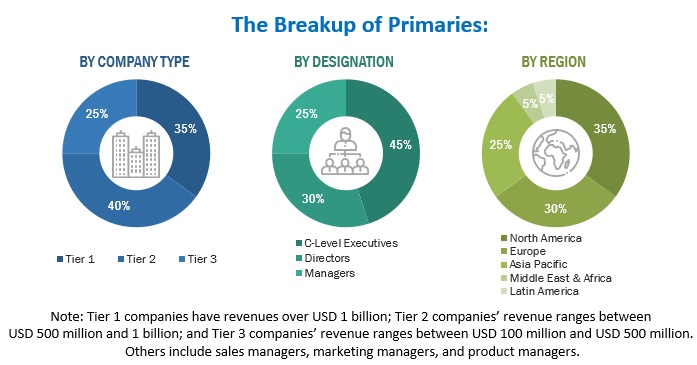
Various primary sources from the supply and demand sides were interviewed to obtain qualitative and quantitative information for this report. The primary sources from the supply side included industry experts, such as Chief Executive Officers (CEOs), Chief Marketing Officers (CMO), Vice Presidents (VPs), Managing Directors (MDs), technology and innovation directors, and related key executives from various key companies and organizations operating in the SEL market along with the associated service providers, and system integrators working in the targeted regions. All possible parameters that affect the market covered in this research study have been accounted for, viewed in extensive detail, verified through primary research, and analyzed to get the final quantitative and qualitative data. Following is the breakup of primary respondents.
Social and Emotional Learning Market Size, and Share

To know about the assumptions considered for the study, download the pdf brochure

Market Size Estimation

The top-down and bottom-up approaches were used to estimate and forecast the SEL market and other dependent submarkets. The bottom-up procedure was used to arrive at the overall market size of the global SEL market using key companies’ revenue and their offerings in the market. The research methodology used to estimate the market size includes the following:

  • The key players in the SEL market have been identified through extensive secondary research.
  • Regarding value, the market size has been determined through primary and secondary research processes.
  • All percentage shares, splits, and breakups have been determined using secondary sources and verified through primary sources.

SEL Market Size: Bottom-Up Approach

Social and Emotional Learning Market Size, and Share

To know about the assumptions considered for the study, Request for Free Sample Report

SEL Market Size: Top-Down Approach

Social and Emotional Learning Market Size, and Share

Data Triangulation

With data triangulation and validation through primary interviews, this study determined and confirmed the exact value of the overall parent market size. The overall market size was then used in the top-down procedure to estimate the size of other individual markets via percentage splits of the market segmentation.

Market Definition

According to Collaborative for Academic, Social, and Emotional Learning (CASEL), social and emotional learning can be integral to education and human development. SEL is the process through which all young people and adults acquire and apply the knowledge, skills, and attitudes to develop healthy identities, manage emotions and achieve personal and collective goals, feel and show empathy for others, establish and maintain supportive relationships, and make responsible and caring decisions. SEL advances educational equity and excellence through authentic school-family-community partnerships to develop learning environments and experiences with trusting and collaborative relationships, rigorous and meaningful curriculum and instruction, and ongoing evaluation. SEL can help address various forms of inequity and empower young people and adults to co-create thriving schools and contribute to safe, healthy, and just communities.

Key Stakeholders

  • SEL Providers
  • Independent Software Vendors (ISVs)
  • SEL Content Developers
  • Education Consultants
  • System Integrators
  • Educationists
  • Corporate Trainers
  • Compliance Regulatory Authorities
  • Government Authorities
  • University Bodies
  • Professors and Teachers
  • Investment Firms

Report Objectives

  • To determine, segment, and forecast the global SEL market by offering solutions, services, core competency, type, end user, and regions in terms of value.
  • To forecast the size of the market segments to five main regions: North America, Europe, Asia Pacific, Middle East and Africa, and Latin America 
  • To provide detailed information about the major factors (drivers, opportunities, threats, and challenges) influencing the growth of the SEL market
  • To study the complete value chain and related industry segments and perform a value chain analysis of the SEL market landscape.
  • To strategically analyze the macro and micro markets to individual growth trends, prospects, and contributions to the total SEL market
  • To analyze the industry trends, pricing data, patents, and innovations related to the SEL market.
  • To analyze the opportunities for stakeholders by identifying the high-growth segments of the SEL market
  • To profile the key players in the market and comprehensively analyze their market share/ranking and core competencies.
  • Track and analyze competitive developments, such as mergers and acquisitions, product launches and developments, partnerships, agreements, collaborations, business expansions, and Research & Development (R&D) activities.

Available Customizations

With the given market data, MarketsandMarkets offers customizations per the company’s specific needs. The following customization options are available for the report:

Company Information

  • Detailed analysis and profiling of an additional two market players
Custom Market Research Services

We will customize the research for you, in case the report listed above does not meet with your exact requirements. Our custom research will comprehensively cover the business information you require to help you arrive at strategic and profitable business decisions.

Request Customization

Instant Answers with GPT - Ask Now!

Ask real questions. Get complete answers !
Report Code
TC 7519
Published ON
Nov, 2023
Choose License Type
BUY NOW
  • SHARE
X
Request Customization
Speak to Analyst
Speak to Analyst
OR FACE-TO-FACE MEETING
PERSONALIZE THIS RESEARCH
  • Triangulate with your Own Data
  • Get Data as per your Format and Definition
  • Gain a Deeper Dive on a Specific Application, Geography, Customer or Competitor
  • Any level of Personalization
REQUEST A FREE CUSTOMIZATION
LET US HELP YOU!
  • What are the Known and Unknown Adjacencies Impacting the Social and Emotional Learning Market
  • What will your New Revenue Sources be?
  • Who will be your Top Customer; what will make them switch?
  • Defend your Market Share or Win Competitors
  • Get a Scorecard for Target Partners
CUSTOMIZED WORKSHOP REQUEST
  • Call Us
  • +1-888-600-6441 (Corporate office hours)
  • +1-888-600-6441 (US/Can toll free)
  • +44-800-368-9399 (UK office hours)
CONNECT WITH US
ABOUT TRUST ONLINE
©2024 MarketsandMarkets Research Private Ltd. All rights reserved
DMCA.com Protection Status Website Feedback