
Solar Container Market Size, Share & Trends

Solar Container Market Size, Share & Trends by On-Grid, Off-Grid, Portable, Fixed, Power Capacity (Below 10 KW, Above 50KW), Solar Panels, Batteries, Inverters, Agriculture & Irrigation, Remote Charging Stations, Mining & Military, Energy Companies - Global Forecast to 2030


SOLAR CONTAINER MARKET SIZE, SHARE & TRENDS
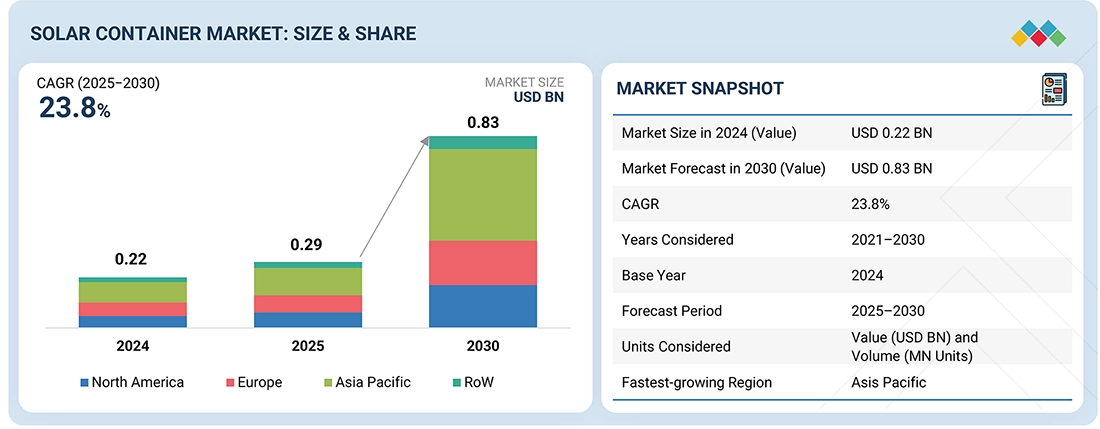
According to Marketsandmarkets, The global solar container market size was valued at USD 0.29 billion in 2025 and is projected to USD 0.83 billion by 2030, growing at a CAGR of 23.8% from 2025 to 2030. . Growth is driven by the rising adoption of off-grid and hybrid power solutions, especially in remote, disaster-prone, and developing regions. Technological advancements in portable photovoltaic modules, integrated battery storage systems, and energy management software are enhancing the efficiency, scalability, and reliability of containerized solar units, supporting applications across construction sites, mining operations, rural electrification projects, and temporary power infrastructure.
MARKET SNAPSHOT TABLE
| REPORT METRIC | DETAILS |
|---|---|
| Market Size in 2025 (Value) | USD 0.29 Billion |
| Market Forecast in 2030 (Value) | USD 0.83 Billion |
| Growth Rate | CAGR of 23.8% from 2025–2030 |
| Years Considered | 2021–2030 |
| Base Year | 2024 |
| Forecast Period | 2025–2030 |
| Units Considered | Value (USD Billion) and Volume (Million Units) |
| Report Coverage | Revenue Forecast, Company Ranking, Competitive Landscape, Growth Factors, and Trends |
| Top Companies |
|
| Growth Driver |
|
| Segments Covered |
|
| Regional Scope | North America, Europe, Asia Pacific, and RoW |
Market Size & Forecast
KEY TAKEAWAYS
-
BY TYPEBy type, the portable segment accounted for a share of 61.5% in terms of value in 2024.
-
BY COMPONENTBy component, the batteries segment is projected to grow at a CAGR of 26.9% during the forecast period.
-
BY POWER CAPACITYBy power capacity, the 10–50 KW segment is expected to hold a share of 42.9% of the solar container market in 2025.
-
BY INSTALLATION TYPEBy installation type, the on-grid segment is projected to grow at a CAGR of 28.5% during the forecast period.
-
BY APPLICATIONBy application, the agriculture and irrigation segment accounted for the largest market size in 2030.
-
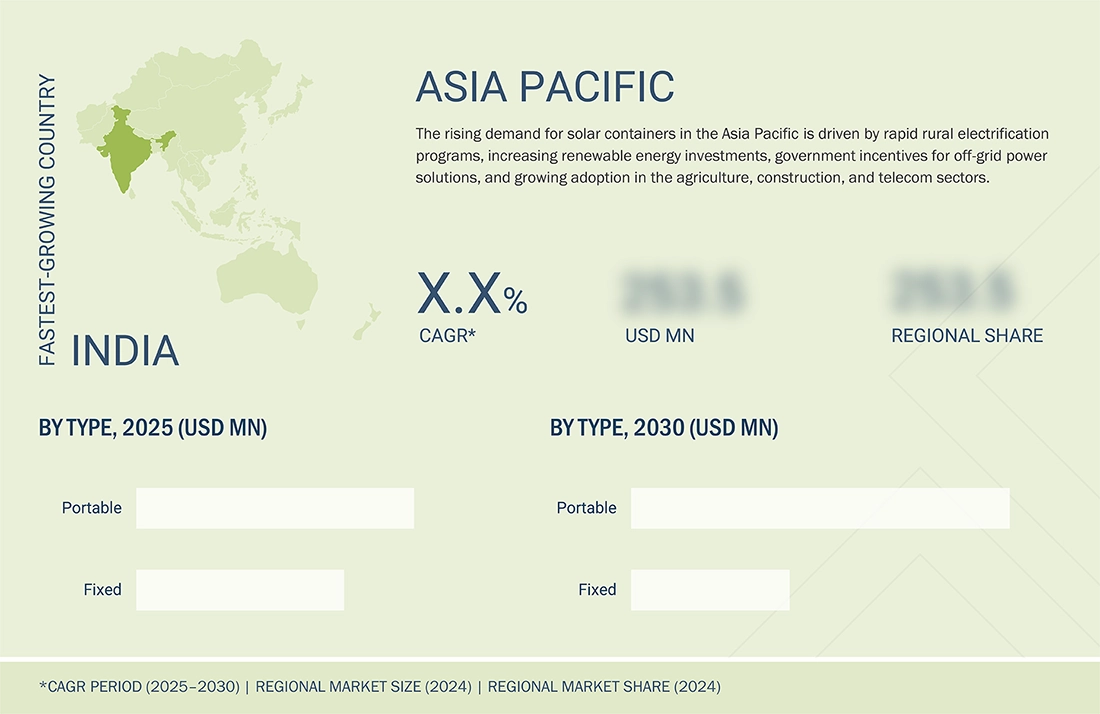
BY REGIONThe Asia Pacific region is estimated to dominate the solar container market with a share of 41.3% in 2025.
-
COMPETITIVE LANDSCAPEYangzhou CIMC New Energy Equipment, Ecosun Innovations, Hacon Containers, Faber Infrastructure, and BoxPower were identified as Star players in the solar container market share, given their broad industry coverage and strong operational & financial strength.
Solar containers are modular, self-contained power generation units that integrate solar photovoltaic panels, battery storage, and power management systems within a transportable structure. They provide reliable, off-grid energy solutions for remote sites, disaster relief operations, construction projects, and rural electrification. With growing demand for decentralized renewable power and clean energy access, the solar container industry is poised for strong growth, driven by advancements in hybrid storage systems, portability, and rapid deployment capabilities, enabling cost-effective and sustainable electrification in emerging and temporary power applications.
Source: Secondary Research, Interviews with Experts, MarketsandMarkets Analysis
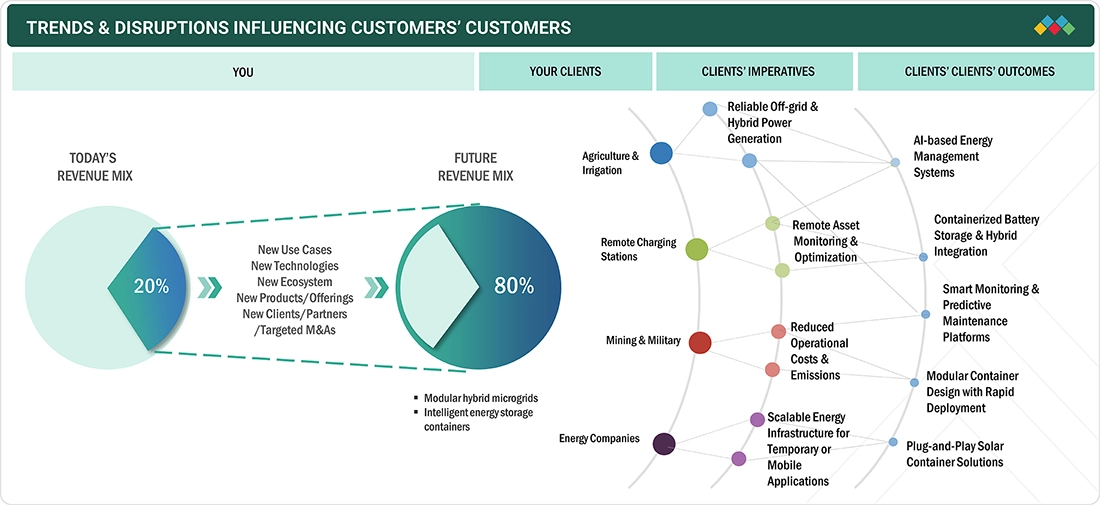
TRENDS & DISRUPTIONS IMPACTING CUSTOMERS' CUSTOMERS
The impact on the solar container market trends arises from evolving customer needs and technological disruptions. Over the next 4–5 years, companies’ revenue mix will shift from traditional off-grid solar systems to smart, modular, and hybrid containerized solutions. Two key trends are driving this transition: the integration of AI-powered energy management and monitoring systems for optimized performance, and the advancement of hybrid solar-storage technologies, enabling scalable, plug-and-play renewable energy solutions across construction, mining, defense, and rural electrification applications.
Source: Secondary Research, Interviews with Experts, MarketsandMarkets Analysis
SOLAR CONTAINER MARKET DYNAMICS
Level
-
Increasing demand for renewable energy sources and sustainable energy solutions

-
Advancements in battery storage and solar technology

Level
-
High initial investment costs of solar containers

Level
-
Integration with smart energy management systems

-
Growing demand from EV sector

Level
-
Unstable power supply and battery limitations

-
Durability and maintenance in extreme environments

Source: Secondary Research, Interviews with Experts, MarketsandMarkets Analysis
Driver: Increasing demand for renewable energy sources and sustainable energy solutions
The increasing demand for renewable energy sources and sustainable power solutions is a key driver of the solar container market. As governments, businesses, and communities prioritize carbon reduction and energy security, a growing shift is underway toward cleaner energy alternatives. Solar containers offer a portable, off-grid power solution, making them ideal for remote areas, disaster relief efforts, and military operations. Their integrated design, which combines solar panels, battery storage, and energy management systems, provides a cost-effective and environmentally friendly alternative to diesel generators. Advancements in battery storage and solar panel efficiency have further enhanced the reliability of these solutions, making them more viable for a wide range of applications.
Restraint: High initial investment costs of solar containers
The high initial investment cost of solar containers remains a significant challenge in the market. These containerized solar solutions are crucial for off-grid and portable energy generation, but their adoption requires substantial upfront capital. The costs include high-efficiency solar panels, advanced battery storage systems, inverters, and power management technology, all integrated into a durable container. Additionally, installation, logistics, and site preparation expenses add to the total investment, making it a considerable financial burden, particularly for small and medium enterprises (SMEs), rural communities, and humanitarian organizations.
Opportunity: Integration with smart energy management systems
Integrating smart energy management systems into solar containers presents a significant opportunity in the renewable energy sector, enhancing efficiency, reliability, and user control. These systems utilize advanced technologies, including artificial intelligence (AI), the Internet of Things (IoT), and real-time data analytics, to optimize energy production, storage, and consumption within solar container setups. By intelligently managing energy flows, they ensure optimal performance, reduce operational costs, and extend the equipment's lifespan. In January 2025, SolarEdge launched an AI-based energy management system designed to optimize residential solar energy usage, marking a significant trend in product innovation.
Challenge: Unstable power supply and battery limitations
A key challenge in the solar container market is the unstable power supply and battery limitations, which affect system efficiency and reliability. Since solar containers rely on sunlight, energy production fluctuates due to changes in weather, seasonal variations, and nighttime energy demands. This creates a gap between power generation and consumption, making battery storage a crucial necessity. However, batteries face several challenges, including limited capacity, high costs, gradual degradation, and slow charging speeds, which impact their overall performance.
Solar Container Market: COMMERCIAL USE CASES ACROSS INDUSTRIES
| COMPANY | USE CASE DESCRIPTION | BENEFITS |
|---|---|---|
 |
Develops modular solar container systems integrating PV panels, battery storage, and inverters for off-grid and hybrid energy supply in construction, mining, and emergency applications | Scalable and portable renewable systems | Rapid deployment | Reliable power for remote or temporary sites | High durability under extreme climates |
 |
Designs autonomous plug-and-play solar containers and solar trailers with hybrid power capabilities (PV + storage + diesel backup) for humanitarian aid, defense, and off-grid communities | Complete off-grid energy solution | Easy transport and setup | Fuel cost reduction | Sustainable operations for mobile users |
 |
Provides containerized solar and hybrid power units for telecom, healthcare, and industrial customers, integrating smart monitoring systems and cloud-based energy management | Remote performance monitoring | Reduced OPEX via hybrid optimization | Reliable telecom and site backup power | Seamless scalability |
 |
Manufactures prefabricated solar + battery containers with advanced control software for microgrids and emergency backup power. Focus on disaster relief, rural electrification, and critical infrastructure | Quick installation (within hours) | Grid independence | Automated power balancing | High resilience in extreme events |
 |
Specializes in customizable solar containers built for energy storage, EV charging, and mobile power applications, combining modular steel construction with integrated PV and inverter systems | Customizable configurations | Modular scalability | Dual-use design (power + shelter) | Suitable for temporary and permanent installations |
Logos and trademarks shown above are the property of their respective owners. Their use here is for informational and illustrative purposes only.
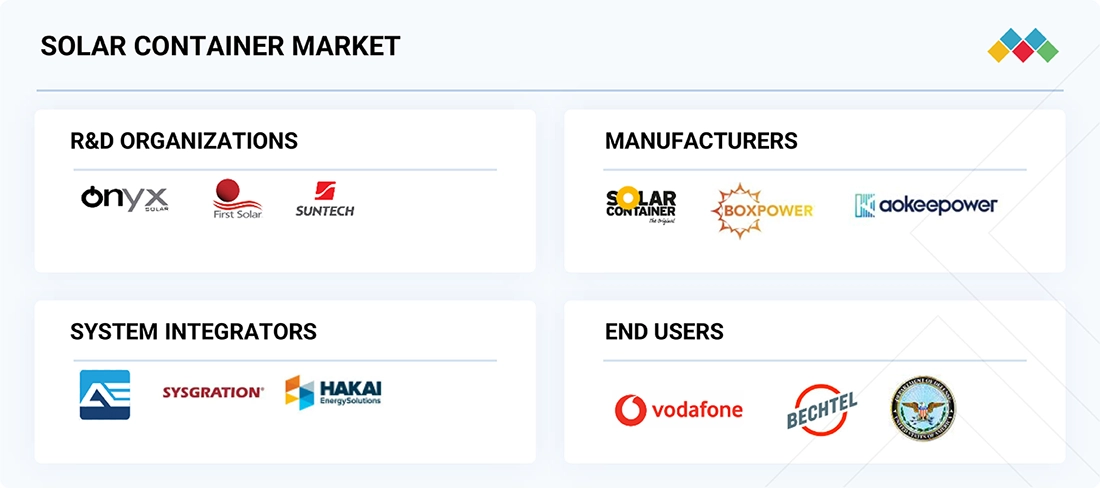
SOLAR CONTAINER MARKET ECOSYSTEM
The solar container companies ecosystem involves identifying and analyzing interconnected relationships among various stakeholders, manufacturers, distributors, system integrators, and end users. These stakeholders collaborate to deliver modular, containerized solar power solutions that ensure reliable, off-grid, and sustainable energy generation across various applications, including telecom, construction, defense, and rural electrification. Manufacturers such as SolarContainer, BoxPower, and Aokeepower develop complete, containerized systems that integrate solar PV panels, battery storage, charge controllers, and hybrid inverters. System Integrators, including Sysgration and Hakai Energy Solutions, play a critical role in combining hardware and digital intelligence by integrating AI-based energy management systems, IoT-enabled monitoring platforms, and hybrid control software. Distributors such as Atlas Copco, A1SolarStore, and Menlo Electric ensure the effective supply and installation of containerized solar units worldwide. End users include organizations such as Vodafone, Bechtel, and the US Department of Defense, which deploys solar containers to power telecommunication sites, construction projects, field operations, and defense installations.
Logos and trademarks shown above are the property of their respective owners. Their use here is for informational and illustrative purposes only.
SOLAR CONTAINER MARKET SEGMENTS
Source: Secondary Research, Interviews with Experts, MarketsandMarkets Analysis
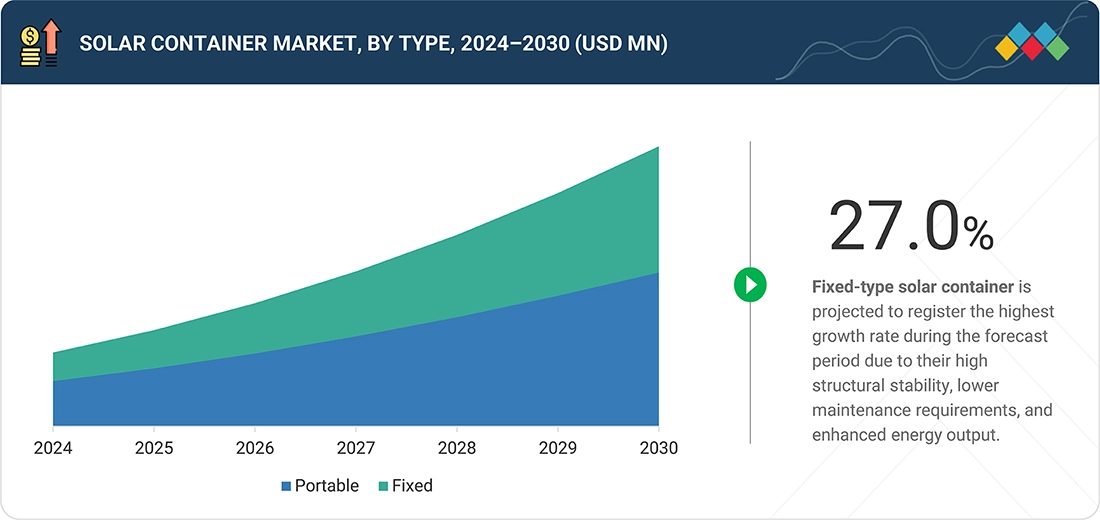
Solar Container Market, by Type
Portable solar containers hold the largest market share due to their mobility, rapid deployment, and versatility across various applications, including disaster relief, construction sites, mining, and military operations. Their plug-and-play design, ease of transport, and ability to provide instant, clean, and off-grid power make them highly preferred globally.
Solar Container Market, by Component
Solar panels hold the largest market share in the solar container market as they are the primary power-generating component, directly responsible for converting sunlight into electricity. Continuous advancements in PV efficiency, durability, and cost reduction, along with growing deployment of high-output panels in hybrid and off-grid systems, drive their dominant market position.
Solar Container Market, by Power Capacity
The 10–50 kW segment dominates the solar container market as it offers optimal scalability and versatility, meeting power needs for construction sites, telecom towers, rural communities, and small industrial operations. Its balance of portability, efficiency, and affordability makes it the preferred choice for off-grid, hybrid, and remote applications across developing and emerging markets.
Solar Container Market, by Installation Type
Off-grid solar containers hold the largest market share as they provide independent, reliable, and portable power solutions in regions lacking grid connectivity. Their adoption is driven by rural electrification projects, disaster relief operations, mining, and remote construction activities, where self-sustained renewable systems offer a cost-effective and eco-friendly alternative to diesel generators and grid extensions.
Solar Container Market, by Application
Agriculture and irrigation hold the largest market share as solar containers provide a reliable, off-grid power source for water pumping, drip irrigation, and cold storage in remote farmlands. Their low operating cost, easy deployment, and independence from grid fluctuations make them ideal for boosting farm productivity and sustainable agricultural operations.
SOLAR CONTAINER MARKET BY REGION
Asia Pacific is expected to be fastest-growing segment in the solar container market during the forecast period
The Asia Pacific region is expected to witness the highest CAGR due to rising renewable energy investments, rapid rural electrification programs, and government incentives in countries like India, China, and Indonesia. Increasing demand for off-grid and hybrid power solutions in remote communities and construction projects further accelerates solar container adoption across the region.
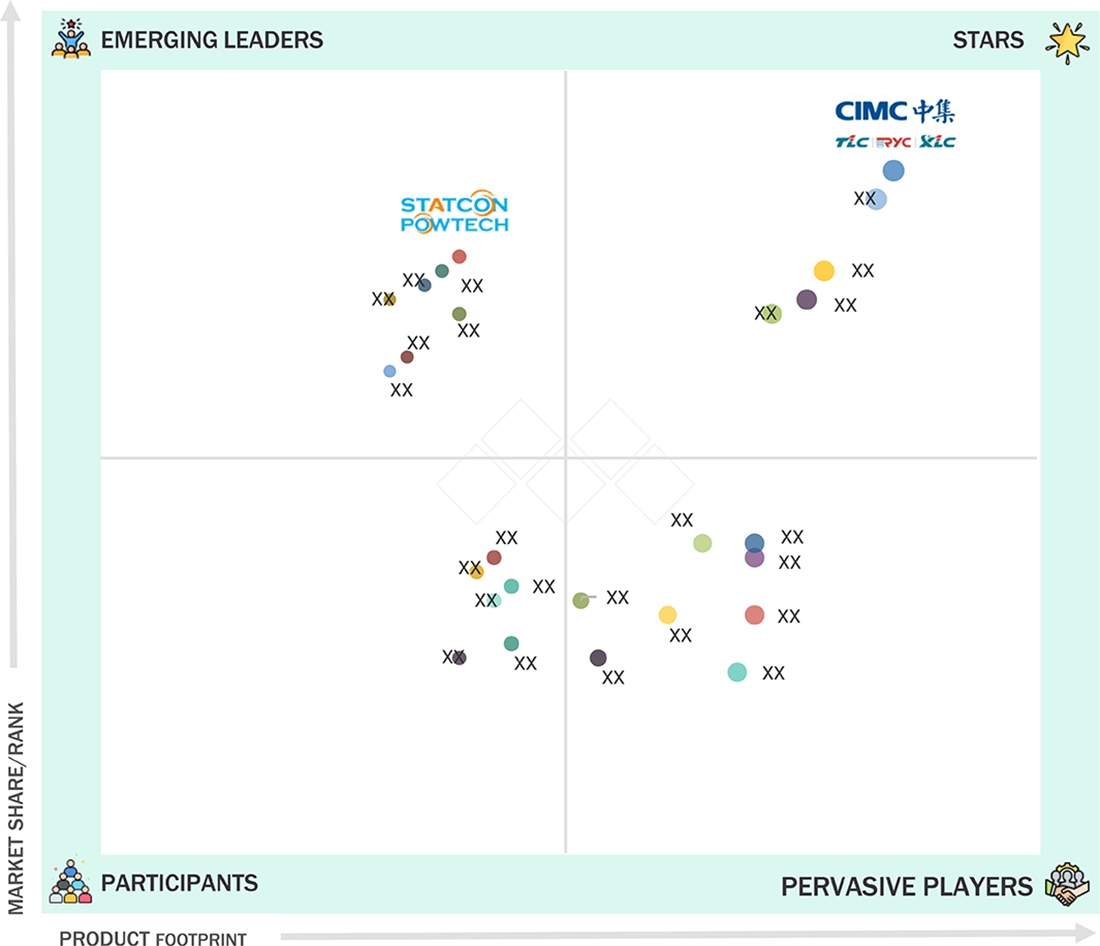
Solar Container Market: COMPANY EVALUATION MATRIX
In the solar container market growth matrix, Yangzhou CIMC New Energy Equipment Co., Ltd. (Star) leads with a strong market presence and a diverse portfolio of containerized solar and hybrid energy solutions, enabling reliable off-grid power across construction, mining, and disaster relief applications. Statcon Powtech (Emerging Leader) is gaining momentum with innovative hybrid solar container systems integrated with advanced power electronics and battery management technologies, positioning itself as a key contender in scalable, modular renewable energy deployments.
Source: Secondary Research, Interviews with Experts, MarketsandMarkets Analysis
KEY MARKET PLAYERS
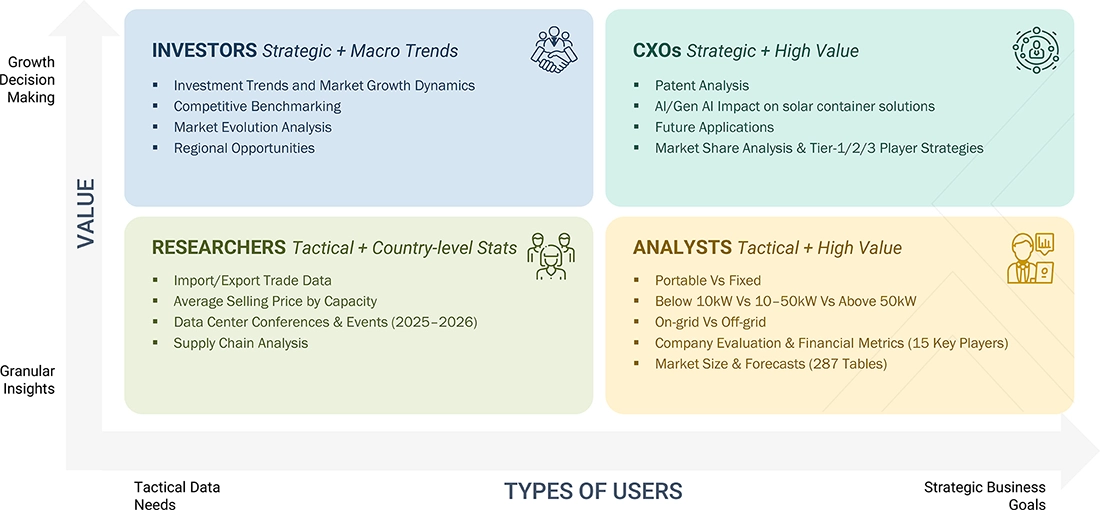
WHAT IS IN IT FOR YOU: Solar Container Market REPORT CONTENT GUIDE
DELIVERED CUSTOMIZATIONS
We have successfully delivered the following deep-dive customizations:
| CLIENT REQUEST | CUSTOMIZATION DELIVERED | VALUE ADDS |
|---|---|---|
| Solar Container Manufacturer/OEM |
|
|
| System Integrator/EPC Contractor |
|
|
| Government/Energy Agency |
|
|
| Industrial End User |
|
|
RECENT DEVELOPMENTS IN SOLAR CONTAINER MARKET
- November 2024 : Wilmot Modular Structures, Inc. inaugurated its new 33,000-square-foot, two-story corporate campus, reflecting its dedication to innovation, quality, and sustainability.
- May 2024 : Statcon Energiaa launched the Energiaa-X Series, a single-phase grid-tie solar inverter designed for residential and small commercial applications.
- October 2023 : Hacon Containers unveiled the Hacon Solar Container as a plug-and-play container integrating solar panels into its structure, designed to deliver clean and stackable energy solutions with minimal setup.
- October 2022 : Statcon Energiaa introduced a plug-and-play outdoor inverter solution designed for microgrids, capable of integrating various energy sources such as solar, biomass, wind, hydro, battery storage, and diesel generators.
Table of Contents
 Exclusive indicates content/data unique to MarketsandMarkets and not available with any competitors.
Methodology
This research study involved four major activities in estimating the solar container market size. Exhaustive secondary research was carried out to collect important information about the market and peer markets. The next step involved validating these findings and assumptions and sizing them with the help of primary research with industry experts across the value chain. Both top-down and bottom-up approaches were used to estimate the market size. The market breakdown and data triangulation procedures were adopted to estimate the market sizes of segments and sub-segments.
Secondary Research
Various secondary sources were referred to in the secondary research process to identify and collect information required for this study. These sources included annual reports, press releases, investor presentations of companies, white papers, and articles from recognized authors. Secondary research was mainly conducted to obtain key information about the market’s value chain, the pool of key market players, market segmentation according to industry trends, regional outlook, and developments from both market and technology perspectives.
Primary Research
In primary research, various sources from both the supply and demand sides were interviewed to obtain the qualitative and quantitative insights required for this report. Primary sources from the supply side included experts such as CEOs, vice presidents, marketing directors, manufacturers, technology and innovation directors, end users, and related executives from multiple key companies and organizations operating in the solar container market ecosystem. After interacting with industry experts, brief sessions were conducted with highly experienced independent consultants to reinforce the findings from primary research. This, along with the in-house subject matter experts’ opinions, led to the findings as described in the report. The breakdown of primary respondents is as follows:

Note: Other designations include sales, marketing, and product managers
To know about the assumptions considered for the study, download the pdf brochure
Market Size Estimation
In the market engineering process, both top-down and bottom-up approaches and data triangulation methods were used to estimate and validate the size of the solar container market and other dependent submarkets. The research methodology used to estimate the market sizes included the following:
The bottom-up procedure was employed to arrive at the overall size of the solar container market.
- Major companies that provide solar containers were identified. This included analyzing company portfolios, product offerings, and presence across various regions.
- The segment-specific revenues of the companies, particularly those related to solar containers, were determined.
- The product-specific revenues of the companies, particularly those related to solar containers, were determined.
- These individual revenue figures were compiled to determine the total revenue generated across the identified companies within the sector.
- The global market size for solar containers was obtained using this consolidated data.
The top-down approach was used to estimate and validate the total size of the solar container market.
- Identified top-line investments and spending in the ecosystem and major market developments to consider segment-level splits
- Estimated the overall solar container market size, then segmented the global market by allocating shares based on the segments considered
- Distributed the segment-level markets into regions and countries by aligning regional solar container activity with economic indicators, solar container manufacturing presence, and national development initiatives
Solar Container Market : Top-Down and Bottom-Up Approach

Data Triangulation
After arriving at the overall market size using the market size estimation processes as explained above, the market was split into several segments and subsegments. Data triangulation and market breakdown procedures were employed to complete the entire market engineering process and arrive at the exact statistics of each market segment and subsegment. The data was triangulated by studying various factors and trends from the demand and supply sides of the solar container market.
Market Definition
The solar container market focuses on the development and deployment of containerized solar power systems designed to deliver portable, scalable, and sustainable energy solutions. These systems integrate solar technology within modular containers, enabling a reliable electricity supply across diverse applications and remote locations. Solar containers combine photovoltaic panels, battery storage, inverters, and intelligent control systems within a modular containerized unit, enabling rapid installation and reliable off-grid power generation. These systems are essential for addressing energy access challenges in remote areas, supporting disaster relief operations, and delivering clean electricity for defense and construction. Key components of solar containers include solar PV modules, hybrid energy systems, advanced battery management, and IoT-enabled monitoring platforms. These technologies are integrated to ensure efficient energy generation, storage, and distribution while enabling real-time performance tracking and optimization. The adoption of solar containers is driven by the rising global demand for decentralized renewable energy, government initiatives promoting clean power, and the need for emission-free and portable energy systems. With the increasing integration of smart technologies, declining costs of solar panels and storage, and expanding rural electrification efforts, solar containers are evolving to support hybrid energy applications, sustainable infrastructure development, and climate-resilient power solutions. Solar containers play a vital role in bridging the energy gap, enhancing resilience in emergencies, reducing carbon emissions, and supporting the transition toward a sustainable and decentralized energy future.
Key Stakeholders
- Solar container manufacturers
- Solar PV panel and battery suppliers
- Energy storage solution providers
- Inverter and power electronics manufacturers
- Hybrid system integrators
- Distributors
- Government and regulatory bodies
- Research and development institutions
Report Objectives
- To define, describe, segment, and forecast the solar container market size by component, type, installation type, power capacity, application, and region, in terms of value
- To assess the solar container market size in four key regions: North America, Europe, Asia Pacific, and the Rest of the World, in terms of value
- To provide detailed information regarding the key factors such as drivers, restraints, opportunities, and challenges influencing the growth of the market
- To analyze the solar container value chain and ecosystem, along with the average selling price by component and region
- To strategically study the regulatory landscape, tariffs, standards, patents, Porter’s Five Forces, import & export scenarios, trade values, and case studies pertaining to the market under study
- To understand micromarkets with regard to individual growth trends, prospects, and contributions to the overall market
- To assess opportunities in the market for stakeholders by identifying high-growth segments
- To analyze the impact of AI/Gen AI on the solar container market
- To outline the macroeconomic outlook for the regions under study
- To analyze strategies such as product launches, collaborations, acquisitions, and partnerships adopted by players in the solar container market
- To profile key market players and comprehensively analyze their ranking based on their revenue, market share, and core competencies
Customization Options:
With the given market data, MarketsandMarkets offers customizations according to the specific requirements of companies. The following customization options are available for the report:
Country-wise Information:
- Country-wise breakdown for North America, Europe, Asia Pacific, and the Rest of the World
Company Information:
- Detailed analysis and profiling of additional market players (up to five)
Key Questions Addressed by the Report
What is the size of the Solar Container Market?
The global Solar Container Market is estimated at USD 0.29 billion in 2025 and is projected to USD 0.83 billion by 2030.
What is the expected growth rate of the Solar Container Market?
The market is expected to grow at a CAGR of 23.8% from 2025 to 2030, driven by rising demand for portable renewable energy solutions.
What are the major growth drivers of the Solar Container Market?
Key growth drivers include increasing renewable energy adoption, demand for off-grid power solutions, advancements in battery storage, government clean energy initiatives, and the need to reduce reliance on diesel generators.
Why are solar containers gaining popularity in remote locations?
Solar containers provide portable, self-contained power generation and storage systems, making them ideal for remote communities, mining operations, construction sites, military bases, and disaster relief efforts.
What are the key trends shaping the Solar Container Market?
Major trends include integration of advanced battery storage systems, smart energy management technologies, modular solar solutions, hybrid renewable systems, and rapid deployment capabilities.
Which industries are the primary users of solar containers?
Solar containers are widely used in energy, mining, construction, telecommunications, defense, humanitarian aid, and remote infrastructure projects.
Which companies are key players in the Solar Container Market?
Major companies include BoxPower Inc., SolarCont GmbH, Mobil-Grid GmbH, SunBOX, Renewable Energy Systems (RES), and HCI Energy.
What are the main advantages of solar containers over conventional generators?
Solar containers offer lower operating costs, reduced carbon emissions, minimal fuel dependency, quieter operation, and improved energy security compared to diesel generators.
Which region is expected to lead the Solar Container Market?
Europe is expected to hold a significant market share due to strong renewable energy policies, while Asia Pacific and Africa are witnessing growing demand for off-grid and rural electrification solutions.
What does the Solar Container Market report analyze?
The report analyzes market size, growth forecasts, technology trends, applications, deployment models, competitive landscape, regional opportunities, growth drivers, challenges, and future market outlook through 2029.
Need a Tailored Report?
Customize this report to your needs
Get 10% FREE Customization
Customize This ReportPersonalize This Research
- Triangulate with your Own Data
- Get Data as per your Format and Definition
- Gain a Deeper Dive on a Specific Application, Geography, Customer or Competitor
- Any level of Personalization
Let Us Help You
- What are the Known and Unknown Adjacencies Impacting the Solar Container Market
- What will your New Revenue Sources be?
- Who will be your Top Customer; what will make them switch?
- Defend your Market Share or Win Competitors
- Get a Scorecard for Target Partners

Custom Market Research Services
We Will Customise The Research For You, In Case The Report Listed Above Does Not Meet With Your Requirements
Get 10% Free CustomisationTESTIMONIALS

Tetsuya Ohhira
Business Development Manager-Technology Business
Nikon Corporation,
Leading Japanese MNC specializing in optics and imaging productswww.nikon.com
MarketsandMarkets™ response
is quick. Their attitude is flexible and positive. Analyst Insights are globally considered and
significant. Client Services quickly respond to our inquiry and demand. Their wide range of global
surveys help us make our strategic plan.
We hope Knowledge Store will be easier to search
for a report.
VP - Marketing & Business Development
Leading Provider of Process Control Solutions
We engaged with MarketsandMarkets on a study to perform an analysis and recommend a Go-To-Market strategy for metrology and process control in the semiconductor market. The study was tailored to our targets and needs with well-defined milestones. Our overall experience with the MarketsandMarkets team was very good throughout the project in all aspects including the analysis methodologies used, the quality and depth of primary and secondary data sets, the professionalism and flexibility of the team and the ability to meet the target schedule and milestones. We want to thank MarketsandMarkets team for a job well done.
Growth opportunities and latent adjacency in Solar Container Market


Francis
Apr, 2026
Is the solar container market at a stage where investments today can deliver near-term revenue generation, or is it still dependent on long-term adoption cycle.
Gary
Apr, 2026
Which component segment (solar panels, batteries, or energy management systems) captures the highest margins and value creation.
Jason
Apr, 2026
Is the solar container market at a stage where investments today can deliver near-term revenue generation, or is it still dependent on long-term adoption cycles?.