Spinal Implants Market

Spinal Implants Market by Product (Devices (Thoracic, Cervical, Interbody Fusion, Spinal Non-Fusion), Biologics, Stimulators), Application (VCF, Spinal Decompression, Fusion, Non-Fusion), Surgery (Open, MIS), Region & Customer Unmet Need Forecast to 2028

Report Code: MD 1173 Jan, 2024, by marketsandmarkets.com

The global spinal implants market in terms of revenue was estimated to be worth $11.2 Billion in 2023 and is poised to reach $14.3 Billion by 2028, growing at a CAGR of 5.0% from 2023 to 2028. The new research study consists of an industry trend analysis of the market. The new research study consists of industry trends, pricing analysis, patent analysis, conference and webinar materials, key stakeholders, and buying behaviour in the market. An increase in spinal disorders and the aging population, increasing research & funding initiatives from organizations, and worldwide advancement in spine surgical procedures are a few drivers that collectively contribute to the growth of the market, and as healthcare technologies continue to evolve, the demand for minimally invasive spine surgical procedure is expected to rise further in the upcoming years. However, challenges for regulatory issues, high cost limits the market growth.

Attractive Opportunities in the Spinal Implants Market

Spinal Implants Market

To know about the assumptions considered for the study, Request for Free Sample Report

Spinal Implants Market

Spinal Implants Market: Market Dynamics

Driver: Increase in prevalence of spinal disorder

The escalating prevalence of spinal disorder stands as a significant driving force in the market. This trend underscores a growing demand for advanced surgical procedures, compelling the healthcare industry to invest in innovative spine surgical technologies. Advancing age is associated with an increased risk of degenerative spinal conditions. As people live longer, the prevalence of age-related spinal disorders, such as degenerative disc disease and spinal stenosis, is on the rise. This demand, fueled by the rising incidence of spinal disorder, is reshaping the landscape of spinal implants and driving advancements in the sector.

Restraint: Issues related to high cost of procedures

The elevated costs associated with spinal implant procedures impose a considerable financial strain on patients, even those covered by insurance. This often results in deferred or altogether avoided treatments. Effectively addressing the constraint of high procedural costs in the spinal implant domain necessitates a comprehensive approach involving collaboration among healthcare providers, payers, manufacturers, and policymakers. This collaborative effort aims to guarantee the accessibility and affordability of innovative treatments for patients. Strategic initiatives such as enhancing transparency, fostering competition, and exploring value-based care models are pivotal in alleviating the adverse effects of this constraint.

Opportunity: Emerging markets offering growth opportunities

Emerging markets are evolving into pivotal growth hubs for the spinal implants industry. A myriad of factors contribute to the expansion opportunities within these markets, encompassing heightened healthcare consciousness, enhanced healthcare infrastructure, escalating disposable incomes, and a burgeoning aging demographic. Rapidly growing economies like India and China present substantial growth prospects in the field of spinal implants due to the expanding patient base caused by the rising prevalence of spinal disorder with aging population in these nations.

Challenge: Lack of adequate physicians and limited awareness

Physicians' limited awareness of recent advancements in spinal implant technologies, especially in minimally invasive procedures for spine surgical procedures, coupled with a scarcity of training opportunities in certain regions, poses challenges. Additionally, patients often lack awareness of spinal implant options and their benefits. To address these issues, initiatives such as continuous medical education for physicians, public awareness campaigns, and improved access to specialized care are crucial. These efforts aim to bridge knowledge gaps, empower physicians with up-to-date skills, and inform patients, ultimately promoting the effective use of spinal implant technologies for improved patient outcomes.

Spinal Implants Market Ecosystem:

Major companies in this market include well-established and financially stable suppliers of spinal implants. Prominent companies in spinal implants market include Medtronic plc (Ireland), Johnson & Johnson (Depuy Synthes) (US), Stryker corporation (US), NuVasive (US), Globus Medical Inc. (US), Zimmer Biomet holdings (Warsaw), RTI Surgical Inc. (US), Spineart (Switzerland) among several others.

Spinal Implants Market Ecosystem

Non- fusion devices segment of spinal implants industry to register significant growth rate over the forecast period of 2022-2028.

Based on the product, the spinal implants market is segmented into Thoracic Fusion & Lumbar Fusion Devices, Spinal Decompression Devices, Non-Fusion Devices, Cervical Fusion Devices, Spine Biologics, Vertebral Compression Fracture Treatment Devices, and Spine Bone Stimulators. Non-Fusion Devices segment to register a significant growth rate over the forecast period of 2022-2028. The expansion of the market for spinal implants’ non-fusion devices can be credited to the availability of diverse spinal implants stimulators, driven by the global prevalence of spinal disorder and the growing elderly demographic. Non-fusion procedures typically entail minimal disturbance to adjacent tissues, potentially leading to expedited recovery periods when contrasted with conventional fusion surgeries. This aspect holds particular appeal for patients desiring swifter rehabilitation timelines. Furthermore, the market's growth is further bolstered by the introduction of advance spinal surgery technologies by industry players.

Spinal fusion and fixation segment of spinal implants industry is the largest application segment in 2022.

Spinal fusion & fixation stands as the Fusion procedures, designed to achieve spinal stabilization, are increasingly underscored by a heightened focus on preserving spinal motion, particularly within the lumbar region. This emphasis has spurred the innovation and acceptance of dynamic stabilization systems and non-fusion technologies, consequently propelling the demand for specialized types of spinal implants. Additionally, Spinal fusion and fixation procedures, with the aid of advanced implants, aim to provide stability and relieve pain, aligning with patient expectations. These factors are expected to drive the growth of this segment in the forthcoming years.

Asia-Pacific is expected to be the highest CAGR during the forecast period.

The spinal implants market is divided into key regions: North America, Europe, Asia Pacific, Latin America, and the Middle East & Africa. In 2022, North America held the largest market share in the global market. However, the Asia Pacific region is anticipated to exhibit the highest Compound Annual Growth Rate (CAGR) during the forecast period. This growth is primarily attributed to the demographic shift with a rapidly aging population, a rise in healthcare budgets and investing in healthcare infrastructure. This includes advancements in surgical techniques and the adoption of advanced spinal implants. Additionally, the market in the Asia Pacific region is set to receive a boost from the growing number of local manufacturers offering spinal implants products and the increasing establishment of healthcare facilities for spinal surgeries with implants in the area.

Spinal Implants Market by Region

To know about the assumptions considered for the study, download the pdf brochure

As of 2022, prominent players in spinal implants market are Medtronic plc (Ireland), Johnson & Johnson (Depuy Synthes) (US), Stryker corporation (US), NuVasive (US), Globus Medical Inc. (US), Zimmer Biomet holdings (Warsaw), RTI Surgical Inc. (US), Spineart (Switzerland), Boston Scientific Corporation (US), Abbott Laboratories (US) among several others.

Scope of the Spinal Implants Industry:

Report Metric

Details

Market Revenue in 2023

$11.2 Billion

Projected Revenue by 2028

$14.3 Billion

Revenue Rate

Poised to Grow at a CAGR of 5.0%

Market Driver

Increase in prevalence of spinal disorder

Market Opportunity

Emerging markets offering growth opportunities

This report has segmented the global spinal implants market to forecast revenue and analyze trends in each of the following submarkets:

By Product Type

  • THORACIC FUSION & LUMBAR FUSION DEVICES
    • Posterior Thoracic Fusion And Lumbar Fusion Devices
    • Interbody Thoracic Fusion And Lumbar Fusion Devices
      • Anterior lumbar interbody fusion devices
      • Posterior lumbar interbody fusion devices
      • Transforaminal lumbar interbody fusion devices
      • Axial lumbar interbody fusion devices
      • Non-Bone interbody fusion devices
      • Bone Interbody Fusion Devices
    • Anterior Thoracic Fusion And Lumbar Fusion Devices
  • CERVICAL FUSION DEVICES
    • Anterior Cervical Fusion Devices
      • Anterior cervical plates
      • Anterior cervical screw systems
      • Cervical interbody fusion devices
    • Posterior Cervical Fusion Devices
      • Posterior cervical plates
      • Posterior cervical screws
      • Posterior cervical rods
  • VERTEBRAL COMPRESSION FRACTURE TREATMENT DEVICES
    • Balloon Kyphoplasty Devices
    • Vertebroplasty Devices
  • SPINE BIOLOGICS
    • Demineralized Bone Matrix
    • Bone Morphogenetic Proteins
    • Bone Substitutes
    • Machined Bones
    • Cell-Based Matrices
    • Allograft Bone
  • SPINAL DECOMPRESSION DEVICES
    • Discectomy
    • Laminoplasty, Laminectomy, And Laminotomy
    • Foraminotomy & Foraminectomy
    • Facetectomy
    • Corpectomy
  • NON-FUSION DEVICES
    • Dynamic Stabilization Devices
      • Interspinous process spacers
      • Pedicle screw-based dynamic rod devices
      • Facet replacement products
    • Dynamic Stabilization Devices
      • Artificial cervical discs
      • Artificial lumbar discs
    • Annulus Repair Devices
    • Nuclear Disc Prostheses
  • SPINE BONE STIMULATORS
    • Noninvasive Spine Bone Stimulators
      • Pulsed electromagnetic field devices
      • Capacitive coupling (CC) and combined (electro) magnetic field (CMF) devices.
      • Invasive spine bone stimulators

By application

  • Spinal Fusion and Fixation
  • Vertebral Compression Fracture Treatment
  • Motion Preservation/Non-fusion
  • Spinal Decompression

By type of surgery

  • Open Surgeries
  • Minimally Invasive Surgeries

By End User

  • Hospitals
  • Orthopedic centers

By Region

  • North America
    • US
    • Canada
  • Europe
    • Germany
    • France
    • UK
    • Italy
    • Spain
    • Rest of Europe
  • Asia Pacific
    • Japan
    • China
    • India
    • Australia
    • South Korea
    • Rest of Asia Pacific
  • Latin America
    • Brazil
    • Mexico
    • MEA

Recent Developments of Spinal Implants Industry:

  • In 2023, Medtronic receives CE Mark approval for Inceptiv spinal cord stimulator with closed-loop sensing to treat chronic pain.
  • In 2022, Medtronic launched Mazic M Spinal Fixation System which offers minimally invasive options for thoracic and lumbar spine stabilization.
  • In 2022, Depuy Synthes launched Summit LTX Plus Interbody System which expands their portfolio of interbody spacers for lumbar fusion with enhanced design features.

Frequently Asked Questions (FAQ):

To speak to our analyst for a discussion on the above findings, click Speak to Analyst

TABLE OF CONTENTS
 
1 INTRODUCTION (Page No. - 45)
    1.1 STUDY OBJECTIVES 
    1.2 MARKET DEFINITION 
           1.2.1 INCLUSIONS AND EXCLUSIONS
    1.3 MARKET SCOPE 
           1.3.1 MARKETS COVERED
           1.3.2 REGIONS COVERED
           1.3.3 YEARS CONSIDERED
    1.4 CURRENCY CONSIDERED 
    1.5 MARKET STAKEHOLDERS 
    1.6 SUMMARY OF CHANGES 
           1.6.1 RECESSION IMPACT
 
2 RESEARCH METHODOLOGY (Page No. - 49)
    2.1 RESEARCH DATA 
    2.2 RESEARCH DESIGN 
           2.2.1 SECONDARY RESEARCH
                    2.2.1.1 Key data from secondary sources
           2.2.2 PRIMARY RESEARCH
                    2.2.2.1 Primary sources
                    2.2.2.2 Key industry insights
                    2.2.2.3 Breakdown of primaries
                                FIGURE 1 BREAKDOWN OF PRIMARY INTERVIEWS: SUPPLY AND DEMAND-SIDE PARTICIPANTS
                                FIGURE 2 BREAKDOWN OF PRIMARY INTERVIEWS: BY COMPANY TYPE, DESIGNATION,  AND REGION
    2.3 MARKET SIZE ESTIMATION 
          FIGURE 3 RESEARCH METHODOLOGY: HYPOTHESIS BUILDING
           2.3.1 BOTTOM-UP APPROACH
                    2.3.1.1 Approach 1: Company revenue estimation approach
                                FIGURE 4 SPINAL IMPLANTS MARKET SIZE ESTIMATION: APPROACH 1 (COMPANY REVENUE ESTIMATION)
                    2.3.1.2 Approach 2: Customer-based market estimation
                                FIGURE 5 SPINAL IMPLANTS INDUSTRY SIZE ESTIMATION: BOTTOM-UP APPROACH
                    2.3.1.3 Approach 3: Top-down approach
                    2.3.1.4 Approach 4: Primary interviews
                                FIGURE 6 TOP-DOWN APPROACH
    2.4 DATA TRIANGULATION AND MARKET BREAKDOWN 
          FIGURE 7 DATA TRIANGULATION METHODOLOGY
    2.5 MARKET SHARE ASSESSMENT 
    2.6 STUDY ASSUMPTIONS 
    2.7 RISK ASSESSMENT 
          TABLE 1 ASSOCIATED RISKS
    2.8 RESEARCH LIMITATIONS 
    2.9 GROWTH RATE ASSUMPTIONS 
    2.10 RECESSION IMPACT 
 
3 EXECUTIVE SUMMARY (Page No. - 62)
    FIGURE 8 SPINAL IMPLANTS MARKET, BY TYPE OF SURGERY,  2023 VS. 2028 (USD MILLION)
    FIGURE 9 SPINAL IMPLANTS INDUSTRY, BY PRODUCT, 2023 VS. 2028 (USD MILLION)
    FIGURE 10 SPINAL IMPLANTS INDUSTRY, BY APPLICATION, 2023 VS. 2028 (USD MILLION)
    FIGURE 11 SPINAL IMPLANTS INDUSTRY, BY END USER, 2023 VS. 2028 (USD MILLION)
    FIGURE 12 SPINAL IMPLANTS INDUSTRY: GEOGRAPHICAL SNAPSHOT
 
4 PREMIUM INSIGHTS (Page No. - 66)
    4.1 SPINAL IMPLANTS MARKET OVERVIEW 
          FIGURE 13 INCREASING INCIDENCE OF SPINAL DISORDERS TO DRIVE MARKET
    4.2 SPINAL IMPLANTS INDUSTRY: REGIONAL LANDSCAPE,  2023 VS. 2028 (USD MILLION) 
          FIGURE 14 NORTH AMERICA TO RETAIN LARGEST MARKET SHARE
    4.3 NORTH AMERICA: MARKET,  BY COUNTRY AND END USER, 2022 (USD MILLION) 
          FIGURE 15 US AND HOSPITALS HELD LARGEST MARKET SHARES IN 2022
    4.4 SPINAL IMPLANTS INDUSTRY: GEOGRAPHIC GROWTH OPPORTUNITIES 
          FIGURE 16 CHINA TO REGISTER HIGHEST CAGR OVER FORECAST PERIOD
 
5 MARKET OVERVIEW (Page No. - 68)
    5.1 INTRODUCTION 
          FIGURE 17 SPINAL IMPLANTS MARKET: DRIVERS, RESTRAINTS, OPPORTUNITIES,  AND CHALLENGES
           5.1.1 DRIVERS
                    5.1.1.1 Innovation in spine surgery technologies
                    5.1.1.2 Increasing incidence of spinal disorders
                    5.1.1.3 Launch of advanced bone graft products
                    5.1.1.4 Increasing demand for MIS procedures
                    5.1.1.5 Growing funding and support for research
                                TABLE 2 RECENT FUNDING FOR R&D IN SPINAL IMPLANTS
           5.1.2 RESTRAINTS
                    5.1.2.1 High procedural costs
                    5.1.2.2 Unfavorable regulatory processes and limited reimbursement
           5.1.3 OPPORTUNITIES
                    5.1.3.1 Rising number of hospitals and surgical centers
                    5.1.3.2 Emerging markets
           5.1.4 CHALLENGES
                    5.1.4.1 Lack of personnel and limited awareness & education for MIS
    5.2 PORTER’S FIVE FORCES ANALYSIS 
          TABLE 3 SPINAL IMPLANTS INDUSTRY: PORTER’S FIVE FORCES ANALYSIS
           5.2.1 THREAT OF NEW ENTRANTS
           5.2.2 THREAT OF SUBSTITUTES
           5.2.3 BARGAINING POWER OF SUPPLIERS
           5.2.4 BARGAINING POWER OF BUYERS
           5.2.5 INTENSITY OF COMPETITIVE RIVALRY
    5.3 REGULATORY ANALYSIS 
           5.3.1 REGULATORY BODIES, GOVERNMENT AGENCIES, AND OTHER ORGANIZATIONS
                    TABLE 4 NORTH AMERICA: REGULATORY BODIES, GOVERNMENT AGENCIES, AND OTHER ORGANIZATIONS
                    TABLE 5 EUROPE: REGULATORY BODIES, GOVERNMENT AGENCIES, AND OTHER ORGANIZATIONS
                    TABLE 6 ASIA PACIFIC: REGULATORY BODIES, GOVERNMENT AGENCIES, AND OTHER ORGANIZATIONS
                    TABLE 7 LATIN AMERICA: REGULATORY BODIES, GOVERNMENT AGENCIES, AND OTHER ORGANIZATIONS
                    TABLE 8 MIDDLE EAST & AFRICA: REGULATORY BODIES, GOVERNMENT AGENCIES, AND OTHER ORGANIZATIONS
                    5.3.1.1 Key regulatory guidelines
                               5.3.1.1.1 US
                                               TABLE 9 US FDA: MEDICAL DEVICE REGULATORY APPROVAL PROCESS
                               5.3.1.1.2 Europe
                               5.3.1.1.3 Japan
    5.4 REIMBURSEMENT SCENARIO 
          TABLE 10 REIMBURSEMENT CODES FOR VARIOUS PROCEDURES
    5.5 ECOSYSTEM/MARKET MAP 
    5.6 VALUE CHAIN ANALYSIS 
           5.6.1 RESEARCH & DEVELOPMENT
           5.6.2 PROCUREMENT AND PRODUCT DEVELOPMENT
           5.6.3 MARKETING, SALES AND DISTRIBUTION, AND POST-SALES SERVICES
                    FIGURE 18 MARKET: VALUE CHAIN ANALYSIS
    5.7 SUPPLY CHAIN ANALYSIS 
           5.7.1 PROMINENT COMPANIES
           5.7.2 SMALL & MEDIUM-SIZED COMPANIES
           5.7.3 END USERS
                    FIGURE 19 MARKET: SUPPLY CHAIN ANALYSIS
    5.8 PRICING ANALYSIS 
          FIGURE 20 AVERAGE SELLING PRICE OF SPINAL IMPLANTS, BY PRODUCT (FY 2021-2023)
          FIGURE 21 AVERAGE SELLING PRICE TREND OF SPINAL IMPLANTS (2021-2023),  BY REGION (USD)
    5.9 PATENT ANALYSIS 
          FIGURE 22 PATENT DETAILS FOR SPINAL IMPLANTS (JANUARY 2013–DECEMBER 2023)
    5.10 TRADE ANALYSIS 
           TABLE 11 IMPORT DATA FOR SPINAL IMPLANTS (HS CODE 9021), BY COUNTRY,  2018–2022 (USD THOUSAND)
           TABLE 12 EXPORT DATA FOR SPINAL IMPLANTS (HS CODE 3822), BY COUNTRY,  2018–2022 (USD THOUSAND)
    5.11 KEY CONFERENCES AND EVENTS, 2023–2024 
           TABLE 13 MARKET: DETAILED LIST OF KEY CONFERENCES AND EVENTS  IN 2023–2024
    5.12 TRENDS/DISRUPTIONS IMPACTING CUSTOMERS’ BUSINESSES 
           FIGURE 23 EMERGING TRENDS AND OPPORTUNITIES AFFECTING FUTURE REVENUE MIX
    5.13 KEY STAKEHOLDERS AND BUYING CRITERIA 
           5.13.1 KEY STAKEHOLDERS IN BUYING PROCESS
                     TABLE 14 KEY REQUIREMENTS OF STAKEHOLDERS WHILE BUYING SPINAL IMPLANTS (%)
           5.13.2 KEY STAKEHOLDERS BUYING CRITERIA
                     FIGURE 24 INFLUENCE OF STAKEHOLDERS ON BUYING PROCESS OF SPINAL IMPLANTS
                     TABLE 15 INFLUENCE OF STAKEHOLDERS ON BUYING PROCESS FOR KEY PRODUCT SEGMENTS (%)
    5.14 MARKET: RECESSION IMPACT 
    5.15 UNMET NEEDS AND KEY PAIN POINTS 
           TABLE 16 MARKET: UNMET CUSTOMER NEEDS AND KEY PAIN POINTS
 
6 SPINAL IMPLANTS MARKET, BY PRODUCT (Page No. - 91)
    6.1 INTRODUCTION 
          TABLE 17 SPINAL IMPLANTS INDUSTRY, BY PRODUCT, 2021–2028 (USD MILLION)
    6.2 THORACIC & LUMBAR FUSION DEVICES 
          TABLE 18 THORACIC & LUMBAR FUSION DEVICES MARKET, BY TYPE, 2021–2028 (USD MILLION)
          TABLE 19 THORACIC & LUMBAR FUSION DEVICES MARKET, BY REGION,  2021–2028 (USD MILLION)
           6.2.1 THORACIC & LUMBAR FUSION DEVICES MARKET, BY APPLICATION
                    TABLE 20 THORACIC & LUMBAR FUSION DEVICES MARKET, BY APPLICATION,  2021–2028 (USD MILLION)
           6.2.2 THORACIC & LUMBAR FUSION DEVICES MARKET,  BY TYPE OF SURGERY
                    TABLE 21 THORACIC & LUMBAR FUSION DEVICES MARKET, BY TYPE OF SURGERY,  2021–2028 (USD MILLION)
           6.2.3 POSTERIOR THORACIC & LUMBAR FUSION DEVICES
                    6.2.3.1 Posterior fusion devices to account for largest market share
                                TABLE 22 POSTERIOR THORACIC & LUMBAR FUSION DEVICES MARKET, BY REGION,  2021–2028 (USD MILLION)
           6.2.4 INTERBODY THORACIC & LUMBAR FUSION DEVICES
                                TABLE 23 INTERBODY THORACIC & LUMBAR FUSION DEVICES MARKET, BY REGION,  2021–2028 (USD MILLION)
                    6.2.4.1 Interbody thoracic & lumbar fusion devices market, by approach
                                TABLE 24 INTERBODY THORACIC & LUMBAR FUSION DEVICES MARKET, BY APPROACH,  2021–2028 (USD MILLION)
                               6.2.4.1.1 Anterior lumbar interbody fusion devices
                                              TABLE 25 ANTERIOR LUMBAR INTERBODY FUSION DEVICES MARKET, BY REGION,  2021–2028 (USD MILLION)
                               6.2.4.1.2 Posterior lumbar interbody fusion devices
                                              TABLE 26 POSTERIOR LUMBAR INTERBODY FUSION DEVICES MARKET, BY REGION,  2021–2028 (USD MILLION)
                               6.2.4.1.3 Transforaminal lumbar interbody fusion devices
                                              TABLE 27 TRANSFORAMINAL LUMBAR INTERBODY FUSION DEVICES MARKET, BY REGION,  2021–2028 (USD MILLION)
                               6.2.4.1.4 Axial lumbar interbody fusion devices
                                              TABLE 28 AXIAL LUMBAR INTERBODY FUSION DEVICES MARKET, BY REGION,  2021–2028 (USD MILLION)
                    6.2.4.2 Interbody thoracic & lumbar fusion devices market, by material
                                TABLE 29 INTERBODY THORACIC & LUMBAR FUSION DEVICES MARKET, BY MATERIAL,  2021–2028 (USD MILLION)
                               6.2.4.2.1 Non-bone interbody fusion devices
                                              TABLE 30 NON-BONE INTERBODY FUSION DEVICES MARKET, BY REGION,  2021–2028 (USD MILLION)
                               6.2.4.2.2 Bone interbody fusion devices
                                              TABLE 31 BONE INTERBODY FUSION DEVICES MARKET, BY REGION, 2021–2028 (USD MILLION)
           6.2.5 ANTERIOR THORACIC & LUMBAR FUSION DEVICES
                    6.2.5.1 Minimized impact, low chance of blood loss and infection to support demand
                                TABLE 32 ANTERIOR THORACIC & LUMBAR FUSION DEVICES MARKET, BY REGION,  2021–2028 (USD MILLION)
    6.3 CERVICAL FUSION DEVICES 
          TABLE 33 CERVICAL FUSION DEVICES MARKET, BY TYPE, 2021–2028 (USD MILLION)
          TABLE 34 CERVICAL FUSION DEVICES MARKET, BY REGION, 2021–2028 (USD MILLION)
           6.3.1 CERVICAL FUSION DEVICES MARKET, BY APPLICATION
                    TABLE 35 CERVICAL FUSION DEVICES MARKET, BY APPLICATION, 2021–2028 (USD MILLION)
           6.3.2 CERVICAL FUSION DEVICES MARKET, BY TYPE OF SURGERY
                    TABLE 36 CERVICAL FUSION DEVICES MARKET, BY TYPE OF SURGERY, 2021–2028 (USD MILLION)
           6.3.3 ANTERIOR CERVICAL FUSION DEVICES
                    TABLE 37 ANTERIOR CERVICAL FUSION DEVICES MARKET, BY TYPE, 2021–2028 (USD MILLION)
                    TABLE 38 ANTERIOR CERVICAL FUSION DEVICES MARKET, BY REGION, 2021–2028 (USD MILLION)
                    6.3.3.1 Anterior cervical plates
                               6.3.3.1.1 Anterior cervical plates to hold largest share of cervical fusion devices market
                                              TABLE 39 ANTERIOR CERVICAL PLATES MARKET, BY REGION, 2021–2028 (USD MILLION)
                    6.3.3.2 Anterior cervical screw systems
                               6.3.3.2.1 Potential risk of injury to limit acceptance
                                              TABLE 40 ANTERIOR CERVICAL SCREW SYSTEMS MARKET, BY REGION, 2021–2028 (USD MILLION)
                    6.3.3.3 Cervical interbody fusion devices
                               6.3.3.3.1 Growing use of PEEK over titanium-based devices to support market growth
                                              TABLE 41 CERVICAL INTERBODY FUSION DEVICES MARKET, BY REGION,  2021–2028 (USD MILLION)
           6.3.4 POSTERIOR CERVICAL FUSION DEVICES
                    TABLE 42 POSTERIOR CERVICAL FUSION DEVICES MARKET, BY TYPE, 2021–2028 (USD MILLION)
                    TABLE 43 POSTERIOR CERVICAL FUSION DEVICES MARKET, BY REGION,  2021–2028 (USD MILLION)
                    6.3.4.1 Posterior cervical plates
                               6.3.4.1.1 Plates to hold largest share of posterior cervical fusion devices
                                              TABLE 44 POSTERIOR CERVICAL PLATES MARKET, BY REGION, 2021–2028 (USD MILLION)
                    6.3.4.2 Posterior cervical screws
                               6.3.4.2.1 Growing preference for screws over plates in some procedures to favor market growth
                                              TABLE 45 POSTERIOR CERVICAL SCREWS MARKET, BY REGION, 2021–2028 (USD MILLION)
                    6.3.4.3 Posterior cervical rods
                               6.3.4.3.1 Advantages of newer screw-rod constructs to drive adoption
                                              TABLE 46 POSTERIOR CERVICAL RODS MARKET, BY REGION, 2021–2028 (USD MILLION)
    6.4 SPINE BIOLOGICS 
          TABLE 47 SPINE BIOLOGICS MARKET, BY TYPE, 2021–2028 (USD MILLION)
          TABLE 48 SPINE BIOLOGICS MARKET, BY REGION, 2021–2028 (USD MILLION)
           6.4.1 SPINE BIOLOGICS MARKET, BY APPLICATION
                    TABLE 49 SPINE BIOLOGICS MARKET, BY APPLICATION, 2021–2028 (USD MILLION)
           6.4.2 SPINE BIOLOGICS MARKET, BY TYPE OF SURGERY
                    TABLE 50 SPINE BIOLOGICS MARKET, BY TYPE OF SURGERY, 2021–2028 (USD MILLION)
           6.4.3 DEMINERALIZED BONE MATRIX
                    6.4.3.1 DBM to hold largest share of spine biologics market
                                TABLE 51 DEMINERALIZED BONE MATRIX MARKET, BY REGION, 2021–2028 (USD MILLION)
           6.4.4 BONE MORPHOGENETIC PROTEINS
                    6.4.4.1 Safety and effectiveness to drive adoption
                                TABLE 52 BONE MORPHOGENETIC PROTEINS MARKET, BY REGION, 2021–2028 (USD MILLION)
           6.4.5 BONE SUBSTITUTES
                    6.4.5.1 Easy availability, low cost, and other advantages to support adoption
                                TABLE 53 BONE SUBSTITUTES MARKET, BY REGION, 2021–2028 (USD MILLION)
           6.4.6 MACHINED BONES
                    6.4.6.1 Rising popularity of PEEK and titanium spaces to restrain usage
                                TABLE 54 MACHINED BONES MARKET, BY REGION, 2021–2028 (USD MILLION)
           6.4.7 CELL-BASED MATRICES
                    6.4.7.1 Complications such as risk of infection and sensory loss to affect demand
                                TABLE 55 CELL-BASED MATRICES MARKET, BY REGION, 2021–2028 (USD MILLION)
           6.4.8 ALLOGRAFT BONE
                    6.4.8.1 Lower chance of successful fusion to limit adoption
                                TABLE 56 ALLOGRAFT BONE MARKET, BY REGION, 2021–2028 (USD MILLION)
    6.5 VCF TREATMENT DEVICES 
          TABLE 57 VCF TREATMENT DEVICES MARKET, BY TYPE, 2021–2028 (USD MILLION)
          TABLE 58 VCF TREATMENT DEVICES MARKET, BY REGION, 2021–2028 (USD MILLION)
           6.5.1 VCF TREATMENT DEVICES MARKET, BY APPLICATION
                    TABLE 59 VCF TREATMENT DEVICES MARKET, BY APPLICATION, 2021–2028 (USD MILLION)
           6.5.2 VCF TREATMENT DEVICES MARKET, BY TYPE OF SURGERY
                    TABLE 60 VCF TREATMENT DEVICES MARKET, BY TYPE OF SURGERY, 2021–2028 (USD MILLION)
           6.5.3 BALLOON KYPHOPLASTY DEVICES
                    6.5.3.1 Better surgical outcomes to ensure sustained demand
                                TABLE 61 BALLOON KYPHOPLASTY DEVICES MARKET, BY REGION, 2021–2028 (USD MILLION)
           6.5.4 VERTEBROPLASTY DEVICES
                    6.5.4.1 Chances of cement leakage to limit adoption
                                TABLE 62 VERTEBROPLASTY DEVICES MARKET, BY REGION, 2021–2028 (USD MILLION)
    6.6 SPINAL DECOMPRESSION DEVICES 
          TABLE 63 SPINAL DECOMPRESSION DEVICES MARKET, BY PROCEDURE,  2021–2028 (USD MILLION)
          TABLE 64 SPINAL DECOMPRESSION DEVICES MARKET, BY REGION, 2021–2028 (USD MILLION)
           6.6.1 SPINAL DECOMPRESSION DEVICES MARKET, BY APPLICATION
                    TABLE 65 SPINAL DECOMPRESSION DEVICES MARKET, BY APPLICATION,  2021–2028 (USD MILLION)
           6.6.2 SPINAL DECOMPRESSION DEVICES MARKET, BY TYPE OF SURGERY
                    TABLE 66 SPINAL DECOMPRESSION DEVICES MARKET, BY TYPE OF SURGERY,  2021–2028 (USD MILLION)
           6.6.3 DISCECTOMY
                    6.6.3.1 Rising interest in microdiscectomy to support market growth
                                TABLE 67 SPINAL DECOMPRESSION DEVICES MARKET FOR DISCECTOMY, BY REGION,  2021–2028 (USD MILLION)
           6.6.4 LAMINOPLASTY, LAMINECTOMY, AND LAMINOTOMY
                    6.6.4.1 Rising incidence of spinal stenosis to drive market
                                TABLE 68 SPINAL DECOMPRESSION DEVICES MARKET FOR LAMINOPLASTY, LAMINECTOMY, AND LAMINOTOMY, BY REGION, 2021–2028 (USD MILLION)
           6.6.5 FORAMINOTOMY & FORAMINECTOMY
                    6.6.5.1 Growing preference for MIS treatment of cervical radiculopathy to support adoption
                                TABLE 69 SPINAL DECOMPRESSION DEVICES MARKET FOR FORAMINOTOMY & FORAMINECTOMY, BY REGION, 2021–2028 (USD MILLION)
           6.6.6 FACETECTOMY
                    6.6.6.1 Rising awareness of MIS and risks of facetectomy to restrain growth
                                TABLE 70 SPINAL DECOMPRESSION DEVICES MARKET FOR FACETECTOMY, BY REGION,  2021–2028 (USD MILLION)
           6.6.7 CORPECTOMY
                    6.6.7.1 Challenging procedures and inherent risks to affect demand
                                TABLE 71 SPINAL DECOMPRESSION DEVICES MARKET FOR CORPECTOMY, BY REGION,  2021–2028 (USD MILLION)
    6.7 NON-FUSION DEVICES 
          TABLE 72 NON-FUSION DEVICES MARKET, BY TYPE, 2021–2028 (USD MILLION)
          TABLE 73 NON-FUSION DEVICES MARKET, BY REGION, 2021–2028 (USD MILLION)
           6.7.1 NON-FUSION DEVICES MARKET, BY APPLICATION
                    TABLE 74 NON-FUSION DEVICES MARKET, BY APPLICATION, 2021–2028 (USD MILLION)
           6.7.2 NON-FUSION DEVICES MARKET, BY TYPE OF SURGERY
                    TABLE 75 NON-FUSION DEVICES MARKET, BY TYPE OF SURGERY, 2021–2028 (USD MILLION)
           6.7.3 DYNAMIC STABILIZATION DEVICES
                    TABLE 76 DYNAMIC STABILIZATION DEVICES MARKET, BY TYPE, 2021–2028 (USD MILLION)
                    TABLE 77 DYNAMIC STABILIZATION DEVICES MARKET, BY REGION, 2021–2028 (USD MILLION)
                    6.7.3.1 Interspinous process spacers
                               6.7.3.1.1 Positive outcomes and outpatient procedures to drive demand
                                              TABLE 78 INTERSPINOUS PROCESS SPACERS MARKET, BY REGION, 2021–2028 (USD MILLION)
                    6.7.3.2 Pedicle screw-based dynamic rod devices
                               6.7.3.2.1 Need for long-term safety and efficacy evidence to restrain adoption
                                              TABLE 79 PEDICLE SCREW-BASED DYNAMIC ROD DEVICES, BY REGION,  2021–2028 (USD MILLION)
                    6.7.3.3 Facet replacement products
                               6.7.3.3.1 Positive clinical outcomes and rising interest from players to support growth
                                              TABLE 80 FACET REPLACEMENT PRODUCTS MARKET, BY REGION, 2021–2028 (USD MILLION)
           6.7.4 ARTIFICIAL DISCS
                    TABLE 81 ARTIFICIAL DISCS MARKET, BY TYPE, 2021–2028 (USD MILLION)
                    TABLE 82 ARTIFICIAL DISCS MARKET, BY REGION, 2021–2028 (USD MILLION)
                    6.7.4.1 Artificial cervical discs
                               6.7.4.1.1 Increasing adoption of artificial disc replacement to drive market
                                              TABLE 83 ARTIFICIAL CERVICAL DISCS MARKET, BY REGION, 2021–2028 (USD MILLION)
                    6.7.4.2 Artificial lumbar discs
                               6.7.4.2.1 Limited evidence for effectiveness and possibility of complications to hinder growth
                                              TABLE 84 ARTIFICIAL LUMBAR DISCS MARKET, BY REGION, 2021–2028 (USD MILLION)
           6.7.5 ANNULUS REPAIR DEVICES
                    6.7.5.1 Rising target patient population to drive usage
                                TABLE 85 ANNULUS REPAIR DEVICES MARKET, BY REGION, 2021–2028 (USD MILLION)
           6.7.6 NUCLEAR DISC PROSTHESES
                    6.7.6.1 Nuclear disc prostheses to register high growth
                                TABLE 86 NUCLEAR DISC PROSTHESES MARKET, BY REGION, 2021–2028 (USD MILLION)
    6.8 SPINE BONE STIMULATORS 
          TABLE 87 SPINE BONE STIMULATORS MARKET, BY TYPE, 2021–2028 (USD MILLION)
          TABLE 88 SPINE BONE STIMULATORS MARKET, BY REGION, 2021–2028 (USD MILLION)
           6.8.1 SPINE BONE STIMULATORS MARKET, BY APPLICATION
                    TABLE 89 SPINE BONE STIMULATORS MARKET, BY APPLICATION, 2021–2028 (USD MILLION)
           6.8.2 SPINE BONE STIMULATORS MARKET, BY TYPE OF SURGERY
                    TABLE 90 SPINE BONE STIMULATORS MARKET, BY TYPE OF SURGERY, 2021–2028 (USD MILLION)
           6.8.3 NONINVASIVE SPINE BONE STIMULATORS
                    TABLE 91 NONINVASIVE SPINE BONE STIMULATORS MARKET, BY TYPE, 2021–2028 (USD MILLION)
                    TABLE 92 NONINVASIVE SPINE BONE STIMULATORS MARKET, BY REGION,  2021–2028 (USD MILLION)
                    6.8.3.1 Pulsed electromagnetic field devices
                    6.8.3.2 CC & CMF devices
           6.8.4 INVASIVE SPINE BONE STIMULATORS
                    6.8.4.1 Disadvantages and complications to affect pace of market growth
                                TABLE 93 INVASIVE SPINE BONE STIMULATORS MARKET, BY REGION, 2021–2028 (USD MILLION)
 
7 SPINAL IMPLANTS MARKET, BY TYPE OF SURGERY (Page No. - 139)
    7.1 INTRODUCTION 
          TABLE 94 SPINAL IMPLANTS INDUSTRY, BY TYPE OF SURGERY, 2021–2028 (USD MILLION)
    7.2 OPEN SURGERY 
           7.2.1 INCREASING PREFERENCE FOR OPEN SPINE SURGERIES TO DRIVE MARKET
                    TABLE 95 MARKET FOR OPEN SURGERY, BY REGION, 2021–2028 (USD MILLION)
    7.3 MINIMALLY INVASIVE SURGERY 
           7.3.1 MINIMALLY INVASIVE SURGERY SEGMENT TO REGISTER HIGHEST GROWTH
                    TABLE 96 MARKET FOR MINIMALLY INVASIVE SURGERY, BY REGION,  2021–2028 (USD MILLION)
 
8 SPINAL IMPLANTS MARKET, BY APPLICATION (Page No. - 143)
    8.1 INTRODUCTION 
          TABLE 97 SPINAL IMPLANTS INDUSTRY, BY APPLICATION, 2021–2028 (USD MILLION)
    8.2 SPINAL FUSION & FIXATION 
           8.2.1 SPINAL FUSION & FIXATION TECHNOLOGIES TO DOMINATE MARKET OVER FORECAST PERIOD
                    TABLE 98 MARKET FOR SPINAL FUSION & FIXATION, BY REGION,  2021–2028 (USD MILLION)
    8.3 VCF TREATMENT 
           8.3.1 INCREASING FRACTURE INCIDENCE TO SUPPORT MARKET GROWTH
                    TABLE 99 MARKET FOR VCF TREATMENT, BY REGION,  2021–2028 (USD MILLION)
    8.4 MOTION PRESERVATION/NON-FUSION 
           8.4.1 MOTION PRESERVATION/NON-FUSION TECHNOLOGIES TO WITNESS HIGHEST GROWTH
                    TABLE 100 MARKET FOR MOTION PRESERVATION/NON-FUSION, BY REGION, 2021–2028 (USD MILLION)
    8.5 SPINAL DECOMPRESSION 
           8.5.1 RISING INCIDENCE OF SPINAL TUMORS AND DEVELOPMENT OF MINIMALLY INVASIVE DEVICES TO DRIVE MARKET
                    TABLE 101 MARKET FOR SPINAL DECOMPRESSION, BY REGION,  2021–2028 (USD MILLION)
 
9 SPINAL IMPLANTS MARKET, BY END USER (Page No. - 149)
    9.1 INTRODUCTION 
          TABLE 102 SPINAL IMPLANTS INDUSTRY, BY END USER, 2021–2028 (USD MILLION)
    9.2 HOSPITALS 
           9.2.1 HOSPITALS TO HOLD LARGEST MARKET SHARE
                    TABLE 103 MARKET FOR HOSPITALS, BY REGION, 2021–2028 (USD MILLION)
    9.3 ORTHOPEDIC CENTERS 
           9.3.1 EARLY DETECTION OF SPINAL DISORDERS AND LOWER TURNAROUND TIME TO DRIVE MARKET
                    TABLE 104 MARKET FOR ORTHOPEDIC CENTERS, BY REGION,  2021–2028 (USD MILLION)
 
10 SPINAL IMPLANTS MARKET, BY REGION (Page No. - 152)
     10.1 INTRODUCTION 
             TABLE 105 SPINAL IMPLANTS INDUSTRY, BY REGION, 2021–2028 (USD MILLION)
     10.2 NORTH AMERICA 
             10.2.1 NORTH AMERICA: RECESSION IMPACT
                        FIGURE 25 NORTH AMERICA: MARKET SNAPSHOT
                        TABLE 106 NORTH AMERICA: SPINAL IMPLANTS MARKET, BY COUNTRY, 2021–2028 (USD MILLION)
                        TABLE 107 NORTH AMERICA: SPINAL IMPLANTS INDUSTRY, BY PRODUCT, 2021–2028 (USD MILLION)
                        TABLE 108 NORTH AMERICA: THORACIC & LUMBAR FUSION DEVICES MARKET, BY TYPE,  2021–2028 (USD MILLION)
                        TABLE 109 NORTH AMERICA: INTERBODY THORACIC & LUMBAR FUSION DEVICES MARKET,  BY APPROACH, 2021–2028 (USD MILLION)
                        TABLE 110 NORTH AMERICA: INTERBODY THORACIC & LUMBAR FUSION DEVICES MARKET,  BY MATERIAL, 2021–2028 (USD MILLION)
                        TABLE 111 NORTH AMERICA: CERVICAL FUSION DEVICES MARKET, BY TYPE,  2021–2028 (USD MILLION)
                        TABLE 112 NORTH AMERICA: ANTERIOR CERVICAL FUSION DEVICES MARKET, BY TYPE,  2021–2028 (USD MILLION)
                        TABLE 113 NORTH AMERICA: POSTERIOR CERVICAL FUSION DEVICES MARKET, BY TYPE,  2021–2028 (USD MILLION)
                        TABLE 114 NORTH AMERICA: SPINE BIOLOGICS MARKET, BY TYPE, 2021–2028 (USD MILLION)
                        TABLE 115 NORTH AMERICA: VCF TREATMENT DEVICES MARKET, BY TYPE,  2021–2028 (USD MILLION)
                        TABLE 116 NORTH AMERICA: SPINAL DECOMPRESSION DEVICES MARKET, BY PROCEDURE,  2021–2028 (USD MILLION)
                        TABLE 117 NORTH AMERICA: NON-FUSION DEVICES MARKET, BY TYPE, 2021–2028 (USD MILLION)
                        TABLE 118 NORTH AMERICA: DYNAMIC STABILIZATION DEVICES MARKET, BY TYPE,  2021–2028 (USD MILLION)
                        TABLE 119 NORTH AMERICA: ARTIFICIAL DISCS MARKET, BY TYPE, 2021–2028 (USD MILLION)
                        TABLE 120 NORTH AMERICA: SPINE BONE STIMULATORS MARKET, BY TYPE,  2021–2028 (USD MILLION)
                        TABLE 121 NORTH AMERICA: NONINVASIVE SPINE BONE STIMULATORS MARKET, BY TYPE,  2021–2028 (USD MILLION)
                        TABLE 122 NORTH AMERICA: SPINAL IMPLANTS MARKET, BY TYPE OF SURGERY,  2021–2028 (USD MILLION)
                        TABLE 123 NORTH AMERICA: SPINAL IMPLANTS INDUSTRY, BY APPLICATION,  2021–2028 (USD MILLION)
                        TABLE 124 NORTH AMERICA: SPINAL IMPLANTS MARKET, BY END USER, 2021–2028 (USD MILLION)
             10.2.2 US
                        10.2.2.1 US to dominate North American market
                                      TABLE 125 US: SPINAL IMPLANTS MARKET, BY PRODUCT, 2021–2028 (USD MILLION)
                                      TABLE 126 US: THORACIC & LUMBAR FUSION DEVICES MARKET, BY TYPE,  2021–2028 (USD MILLION)
                                      TABLE 127 US: CERVICAL FUSION DEVICES MARKET, BY TYPE, 2021–2028 (USD MILLION)
                                      TABLE 128 US: SPINE BIOLOGICS MARKET, BY TYPE, 2021–2028 (USD MILLION)
                                      TABLE 129 US: VCF TREATMENT DEVICES MARKET, BY TYPE, 2021–2028 (USD MILLION)
                                      TABLE 130 US: SPINAL DECOMPRESSION DEVICES MARKET, BY PROCEDURE,  2021–2028 (USD MILLION)
                                      TABLE 131 US: NON-FUSION DEVICES MARKET, BY TYPE, 2021–2028 (USD MILLION)
                                      TABLE 132 US: SPINE BONE STIMULATORS MARKET, BY TYPE, 2021–2028 (USD MILLION)
             10.2.3 CANADA
                        10.2.3.1 Inadequate reimbursement for spinal procedures to restrain market growth
                                      TABLE 133 CANADA: SPINAL IMPLANTS MARKET, BY PRODUCT, 2021–2028 (USD MILLION)
                                      TABLE 134 CANADA: THORACIC & LUMBAR FUSION DEVICES MARKET, BY TYPE,  2021–2028 (USD MILLION)
                                      TABLE 135 CANADA: CERVICAL FUSION DEVICES MARKET, BY TYPE, 2021–2028 (USD MILLION)
                                      TABLE 136 CANADA: SPINE BIOLOGICS MARKET, BY TYPE, 2021–2028 (USD MILLION)
                                      TABLE 137 CANADA: VCF TREATMENT DEVICES MARKET, BY TYPE, 2021–2028 (USD MILLION)
                                      TABLE 138 CANADA: SPINAL DECOMPRESSION DEVICES MARKET, BY PROCEDURE,  2021–2028 (USD MILLION)
                                      TABLE 139 CANADA: NON-FUSION DEVICES MARKET, BY TYPE, 2021–2028 (USD MILLION)
                                      TABLE 140 CANADA: SPINE BONE STIMULATORS MARKET, BY TYPE, 2021–2028 (USD MILLION)
     10.3 EUROPE 
             10.3.1 EUROPE: RECESSION IMPACT
                        TABLE 141 EUROPE: SPINAL IMPLANTS MARKET, BY COUNTRY, 2021–2028 (USD MILLION)
                        TABLE 142 EUROPE: SPINAL IMPLANTS INDUSTRY, BY PRODUCT, 2021–2028 (USD MILLION)
                        TABLE 143 EUROPE: THORACIC & LUMBAR FUSION DEVICES MARKET, BY TYPE,  2021–2028 (USD MILLION)
                        TABLE 144 EUROPE: INTERBODY THORACIC & LUMBAR FUSION DEVICES MARKET,  BY APPROACH, 2021–2028 (USD MILLION)
                        TABLE 145 EUROPE: INTERBODY THORACIC & LUMBAR FUSION DEVICES MARKET,  BY MATERIAL, 2021–2028 (USD MILLION)
                        TABLE 146 EUROPE: CERVICAL FUSION DEVICES MARKET, BY TYPE, 2021–2028 (USD MILLION)
                        TABLE 147 EUROPE: ANTERIOR CERVICAL FUSION DEVICES MARKET, BY TYPE,  2021–2028 (USD MILLION)
                        TABLE 148 EUROPE: POSTERIOR CERVICAL FUSION DEVICES MARKET, BY TYPE,  2021–2028 (USD MILLION)
                        TABLE 149 EUROPE: SPINE BIOLOGICS MARKET, BY TYPE, 2021–2028 (USD MILLION)
                        TABLE 150 EUROPE: VCF TREATMENT DEVICES MARKET,  BY TYPE, 2021–2028 (USD MILLION)
                        TABLE 151 EUROPE: SPINAL DECOMPRESSION DEVICES MARKET, BY PROCEDURE,  2021–2028 (USD MILLION)
                        TABLE 152 EUROPE: NON-FUSION DEVICES MARKET, BY TYPE, 2021–2028 (USD MILLION)
                        TABLE 153 EUROPE: DYNAMIC STABILIZATION DEVICES MARKET, BY TYPE,  2021–2028 (USD MILLION)
                        TABLE 154 EUROPE: ARTIFICIAL DISCS MARKET, BY TYPE, 2021–2028 (USD MILLION)
                        TABLE 155 EUROPE: SPINE BONE STIMULATORS MARKET, BY TYPE, 2021–2028 (USD MILLION)
                        TABLE 156 EUROPE: NONINVASIVE SPINE BONE STIMULATORS MARKET, BY TYPE,  2021–2028 (USD MILLION)
                        TABLE 157 EUROPE: SPINAL IMPLANTS MARKET, BY TYPE OF SURGERY, 2021–2028 (USD MILLION)
                        TABLE 158 EUROPE: SPINAL IMPLANTS INDUSTRY, BY APPLICATION, 2021–2028 (USD MILLION)
                        TABLE 159 EUROPE: SPINAL IMPLANTS MARKET, BY END USER, 2021–2028 (USD MILLION)
             10.3.2 GERMANY
                        10.3.2.1 Germany to hold largest market share in Europe
                                      TABLE 160 GERMANY: SPINAL IMPLANTS MARKET, BY PRODUCT, 2021–2028 (USD MILLION)
                                      TABLE 161 GERMANY: THORACIC & LUMBAR FUSION DEVICES MARKET, BY TYPE,  2021–2028 (USD MILLION)
                                      TABLE 162 GERMANY: CERVICAL FUSION DEVICES MARKET, BY TYPE, 2021–2028 (USD MILLION)
                                      TABLE 163 GERMANY: SPINE BIOLOGICS MARKET, BY TYPE, 2021–2028 (USD MILLION)
                                      TABLE 164 GERMANY: VCF TREATMENT DEVICES MARKET, BY TYPE, 2021–2028 (USD MILLION)
                                      TABLE 165 GERMANY: SPINAL DECOMPRESSION DEVICES MARKET, BY PROCEDURE,  2021–2028 (USD MILLION)
                                      TABLE 166 GERMANY: NON-FUSION DEVICES MARKET, BY TYPE, 2021–2028 (USD MILLION)
                                      TABLE 167 GERMANY: SPINE BONE STIMULATORS MARKET, BY TYPE, 2021–2028 (USD MILLION)
             10.3.3 FRANCE
                        10.3.3.1 Rising healthcare expenditure to support market growth
                                      TABLE 168 FRANCE: SPINAL IMPLANTS MARKET, BY PRODUCT, 2021–2028 (USD MILLION)
                                      TABLE 169 FRANCE: THORACIC & LUMBAR FUSION DEVICES MARKET, BY TYPE,  2021–2028 (USD MILLION)
                                      TABLE 170 FRANCE: CERVICAL FUSION DEVICES MARKET, BY TYPE, 2021–2028 (USD MILLION)
                                      TABLE 171 FRANCE: SPINE BIOLOGICS MARKET, BY TYPE, 2021–2028 (USD MILLION)
                                      TABLE 172 FRANCE: VCF TREATMENT DEVICES MARKET, BY TYPE, 2021–2028 (USD MILLION)
                                      TABLE 173 FRANCE: SPINAL DECOMPRESSION DEVICES MARKET, BY PROCEDURE,  2021–2028 (USD MILLION)
                                      TABLE 174 FRANCE: NON-FUSION DEVICES MARKET, BY TYPE, 2021–2028 (USD MILLION)
                                      TABLE 175 FRANCE: SPINE BONE STIMULATORS MARKET, BY TYPE, 2021–2028 (USD MILLION)
             10.3.4 UK
                        10.3.4.1 Rising cost of spinal surgeries to hinder market growth
                                      TABLE 176 UK: SPINAL IMPLANTS MARKET, BY PRODUCT, 2021–2028 (USD MILLION)
                                      TABLE 177 UK: THORACIC & LUMBAR FUSION DEVICES MARKET, BY TYPE,  2021–2028 (USD MILLION)
                                      TABLE 178 UK: CERVICAL FUSION DEVICES MARKET, BY TYPE, 2021–2028 (USD MILLION)
                                      TABLE 179 UK: SPINE BIOLOGICS MARKET, BY TYPE, 2021–2028 (USD MILLION)
                                      TABLE 180 UK: VCF TREATMENT DEVICES MARKET, BY TYPE, 2021–2028 (USD MILLION)
                                      TABLE 181 UK: SPINAL DECOMPRESSION DEVICES MARKET, BY PROCEDURE,  2021–2028 (USD MILLION)
                                      TABLE 182 UK: NON-FUSION DEVICES MARKET, BY TYPE, 2021–2028 (USD MILLION)
                                      TABLE 183 UK: SPINE BONE STIMULATORS MARKET, BY TYPE, 2021–2028 (USD MILLION)
             10.3.5 ITALY
                        10.3.5.1 Demand for MIS to positively affect market growth
                                      TABLE 184 ITALY: SPINAL IMPLANTS MARKET, BY PRODUCT, 2021–2028 (USD MILLION)
                                      TABLE 185 ITALY: THORACIC & LUMBAR FUSION DEVICES MARKET, BY TYPE,  2021–2028 (USD MILLION)
                                      TABLE 186 ITALY: CERVICAL FUSION DEVICES MARKET, BY TYPE, 2021–2028 (USD MILLION)
                                      TABLE 187 ITALY: SPINE BIOLOGICS MARKET, BY TYPE, 2021–2028 (USD MILLION)
                                      TABLE 188 ITALY: VCF TREATMENT DEVICES MARKET, BY TYPE, 2021–2028 (USD MILLION)
                                      TABLE 189 ITALY: SPINAL DECOMPRESSION DEVICES MARKET, BY PROCEDURE,  2021–2028 (USD MILLION)
                                      TABLE 190 ITALY: NON-FUSION DEVICES MARKET, BY TYPE, 2021–2028 (USD MILLION)
                                      TABLE 191 ITALY: SPINE BONE STIMULATORS MARKET, BY TYPE, 2021–2028 (USD MILLION)
             10.3.6 SPAIN
                        10.3.6.1 Growing preference for MIS to support market growth
                                      TABLE 192 SPAIN: SPINAL IMPLANTS MARKET, BY PRODUCT, 2021–2028 (USD MILLION)
                                      TABLE 193 SPAIN: THORACIC & LUMBAR FUSION DEVICES MARKET, BY TYPE,  2021–2028 (USD MILLION)
                                      TABLE 194 SPAIN: CERVICAL FUSION DEVICES MARKET, BY TYPE, 2021–2028 (USD MILLION)
                                      TABLE 195 SPAIN: SPINE BIOLOGICS MARKET, BY TYPE, 2021–2028 (USD MILLION)
                                      TABLE 196 SPAIN: VCF TREATMENT DEVICES MARKET, BY TYPE, 2021–2028 (USD MILLION)
                                      TABLE 197 SPAIN: SPINAL DECOMPRESSION DEVICES MARKET, BY PROCEDURE,  2021–2028 (USD MILLION)
                                      TABLE 198 SPAIN: NON-FUSION DEVICES MARKET, BY TYPE, 2021–2028 (USD MILLION)
                                      TABLE 199 SPAIN: SPINE BONE STIMULATORS MARKET, BY TYPE, 2021–2028 (USD MILLION)
             10.3.7 REST OF EUROPE
                        TABLE 200 REST OF EUROPE: SPINAL IMPLANTS MARKET, BY PRODUCT, 2021–2028 (USD MILLION)
                        TABLE 201 REST OF EUROPE: THORACIC & LUMBAR FUSION DEVICES MARKET, BY TYPE,  2021–2028 (USD MILLION)
                        TABLE 202 REST OF EUROPE: CERVICAL FUSION DEVICES MARKET, BY TYPE,  2021–2028 (USD MILLION)
                        TABLE 203 V: SPINE BIOLOGICS MARKET, BY TYPE, 2021–2028 (USD MILLION)
                        TABLE 204 REST OF EUROPE: VCF TREATMENT DEVICES MARKET, BY TYPE,  2021–2028 (USD MILLION)
                        TABLE 205 REST OF EUROPE: SPINAL DECOMPRESSION DEVICES MARKET, BY PROCEDURE,  2021–2028 (USD MILLION)
                        TABLE 206 REST OF EUROPE: NON-FUSION DEVICES MARKET, BY TYPE, 2021–2028 (USD MILLION)
                        TABLE 207 REST OF EUROPE: SPINE BONE STIMULATORS MARKET, BY TYPE,  2021–2028 (USD MILLION)
     10.4 ASIA PACIFIC 
             10.4.1 ASIA PACIFIC: RECESSION IMPACT
                        FIGURE 26 ASIA PACIFIC: MARKET SNAPSHOT
                        TABLE 208 ASIA PACIFIC: SPINAL IMPLANTS MARKET, BY COUNTRY, 2021–2028 (USD MILLION)
                        TABLE 209 ASIA PACIFIC: SPINAL IMPLANTS INDUSTRY, BY PRODUCT, 2021–2028 (USD MILLION)
                        TABLE 210 ASIA PACIFIC: THORACIC & LUMBAR FUSION DEVICES MARKET, BY TYPE,  2021–2028 (USD MILLION)
                        TABLE 211 ASIA PACIFIC: INTERBODY THORACIC & LUMBAR FUSION DEVICES MARKET,  BY APPROACH, 2021–2028 (USD MILLION)
                        TABLE 212 ASIA PACIFIC: INTERBODY THORACIC & LUMBAR FUSION DEVICES MARKET,  BY MATERIAL, 2021–2028 (USD MILLION)
                        TABLE 213 ASIA PACIFIC: CERVICAL FUSION DEVICES MARKET, BY TYPE, 2021–2028 (USD MILLION)
                        TABLE 214 ASIA PACIFIC: ANTERIOR CERVICAL FUSION DEVICES MARKET, BY TYPE,  2021–2028 (USD MILLION)
                        TABLE 215 ASIA PACIFIC: POSTERIOR CERVICAL FUSION DEVICES MARKET, BY TYPE,  2021–2028 (USD MILLION)
                        TABLE 216 ASIA PACIFIC: SPINE BIOLOGICS MARKET, BY TYPE, 2021–2028 (USD MILLION)
                        TABLE 217 ASIA PACIFIC: VCF TREATMENT DEVICES MARKET, BY TYPE, 2021–2028 (USD MILLION)
                        TABLE 218 ASIA PACIFIC: SPINAL DECOMPRESSION DEVICES MARKET, BY PROCEDURE,  2021–2028 (USD MILLION)
                        TABLE 219 ASIA PACIFIC: NON-FUSION DEVICES MARKET, BY TYPE, 2021–2028 (USD MILLION)
                        TABLE 220 ASIA PACIFIC: DYNAMIC STABILIZATION DEVICES MARKET, BY TYPE,  2021–2028 (USD MILLION)
                        TABLE 221 ASIA PACIFIC: ARTIFICIAL DISCS MARKET, BY TYPE, 2021–2028 (USD MILLION)
                        TABLE 222 ASIA PACIFIC: SPINE BONE STIMULATORS MARKET, BY TYPE, 2021–2028 (USD MILLION)
                        TABLE 223 ASIA PACIFIC: NONINVASIVE SPINE BONE STIMULATORS MARKET, BY TYPE,  2021–2028 (USD MILLION)
                        TABLE 224 ASIA PACIFIC: SPINAL IMPLANTS MARKET, BY TYPE OF SURGERY,  2021–2028 (USD MILLION)
                        TABLE 225 ASIA PACIFIC: SPINAL IMPLANTS INDUSTRY, BY APPLICATION, 2021–2028 (USD MILLION)
                        TABLE 226 ASIA PACIFIC: SPINAL IMPLANTS MARKET, BY END USER, 2021–2028 (USD MILLION)
             10.4.2 JAPAN
                        10.4.2.1 Japan to dominate APAC market for spinal surgeries
                                      TABLE 227 JAPAN: SPINAL IMPLANTS MARKET, BY PRODUCT, 2021–2028 (USD MILLION)
                                      TABLE 228 JAPAN: THORACIC & LUMBAR FUSION DEVICES MARKET, BY TYPE,  2021–2028 (USD MILLION)
                                      TABLE 229 JAPAN: CERVICAL FUSION DEVICES MARKET, BY TYPE, 2021–2028 (USD MILLION)
                                      TABLE 230 JAPAN: SPINE BIOLOGICS MARKET, BY TYPE, 2021–2028 (USD MILLION)
                                      TABLE 231 JAPAN: VCF TREATMENT DEVICES MARKET, BY TYPE, 2021–2028 (USD MILLION)
                                      TABLE 232 JAPAN: SPINAL DECOMPRESSION DEVICES MARKET, BY PROCEDURE,  2021–2028 (USD MILLION)
                                      TABLE 233 JAPAN: NON-FUSION DEVICES MARKET, BY TYPE, 2021–2028 (USD MILLION)
                                      TABLE 234 JAPAN: SPINE BONE STIMULATORS MARKET, BY TYPE, 2021–2028 (USD MILLION)
             10.4.3 CHINA
                        10.4.3.1 Limited reimbursement coverage for spinal surgeries to affect market growth
                                      TABLE 235 CHINA: SPINAL IMPLANTS MARKET, BY PRODUCT, 2021–2028 (USD MILLION)
                                      TABLE 236 CHINA: THORACIC & LUMBAR FUSION DEVICES MARKET, BY TYPE,  2021–2028 (USD MILLION)
                                      TABLE 237 CHINA: CERVICAL FUSION DEVICES MARKET, BY TYPE, 2021–2028 (USD MILLION)
                                      TABLE 238 CHINA: SPINE BIOLOGICS MARKET, BY TYPE, 2021–2028 (USD MILLION)
                                      TABLE 239 CHINA: VCF TREATMENT DEVICES MARKET, BY TYPE, 2021–2028 (USD MILLION)
                                      TABLE 240 CHINA: SPINAL DECOMPRESSION DEVICES MARKET, BY PROCEDURE,  2021–2028 (USD MILLION)
                                      TABLE 241 CHINA: NON-FUSION DEVICES MARKET, BY TYPE, 2021–2028 (USD MILLION)
                                      TABLE 242 CHINA: SPINE BONE STIMULATORS MARKET, BY TYPE, 2021–2028 (USD MILLION)
             10.4.4 INDIA
                        10.4.4.1 Low surgical costs to support market growth
                                      TABLE 243 INDIA: SPINAL IMPLANTS MARKET, BY PRODUCT, 2021–2028 (USD MILLION)
                                      TABLE 244 INDIA: THORACIC & LUMBAR FUSION DEVICES MARKET, BY TYPE,  2021–2028 (USD MILLION)
                                      TABLE 245 INDIA: CERVICAL FUSION DEVICES MARKET, BY TYPE, 2021–2028 (USD MILLION)
                                      TABLE 246 INDIA: SPINE BIOLOGICS MARKET, BY TYPE, 2021–2028 (USD MILLION)
                                      TABLE 247 INDIA: VCF TREATMENT DEVICES MARKET, BY TYPE, 2021–2028 (USD MILLION)
                                      TABLE 248 INDIA: SPINAL DECOMPRESSION DEVICES MARKET, BY PROCEDURE,  2021–2028 (USD MILLION)
                                      TABLE 249 INDIA: NON-FUSION DEVICES MARKET, BY TYPE, 2021–2028 (USD MILLION)
                                      TABLE 250 INDIA: SPINE BONE STIMULATORS MARKET, BY TYPE, 2021–2028 (USD MILLION)
             10.4.5 AUSTRALIA
                        10.4.5.1 Uneven distribution of specialists to hinder market growth
                                      TABLE 251 AUSTRALIA: SPINAL IMPLANTS MARKET, BY PRODUCT, 2021–2028 (USD MILLION)
                                      TABLE 252 AUSTRALIA: THORACIC & LUMBAR FUSION DEVICES MARKET, BY TYPE,  2021–2028 (USD MILLION)
                                      TABLE 253 AUSTRALIA: CERVICAL FUSION DEVICES MARKET, BY TYPE, 2021–2028 (USD MILLION)
                                      TABLE 254 AUSTRALIA: SPINE BIOLOGICS MARKET, BY TYPE, 2021–2028 (USD MILLION)
                                      TABLE 255 AUSTRALIA: VCF TREATMENT DEVICES MARKET, BY TYPE, 2021–2028 (USD MILLION)
                                      TABLE 256 AUSTRALIA: SPINAL DECOMPRESSION DEVICES MARKET, BY PROCEDURE,  2021–2028 (USD MILLION)
                                      TABLE 257 AUSTRALIA: NON-FUSION DEVICES MARKET, BY TYPE, 2021–2028 (USD MILLION)
                                      TABLE 258 AUSTRALIA: SPINE BONE STIMULATORS MARKET, BY TYPE, 2021–2028 (USD MILLION)
             10.4.6 SOUTH KOREA
                        10.4.6.1 Growing medical tourism to favor demand for spinal implants
                                      TABLE 259 SOUTH KOREA: SPINAL IMPLANTS MARKET, BY PRODUCT, 2021–2028 (USD MILLION)
                                      TABLE 260 SOUTH KOREA: THORACIC & LUMBAR FUSION DEVICES MARKET, BY TYPE,  2021–2028 (USD MILLION)
                                      TABLE 261 SOUTH KOREA: CERVICAL FUSION DEVICES MARKET, BY TYPE,  2021–2028 (USD MILLION)
                                      TABLE 262 SOUTH KOREA: SPINE BIOLOGICS MARKET, BY TYPE, 2021–2028 (USD MILLION)
                                      TABLE 263 SOUTH KOREA: VCF TREATMENT DEVICES MARKET,  BY TYPE, 2021–2028 (USD MILLION)
                                      TABLE 264 SOUTH KOREA: SPINAL DECOMPRESSION DEVICES MARKET, BY PROCEDURE,  2021–2028 (USD MILLION)
                                      TABLE 265 SOUTH KOREA: NON-FUSION DEVICES MARKET, BY TYPE, 2021–2028 (USD MILLION)
                                      TABLE 266 SOUTH KOREA: SPINE BONE STIMULATORS MARKET, BY TYPE,  2021–2028 (USD MILLION)
             10.4.7 REST OF ASIA PACIFIC
                        TABLE 267 REST OF ASIA PACIFIC: SPINAL IMPLANTS MARKET, BY PRODUCT,  2021–2028 (USD MILLION)
                        TABLE 268 REST OF ASIA PACIFIC: THORACIC & LUMBAR FUSION DEVICES MARKET, BY TYPE,  2021–2028 (USD MILLION)
                        TABLE 269 REST OF ASIA PACIFIC: CERVICAL FUSION DEVICES MARKET, BY TYPE,  2021–2028 (USD MILLION)
                        TABLE 270 REST OF ASIA PACIFIC: SPINE BIOLOGICS MARKET, BY TYPE, 2021–2028 (USD MILLION)
                        TABLE 271 REST OF ASIA PACIFIC: VCF TREATMENT DEVICES MARKET, BY TYPE,  2021–2028 (USD MILLION)
                        TABLE 272 REST OF ASIA PACIFIC: SPINAL DECOMPRESSION DEVICES MARKET, BY PROCEDURE,  2021–2028 (USD MILLION)
                        TABLE 273 REST OF ASIA PACIFIC: NON-FUSION DEVICES MARKET, BY TYPE,  2021–2028 (USD MILLION)
                        TABLE 274 REST OF ASIA PACIFIC: SPINE BONE STIMULATORS MARKET, BY TYPE,  2021–2028 (USD MILLION)
     10.5 LATIN AMERICA 
             10.5.1 LATIN AMERICA: RECESSION IMPACT
                        TABLE 275 LATIN AMERICA: SPINAL IMPLANTS MARKET, BY COUNTRY, 2021–2028 (USD MILLION)
                        TABLE 276 LATIN AMERICA: SPINAL IMPLANTS INDUSTRY, BY PRODUCT, 2021–2028 (USD MILLION)
                        TABLE 277 LATIN AMERICA: THORACIC & LUMBAR FUSION DEVICES MARKET, BY TYPE,  2021–2028 (USD MILLION)
                        TABLE 278 LATIN AMERICA: INTERBODY THORACIC & LUMBAR FUSION DEVICES MARKET,  BY APPROACH, 2021–2028 (USD MILLION)
                        TABLE 279 LATIN AMERICA: INTERBODY THORACIC & LUMBAR FUSION DEVICES MARKET,  BY MATERIAL, 2021–2028 (USD MILLION)
                        TABLE 280 LATIN AMERICA: CERVICAL FUSION DEVICES MARKET, BY TYPE,  2021–2028 (USD MILLION)
                        TABLE 281 LATIN AMERICA: ANTERIOR CERVICAL FUSION DEVICES MARKET, BY TYPE,  2021–2028 (USD MILLION)
                        TABLE 282 LATIN AMERICA: POSTERIOR CERVICAL FUSION DEVICES MARKET, BY TYPE,  2021–2028 (USD MILLION)
                        TABLE 283 LATIN AMERICA: SPINE BIOLOGICS MARKET, BY TYPE, 2021–2028 (USD MILLION)
                        TABLE 284 LATIN AMERICA: VCF TREATMENT DEVICES MARKET, BY TYPE, 2021–2028 (USD MILLION)
                        TABLE 285 LATIN AMERICA: SPINAL DECOMPRESSION DEVICES MARKET, BY PROCEDURE,  2021–2028 (USD MILLION)
                        TABLE 286 LATIN AMERICA: NON-FUSION DEVICES MARKET, BY TYPE, 2021–2028 (USD MILLION)
                        TABLE 287 LATIN AMERICA: DYNAMIC STABILIZATION DEVICES MARKET, BY TYPE,  2021–2028 (USD MILLION)
                        TABLE 288 LATIN AMERICA: ARTIFICIAL DISCS MARKET, BY TYPE, 2021–2028 (USD MILLION)
                        TABLE 289 LATIN AMERICA: SPINE BONE STIMULATORS MARKET, BY TYPE,  2021–2028 (USD MILLION)
                        TABLE 290 LATIN AMERICA: NONINVASIVE SPINE BONE STIMULATORS MARKET, BY TYPE,  2021–2028 (USD MILLION)
                        TABLE 291 LATIN AMERICA: SPINAL IMPLANTS MARKET, BY TYPE OF SURGERY,  2021–2028 (USD MILLION)
                        TABLE 292 LATIN AMERICA: SPINAL IMPLANTS INDUSTRY, BY APPLICATION,  2021–2028 (USD MILLION)
                        TABLE 293 LATIN AMERICA: SPINAL IMPLANTS MARKET, BY END USER, 2021–2028 (USD MILLION)
             10.5.2 BRAZIL
                        10.5.2.1 Brazil to dominate LATAM market
                                      TABLE 294 BRAZIL: SPINAL IMPLANTS MARKET, BY PRODUCT, 2021–2028 (USD MILLION)
                                      TABLE 295 BRAZIL: THORACIC & LUMBAR FUSION DEVICES MARKET, BY TYPE,  2021–2028 (USD MILLION)
                                      TABLE 296 BRAZIL: CERVICAL FUSION DEVICES MARKET, BY TYPE, 2021–2028 (USD MILLION)
                                      TABLE 297 BRAZIL: SPINE BIOLOGICS MARKET, BY TYPE, 2021–2028 (USD MILLION)
                                      TABLE 298 BRAZIL: VCF TREATMENT DEVICES MARKET, BY TYPE, 2021–2028 (USD MILLION)
                                      TABLE 299 BRAZIL: SPINAL DECOMPRESSION DEVICES MARKET, BY PROCEDURE,  2021–2028 (USD MILLION)
                                      TABLE 300 BRAZIL: NON-FUSION DEVICES MARKET, BY TYPE, 2021–2028 (USD MILLION)
                                      TABLE 301 BRAZIL: SPINE BONE STIMULATORS MARKET, BY TYPE, 2021–2028 (USD MILLION)
             10.5.3 MEXICO
                        10.5.3.1 Fragmented healthcare system to create challenges for market players
                                      TABLE 302 MEXICO: SPINAL IMPLANTS MARKET, BY PRODUCT, 2021–2028 (USD MILLION)
                                      TABLE 303 MEXICO: THORACIC & LUMBAR FUSION DEVICES MARKET, BY TYPE,  2021–2028 (USD MILLION)
                                      TABLE 304 MEXICO: CERVICAL FUSION DEVICES MARKET, BY TYPE, 2021–2028 (USD MILLION)
                                      TABLE 305 MEXICO: SPINE BIOLOGICS MARKET, BY TYPE, 2021–2028 (USD MILLION)
                                      TABLE 306 MEXICO: VCF TREATMENT DEVICES MARKET,  BY TYPE, 2021–2028 (USD MILLION)
                                      TABLE 307 MEXICO: SPINAL DECOMPRESSION DEVICES MARKET, BY PROCEDURE,  2021–2028 (USD MILLION)
                                      TABLE 308 MEXICO: NON-FUSION DEVICES MARKET, BY TYPE, 2021–2028 (USD MILLION)
                                      TABLE 309 MEXICO: SPINE BONE STIMULATORS MARKET, BY TYPE, 2021–2028 (USD MILLION)
             10.5.4 REST OF LATIN AMERICA
                        TABLE 310 REST OF LATIN AMERICA: SPINAL IMPLANTS MARKET, BY PRODUCT,  2021–2028 (USD MILLION)
                        TABLE 311 REST OF LATIN AMERICA: THORACIC & LUMBAR FUSION DEVICES MARKET, BY TYPE,  2021–2028 (USD MILLION)
                        TABLE 312 REST OF LATIN AMERICA: CERVICAL FUSION DEVICES MARKET, BY TYPE,  2021–2028 (USD MILLION)
                        TABLE 313 REST OF LATIN AMERICA: SPINE BIOLOGICS MARKET, BY TYPE,  2021–2028 (USD MILLION)
                        TABLE 314 REST OF LATIN AMERICA: VCF TREATMENT DEVICES MARKET, BY TYPE,  2021–2028 (USD MILLION)
                        TABLE 315 REST OF LATIN AMERICA: SPINAL DECOMPRESSION DEVICES MARKET, BY PROCEDURE,  2021–2028 (USD MILLION)
                        TABLE 316 REST OF LATIN AMERICA: NON-FUSION DEVICES MARKET, BY TYPE,  2021–2028 (USD MILLION)
                        TABLE 317 REST OF LATIN AMERICA: SPINE BONE STIMULATORS MARKET, BY TYPE,  2021–2028 (USD MILLION)
     10.6 MIDDLE EAST & AFRICA 
             10.6.1 MEA TO OFFER PROMISING OPPORTUNITIES FOR PLAYERS
             10.6.2 MIDDLE EAST & AFRICA: RECESSION IMPACT
                        TABLE 318 MIDDLE EAST & AFRICA: SPINAL IMPLANTS MARKET, BY PRODUCT,  2021–2028 (USD MILLION)
                        TABLE 319 MIDDLE EAST & AFRICA: THORACIC & LUMBAR FUSION DEVICES MARKET, BY TYPE,  2021–2028 (USD MILLION)
                        TABLE 320 MIDDLE EAST & AFRICA: INTERBODY THORACIC & LUMBAR FUSION DEVICES MARKET,  BY APPROACH, 2021–2028 (USD MILLION)
                        TABLE 321 MIDDLE EAST & AFRICA: INTERBODY THORACIC & LUMBAR FUSION DEVICES MARKET,  BY MATERIAL, 2021–2028 (USD MILLION)
                        TABLE 322 MIDDLE EAST & AFRICA: CERVICAL FUSION DEVICES MARKET, BY TYPE,  2021–2028 (USD MILLION)
                        TABLE 323 MIDDLE EAST & AFRICA: ANTERIOR CERVICAL FUSION DEVICES MARKET, BY TYPE,  2021–2028 (USD MILLION)
                        TABLE 324 MIDDLE EAST & AFRICA: POSTERIOR CERVICAL FUSION DEVICES MARKET, BY TYPE,  2021–2028 (USD MILLION)
                        TABLE 325 MIDDLE EAST & AFRICA: SPINE BIOLOGICS MARKET, BY TYPE,  2021–2028 (USD MILLION)
                        TABLE 326 MIDDLE EAST & AFRICA: VCF TREATMENT DEVICES MARKET, BY TYPE,  2021–2028 (USD MILLION)
                        TABLE 327 MIDDLE EAST & AFRICA: SPINAL DECOMPRESSION DEVICES MARKET, BY PROCEDURE,  2021–2028 (USD MILLION)
                        TABLE 328 MIDDLE EAST & AFRICA: NON-FUSION DEVICES MARKET, BY TYPE,  2021–2028 (USD MILLION)
                        TABLE 329 MIDDLE EAST & AFRICA: DYNAMIC STABILIZATION DEVICES MARKET, BY TYPE,  2021–2028 (USD MILLION)
                        TABLE 330 MIDDLE EAST & AFRICA: ARTIFICIAL DISCS MARKET, BY TYPE,  2021–2028 (USD MILLION)
                        TABLE 331 MIDDLE EAST & AFRICA: SPINE BONE STIMULATORS MARKET, BY TYPE,  2021–2028 (USD MILLION)
                        TABLE 332 MIDDLE EAST & AFRICA: NONINVASIVE SPINE BONE STIMULATORS MARKET, BY TYPE,  2021–2028 (USD MILLION)
                        TABLE 333 MIDDLE EAST & AFRICA: SPINAL IMPLANTS MARKET, BY TYPE OF SURGERY,  2021–2028 (USD MILLION)
                        TABLE 334 MIDDLE EAST & AFRICA: SPINAL IMPLANTS INDUSTRY, BY APPLICATION,  2021–2028 (USD MILLION)
                        TABLE 335 MIDDLE EAST & AFRICA: SPINAL IMPLANTS MARKET, BY END USER,  2021–2028 (USD MILLION)
             10.6.3 GCC COUNTRIES
 
11 COMPETITIVE LANDSCAPE (Page No. - 261)
     11.1 OVERVIEW 
     11.2 KEY PLAYER STRATEGIES/RIGHT TO WIN 
             11.2.1 OVERVIEW OF STRATEGIES ADOPTED BY SPINAL IMPLANT PLAYERS
     11.3 REVENUE SHARE ANALYSIS 
             FIGURE 27 REVENUE SHARE ANALYSIS OF TOP PLAYERS IN SPINAL IMPLANTS MARKET, 2018–2022 (USD MILLION)
     11.4 MARKET SHARE ANALYSIS 
             11.4.1 GLOBAL SSPINAL IMPLANTS INDUSTRY SHARE,  BY KEY PLAYER, 2022
                        FIGURE 28 SPINAL IMPLANTS/SURGICAL DEVICES MARKET SHARE ANALYSIS, 2022
             11.4.2 GLOBAL SPINE BIOLOGICS MARKET SHARE, BY KEY PLAYER, 2022
                        FIGURE 29 SPINE BIOLOGICS MARKET SHARE ANALYSIS, 2022
             11.4.3 GLOBAL SPINE BONE STIMULATORS MARKET SHARE, BY KEY PLAYER, 2022
                        FIGURE 30 SPINE BONE STIMULATORS MARKET SHARE ANALYSIS, 2022
                        FIGURE 31 SPINAL IMPLANTS MARKET (2022)
     11.5 COMPANY EVALUATION MATRIX 
             11.5.1 STARS
             11.5.2 EMERGING LEADERS
             11.5.3 PERVASIVE PLAYERS
             11.5.4 PARTICIPANTS
                        FIGURE 32 SPINAL IMPLANTS MARKET: COMPANY EVALUATION MATRIX, 2022
             11.5.5 COMPANY FOOTPRINT
                        TABLE 336 PRODUCT FOOTPRINT (17 COMPANIES)
                        TABLE 337 REGIONAL FOOTPRINT (17 COMPANIES)
                        TABLE 338 COMPANY FOOTPRINT (17 COMPANIES)
     11.6 STARTUP/SME EVALUATION MATRIX 
             11.6.1 PROGRESSIVE COMPANIES
             11.6.2 STARTING BLOCKS
             11.6.3 RESPONSIVE COMPANIES
             11.6.4 DYNAMIC COMPANIES
                        FIGURE 33 SPINAL IMPLANTS MARKET: STARTUP/SME EVALUATION MATRIX, 2022
             11.6.5 COMPANY BENCHMARKING
                        TABLE 339 SPINAL IMPLANTS MARKET: DETAILED LIST OF KEY STARTUP/SME PLAYERS
                        TABLE 340 SPINAL IMPLANTS MARKET: COMPETITIVE BENCHMARKING OF STARTUP/SME PLAYERS
     11.7 COMPETITIVE SCENARIOS AND TRENDS 
             TABLE 341 KEY PRODUCT LAUNCHES & APPROVALS (JANUARY 2021 TO OCTOBER 2023)
             TABLE 342 KEY DEALS
 
12 COMPANY PROFILES (Page No. - 275)
     12.1 KEY PLAYERS 
(Business overview, Services/Solutions offered, Recent developments, MnM view, Right to win, Strategic choices made, and Weaknesses and Competitive threats)*
             12.1.1 MEDTRONIC PLC
                        TABLE 343 MEDTRONIC PLC: COMPANY OVERVIEW
                        FIGURE 34 MEDTRONIC PLC: COMPANY SNAPSHOT (2023)
             12.1.2 JOHNSON & JOHNSON MEDTECH
                        TABLE 344 JOHNSON & JOHNSON MEDTECH: COMPANY OVERVIEW
                        FIGURE 35 JOHNSON & JOHNSON MEDTECH: COMPANY SNAPSHOT (2022)
             12.1.3 NUVASIVE, INC.
                        TABLE 345 NUVASIVE, INC: COMPANY OVERVIEW
                        FIGURE 36 NUVASIVE, INC: COMPANY SNAPSHOT (2022)
             12.1.4 STRYKER CORPORATION
                        TABLE 346 STRYKER CORPORATION: COMPANY OVERVIEW
                        FIGURE 37 STRYKER CORPORATION: COMPANY SNAPSHOT (2022)
             12.1.5 GLOBUS MEDICAL, INC.
                        TABLE 347 GLOBUS MEDICAL, INC.: COMPANY OVERVIEW
                        FIGURE 38 GLOBUS MEDICAL, INC.: COMPANY SNAPSHOT (2022)
             12.1.6 ZIMMER BIOMET HOLDINGS, INC.
                        TABLE 348 ZIMMER BIOMET HOLDINGS, INC.: COMPANY OVERVIEW
                        FIGURE 39 ZIMVIE, INC.: COMPANY SNAPSHOT (2022)
             12.1.7 ORTHOFIX INTERNATIONAL N.V.
                        TABLE 349 ORTHOFIX INTERNATIONAL N.V.: COMPANY OVERVIEW
                        FIGURE 40 ORTHOFIX INTERNATIONAL N.V.: COMPANY SNAPSHOT (2022)
             12.1.8 ULRICH GMBH & CO. KG
                        TABLE 350 ULRICH GMBH & CO. KG: COMPANY OVERVIEW
             12.1.9 B. BRAUN MELSUNGEN AG
                        FIGURE 41 B. BRAUN MELSUNGEN AG: COMPANY SNAPSHOT (2022)
             12.1.10 INTEGRA LIFESCIENCES HOLDINGS CORPORATION
                        TABLE 351 INTEGRA LIFESCIENCES HOLDINGS CORPORATION: COMPANY OVERVIEW
                        FIGURE 42 INTEGRA LIFESCIENCES HOLDINGS CORPORATION: COMPANY SNAPSHOT (2023)
             12.1.11 BOSTON SCIENTIFIC CORPORATION
                        TABLE 352 BOSTON SCIENTIFIC CORPORATION: COMPANY OVERVIEW
                        FIGURE 43 BOSTON SCIENTIFIC CORPORATION: COMPANY SNAPSHOT (2022)
             12.1.12 ABBOTT LABORATORIES
                        TABLE 353 ABBOTT LABORATORIES: COMPANY OVERVIEW
                        FIGURE 44 ABBOTT LABORATORIES: COMPANY SNAPSHOT (2022)
             12.1.13 SPINEART
                        TABLE 354 SPINEART: COMPANY OVERVIEW
             12.1.14 CENTINEL SPINE LLC
                        TABLE 355 CENTINEL SPINE LLC: BUSINESS OVERVIEW
             12.1.15 PREMIA SPINE
                        TABLE 356 PREMIA SPINE: BUSINESS OVERVIEW
             12.1.16 EXACTECH, INC.
                        TABLE 357 EXACTECH, INC.: BUSINESS OVERVIEW
             12.1.17 LIFE SPINE, INC.
                        TABLE 358 LIFE SPINE, INC.: BUSINESS OVERVIEW
             12.1.18 ATEC SPINE
                        TABLE 359 ATEC SPINE: BUSINESS OVERVIEW
                        FIGURE 45 ATEC SPINE: COMPANY SNAPSHOT (2022)
     12.2 OTHER PLAYERS 
             12.2.1 KUROS BIOSCIENCES LTD.
             12.2.2 BIOVENTUS LLC
             12.2.3 COLFAX CORPORATION
             12.2.4 AESCULAP INC.
             12.2.5 IMPLANET
             12.2.6 CAMBER SPINE TECHNOLOGIES
             12.2.7 CAPTIVA SPINE, INC.
             12.2.8 MEDACTA INTERNATIONAL
             12.2.9 AURORA SPINE CORPORATION
 
*Details on Business overview, Services/Solutions offered, Recent developments, MnM view, Right to win, Strategic choices made, and Weaknesses and Competitive threats might not be captured in case of unlisted companies.
 
13 APPENDIX (Page No. - 327)
     13.1 DISCUSSION GUIDE 
     13.2 KNOWLEDGESTORE: MARKETSANDMARKETS’  SUBSCRIPTION PORTAL 
     13.3 CUSTOMIZATION OPTIONS 
     13.4 RELATED REPORTS 
     13.5 AUTHOR DETAILS 

This study involved the extensive use of both primary and secondary sources. The research process involved the study of various factors affecting the industry to identify the segmentation types, key market dynamics, key players, competitive landscape, industry trends, and key player strategies.

Secondary Research

The secondary research process involves the widespread use of secondary sources, directories, databases (such as Factiva, Bloomberg Businessweek, and D&B Hoovers), white papers, company house documents, investor presentations, annual reports, and SEC filings of companies. Secondary research was used to identify and collect information useful for the market-oriented, technical, extensive, and commercial study of the spinal implants market. It was also used to obtain important information about the key players and market classification & segmentation according to industry trends to the bottom-most level and recent developments related to market and technology perspectives. A database of the key industry leaders was also prepared using secondary research.

Primary Research

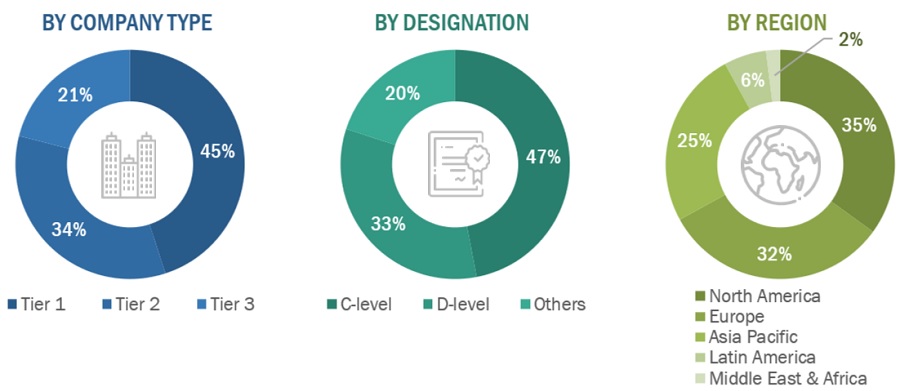
Comprehensive primary research was conducted following an initial understanding of the spinal implants market from secondary research sources. Numerous primary interviews were carried out, encompassing perspectives from both demand (including research institutes, healthcare providers, hospitals, and orthopedic centers) and supply sides (involving developers, manufacturers, and distributors of spinal implant products). The interviewees comprised industry experts from the orthopedic devices (spinal implants) sector, including CEOs, directors, sales heads, VPs and marketing managers from tier 1, 2, and 3 companies providing spinal implant products globally.

Approximately 65% of the interviews were conducted with representatives from the supply side, while the remaining 35% were from the demand side. A rigorous primary research approach was employed to validate the report's contents and bridge any information gaps. Interviews were conducted through telephonic and email communications, where questionnaires were tailored and sent to primary participants based on their convenience.

A breakdown of the primary respondents is provided below:
Spinal Implants Market Size, and Share

*Others include sales managers, marketing managers, business development managers, product managers, distributors, and suppliers.

Note: Companies are classified into tiers based on their total revenue. As of 2022, Tier 1 = >USD 2 billion, Tier 2 = USD 50 million to USD 2 billion, and Tier 3 = <USD 50 million.

To know about the assumptions considered for the study, download the pdf brochure

Market Estimation Methodology

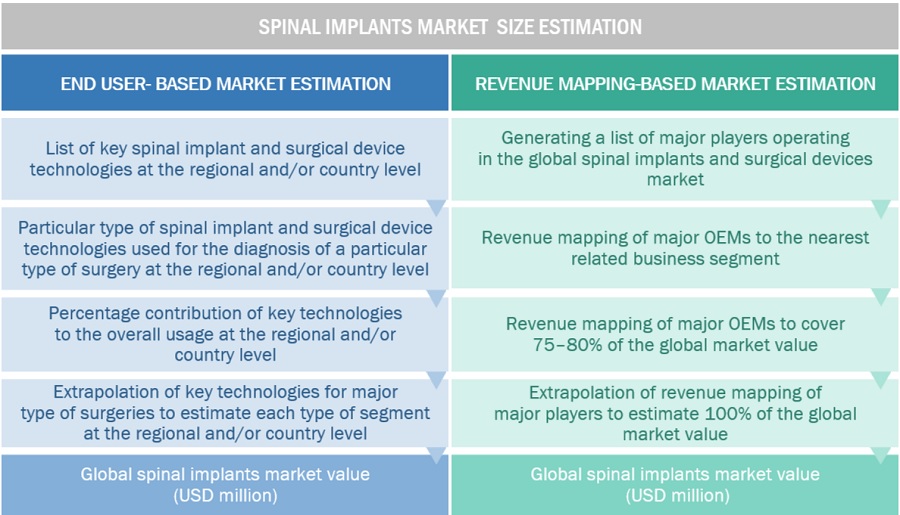
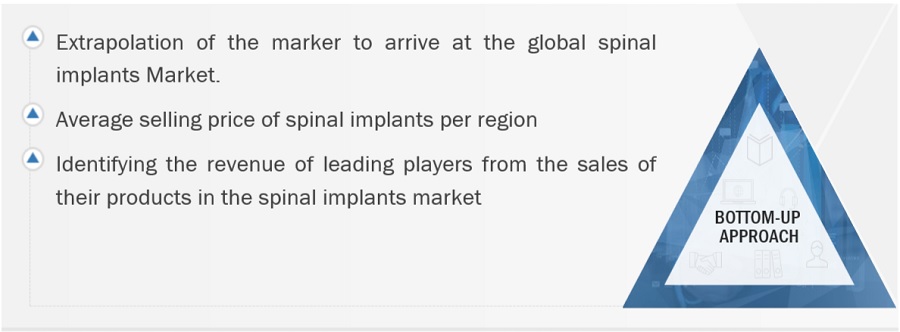
In this report, the global spinal implants market size was arrived at by using the revenue share analysis of leading players. For this purpose, key players in the market were identified, and their revenues from the spinal implants business were determined through various insights gathered during the primary and secondary research phases. Secondary research included the study of the annual and financial reports of the top market players. In contrast, primary research included extensive interviews with key opinion leaders, such as directors, CEOs, and key marketing executives.

To calculate the global market value, segmental revenues were calculated based on the revenue mapping of major solution/service providers. This process involved the following steps:

  • Generating a list of major global players operating in the spinal implants market
  • Mapping annual revenues generated by major global players from the spinal implants market segment (or nearest reported product category/ business unit)
  • Revenue mapping of key players to cover a major share of the global market, as of 2022
  • Extrapolating the global value of the spinal implants industry

Global Spinal Implants Market: Bottom-Up Approach
Spinal Implants Market Size, and Share

To know about the assumptions considered for the study, Request for Free Sample Report

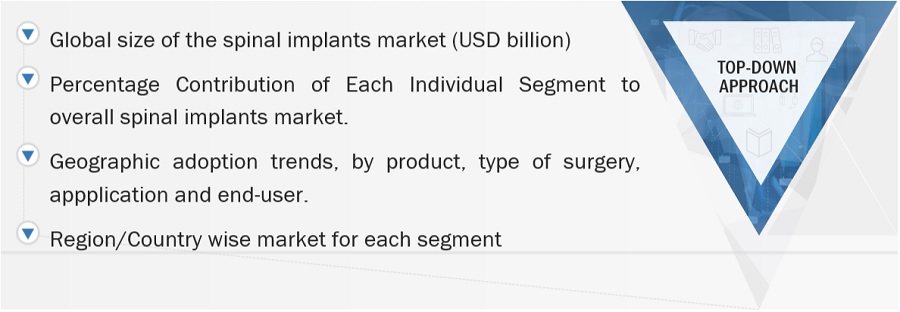
Global spinal implants market: Top-Down Approach
Spinal Implants Market Size, and Share

Spinal Implants Market Size, and Share

Data Triangulation

After arriving at the overall market size from the market size estimation process explained above, the global spinal implants market was split into segments and subsegments. Data triangulation and market breakdown procedures were employed to complete the overall market engineering process and arrive at the exact statistics for all segments and subsegments. The data was triangulated by studying various factors and trends from both the demand and supply sides. Additionally, the spinal implants market was validated using both top-down and bottom-up approaches.

Market Definition

Spinal implants are instruments used by surgeons to repair spinal deformities, strengthen and stabilize the spine, and promote fusion. Degenerative disc disease, kyphosis, scoliosis, spondylolisthesis, and fractures are among the conditions that can be addressed by spinal implants.

The materials used to make implants are biocompatible, or friendly to the body, and they can offer the best possible spinal stability and strength. A common component of spinal fusion surgery is the use of spinal implants. As your spine heals from the surgery, the implants aid in maintaining the position of the vertebrae.

Key Stakeholders

  • Spine surgery device manufacturing companies
  • Distributors and suppliers of spinal surgery devices
  • Healthcare institutions (hospitals and outpatient clinics)
  • Research institutions
  • Research and consulting firms
  • Contract research organizations (CROs) and contract manufacturing organizations (CMOs)
  • Academic medical centers and universities
  • Market research and consulting firms
  • Hospitals
  • Outpatient facilities

Objectives of the Study

  • To define, describe, and forecast the spinal implants market based on product, type of surgery, type of surgery, application, end user, and region.
  • To provide detailed information regarding the major factors influencing the market growth (such as drivers, restraints, opportunities, and challenges)
  • To strategically analyze the micro markets with respect to individual growth trends, prospects, and contributions to the total market.
  • To analyze the opportunities in the market for stakeholders and provide details of the competitive landscape for market leaders.
  • To profile the key market players and comprehensively analyze their market shares and core competencies.
  • To forecast the revenue of the market segments with respect to five main regions, namely, North America (US and Canada), Europe (Germany, France, the UK, Italy, Spain, and Rest of Europe), the Asia Pacific (China, Japan, India, South Korea, Australia, and Rest of Asia Pacific), Latin America (Brazil, Mexico, and Rest of Latin America), and the Middle East & Africa.
  • To track and analyze competitive developments such as new product launches and approvals; agreements, expansions, acquisitions, partnerships; and collaborations in the spinal implants market.

Available Customizations

With the given market data, MarketsandMarkets offers customizations as per the company’s specific needs. The following customization options are available for the present global spinal implants market report:

Product Analysis

  • Product matrix, which gives a detailed comparison of the product portfolios of the top fifteen companies.

Company Information

  • Detailed analysis and profiling of additional market players (up to 15)

Geographic Analysis

  • Further breakdown of the Rest of Europe spinal implants market into Russia, Belgium, the Netherlands, Switzerland, Austria, Finland, Sweden, Poland, and Portugal among other
  • Further breakdown of the Rest of Asia Pacific spinal implants market into Singapore, Taiwan, New Zealand, Philippines, Malaysia, and other APAC countries
  • Further breakdown of the Rest of the world spinal implants market into Latin America, MEA, and Africa
Custom Market Research Services

We will customize the research for you, in case the report listed above does not meet with your exact requirements. Our custom research will comprehensively cover the business information you require to help you arrive at strategic and profitable business decisions.

Request Customization

Instant Answers with GPT - Ask Now!

Ask real questions. Get complete answers !
Report Code
MD 1173
Published ON
Jan, 2024
Choose License Type
BUY NOW
  • SHARE
X
Request Customization
Speak to Analyst
Speak to Analyst
OR FACE-TO-FACE MEETING
PERSONALIZE THIS RESEARCH
  • Triangulate with your Own Data
  • Get Data as per your Format and Definition
  • Gain a Deeper Dive on a Specific Application, Geography, Customer or Competitor
  • Any level of Personalization
REQUEST A FREE CUSTOMIZATION
LET US HELP YOU!
  • What are the Known and Unknown Adjacencies Impacting the Spinal Implants Market
  • What will your New Revenue Sources be?
  • Who will be your Top Customer; what will make them switch?
  • Defend your Market Share or Win Competitors
  • Get a Scorecard for Target Partners
CUSTOMIZED WORKSHOP REQUEST
+1-888-600-6441
  • Call Us
  • +1-888-600-6441 (Corporate office hours)
  • +1-888-600-6441 (US/Can toll free)
  • +44-800-368-9399 (UK office hours)
CONNECT WITH US
ABOUT TRUST ONLINE
©2024 MarketsandMarkets Research Private Ltd. All rights reserved
DMCA.com Protection Status Website Feedback